Balancing difficulty and score
Learn how to balance difficulty and score: an example based on Stack Jump developed by ChimpWorks. The following example is based on Stack Jump (App Store.
The following example is based on Stack Jump (App Store; Google Play) developed by ChimpWorks and published by VooDoo.
In Stack Jump, you’re tasked with building the highest tower possible. Instead of dropping blocks on top of each other, your character needs to jump into the air as blocks slide underneath it. Timing your jumps is key: if you jump too early, or too late, you’ll get knocked off and it’s game over.

1. Deconstruction
Core mechanic: Jump to stack blocks, and build the tower.
Score System: Perfectly aligning blocks gives a boost in points. Consecutive perfect jumps act as points multipliers. Imperfect jumps reset the multiplier.
Lose condition: Failing a jump.
2. Building the Stack Jump Diagram
Hit the Play button and follow what happens:
- The Source (triangle-shaped component) produces a Block every second.
- The action of the player jumping is represented by the Jump Gate ◇
- The Jump Gate will distribute the Jump towards either the Failed or the Successful jump Pools ◦
- This is done according to the % of the connections (Resource Connections) going out of the Fail/Jump Gate. The player has a 5% chance to Fail a jump and a 95% chance to Succeed.
- The Failed and Successful Pools store the Resources (the Jumps) that were transferred.
1 Step = 1 core loop OR
1 Step = 1 game played
Hit the Play button and follow what happens:
- The dotted line (State Connection) going from the Fail Pool, towards the Game Over component, constantly checks the “state” of the Pool that gathers Failed Jumps.
- Once the Pool has a number of Resources which is “>0”, it will activate the Game Over component.
- The Game Over component is an End Condition. When triggered, this will immediately stop the diagram from playing.
The State of a Machinations diagram refers to the current distribution of Resources among its Nodes. When Resources get redistributed, the State of the diagram/system changes.
Normal Jump Score System
You know the drill: hit Play.
- Successful jumps can be Normal or Perfect. That’s why the Pool that in the previous versions of the diagram stored Successful jump Resources, is now replaced by a Gate.
- Same as with the Fail/Succeed Gate, the Successful Gate redirects a Successful jump Resource towards a Normal or a Perfect jump.
- We’ve given the player a fifty-fifty chance of making either one. This is achieved by the 50%-50% chance on the Resource Connections going out of the Gate.
- 1 Normal jump gives out 1 Point to the player.
- When a Normal jump Resource goes into the Pool that stores them, the Activate State Connection activates the Source. This generates 1 Point, which is then stored in the Normal Jump Points Pool.
State Connections are used to influence the state of components on the diagram.
State Connections whose Type is Trigger are called Triggers.
Triggers are commonly used to react to state changes or perform state changes.
Perfect Jump Score System
- Perfect jumps get stored in the Perfect Pool.
- The more consecutive Perfect jumps a player performs, a score multiplier is applied.
- When a Perfect Jump is performed, so a Perfect Jump Resource reaches the Perfect Pool, the Activate State Connection activates the Points Source.
- You will notice that the Resource Connection that goes from the Source to the Perfect Jump Points is 0.
- This is where the second State Connection Labeled
multipliercomes in. This connection takes the input from the Perfect Pool (the number of Resources present in the Pool) and populates themultipliervariable from the Register’s formula:floor((1+sqrt(1+8*multiplier))/2) - The result of the formula is added to the 0 on the Resource Connection that sets how many Point Resources get produced by the Source.
In Machinations, Registers are used to alter the state of Nodes or influence the flow of Resources based on the computation of multiple inputs coming from either Nodes in the diagram or your own input during a Play.
The Formula field for Registers supports functions from the math.js library.
The floor(x) formula in this example, rounds the multiplier value applied to the Perfect Jump Score towards minus infinity, so that the score is always an integer.
Resetting the Perfect Jump Multiplier
- The Reset Multiplier Sink (the up-side-down triangle) is activated when a Normal jump is performed. This will drain all (notice the Formula on the Resource Connection going out of the Perfect Pool to the Sink) Resources from the Perfect Pool. This Resets the Multiplier points system until another Perfect jump is performed.
A Resource that goes into a Sink is permanently removed from a game’s economy.
The Score
This is the last note and the big reveal Hit Play.
- The Score Register adds the Normal Jump Points and the Perfect Jump Points, stored in their respective Pools.
3. I have a diagram. Now what?
Once your model is where you envisioned it, it’s time to balance it.
Whenever you hit Play on a diagram, each Node produces data points. Pools and Registers can be plotted on the Chart, so you can visualize their evolution.
In the final model for Stack Jump, I have already added the Score Register to the Chart. Hit Play and witness how a player’s score may evolve during a game, considering all the parameters we’ve set.
On the embedded diagram, use the Open in my Machinations button. This opens a copy of this diagram in your Machinations account, where you can make Forecasts on it. Do this, and follow along.
Now that the diagram is in your account, you can Forecast it. A Forecast Plays the system you created many times in a row, and every Forecast is made on Machinations’ cloud servers.
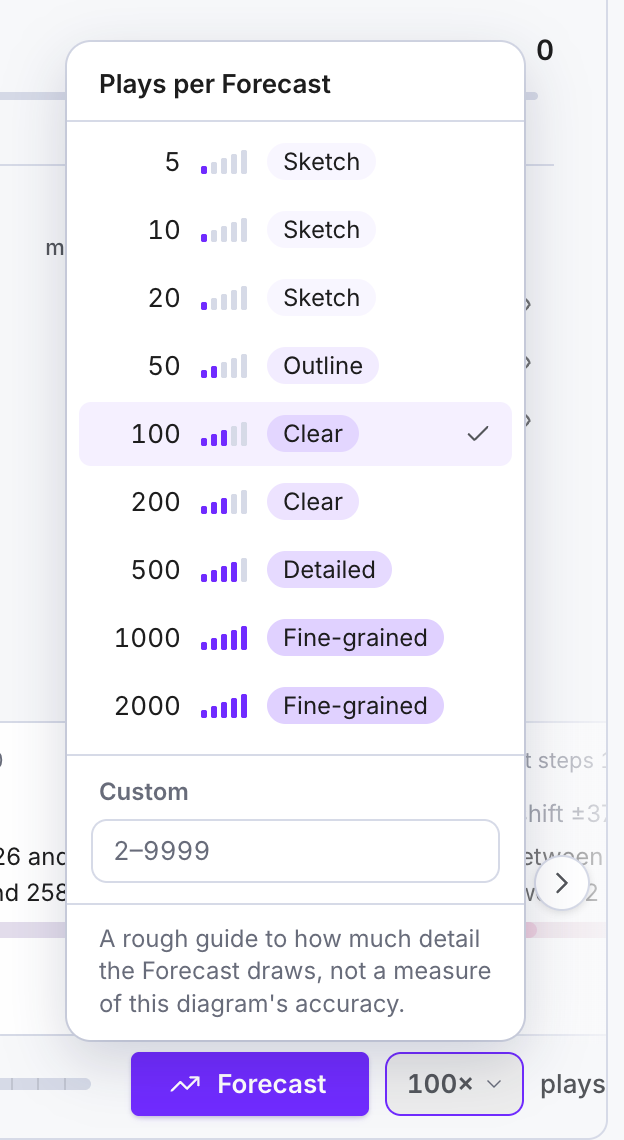
Open the menu next to the Forecast button (it reads 10× at first), choose 100 (or type 100 in Custom), and press Forecast. When the Forecast starts, Machinations opens the Scenarios tab, where its result appears.
The Forecast Plays the diagram 100 times on our servers and draws the results in the chart. When it finishes, you’ll get a chart that looks similar to this.
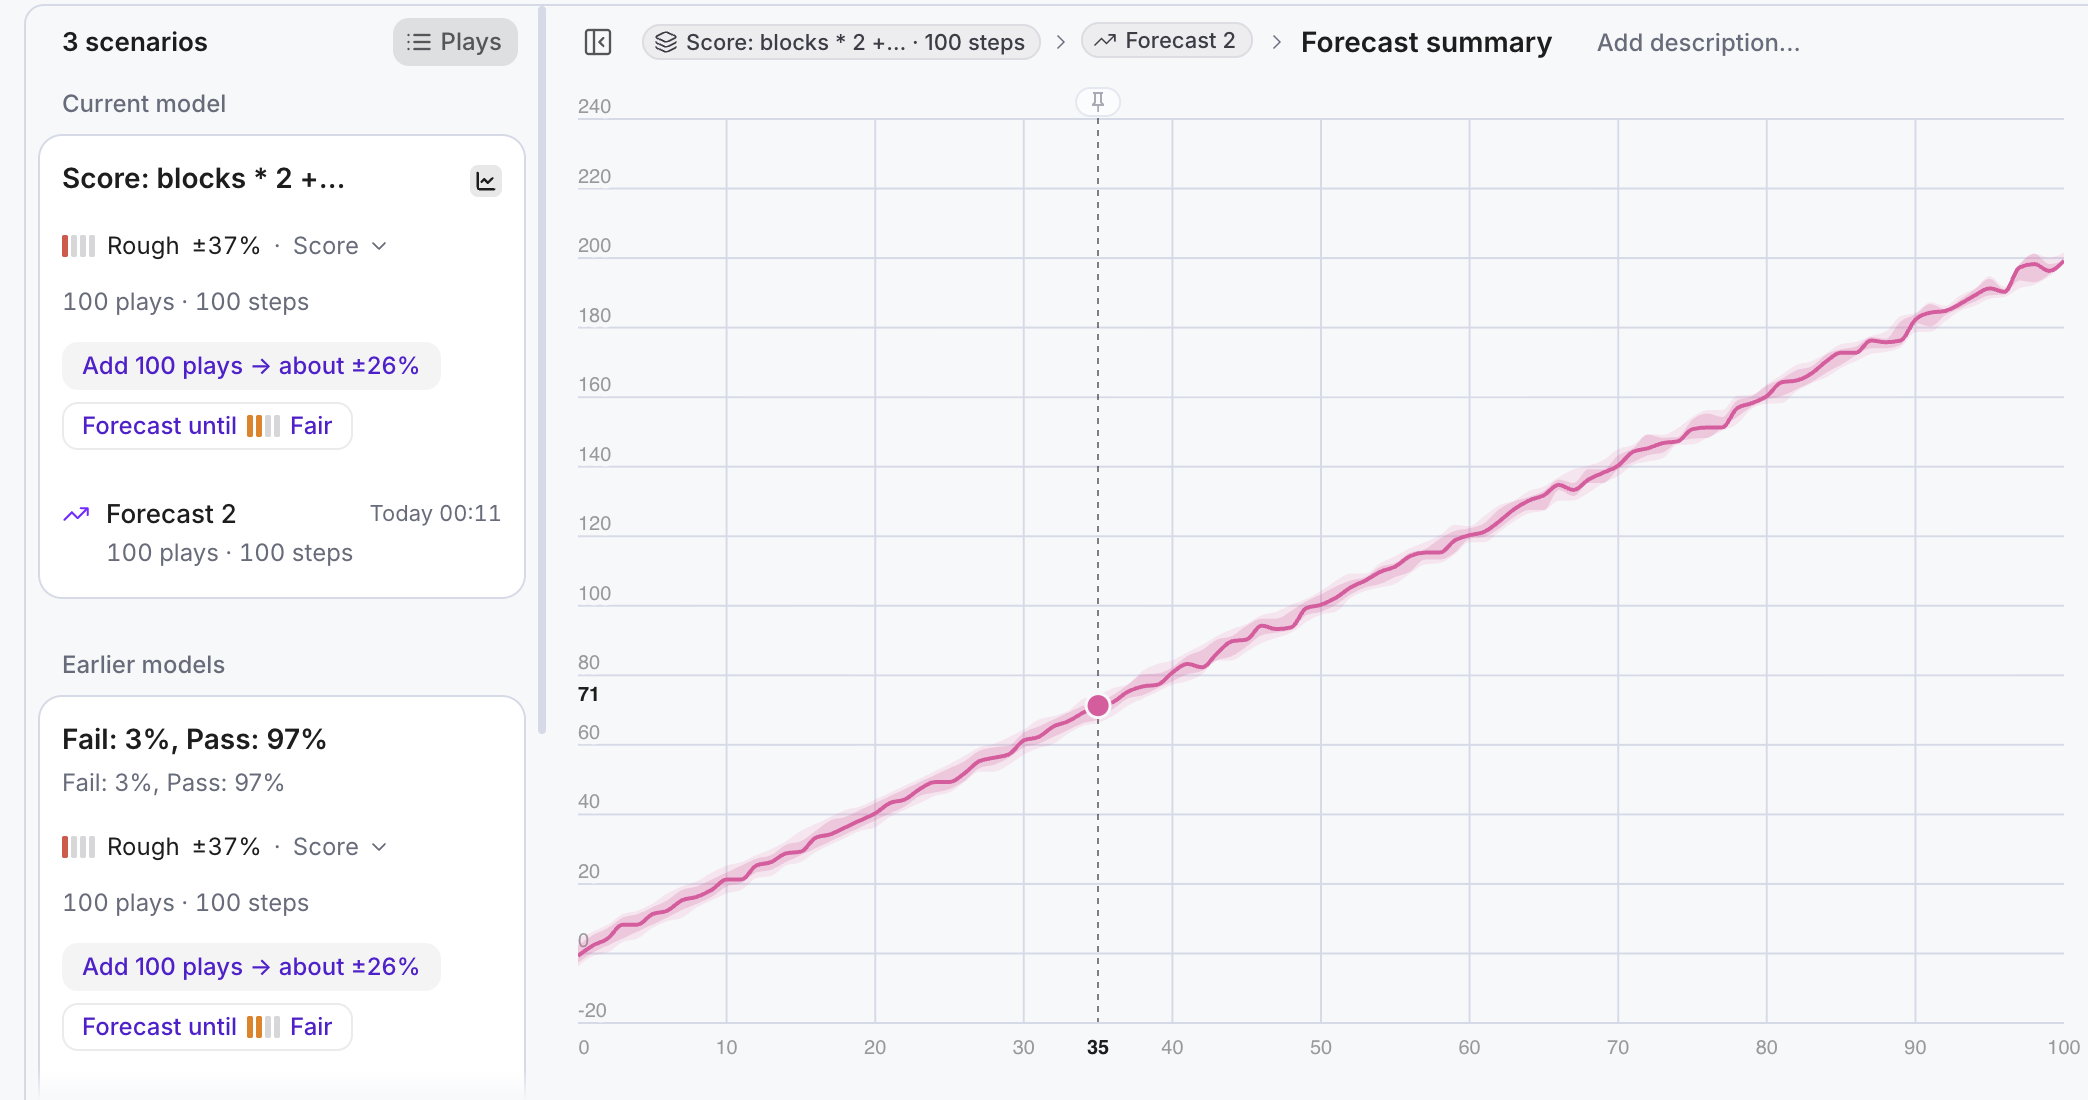
Insights:
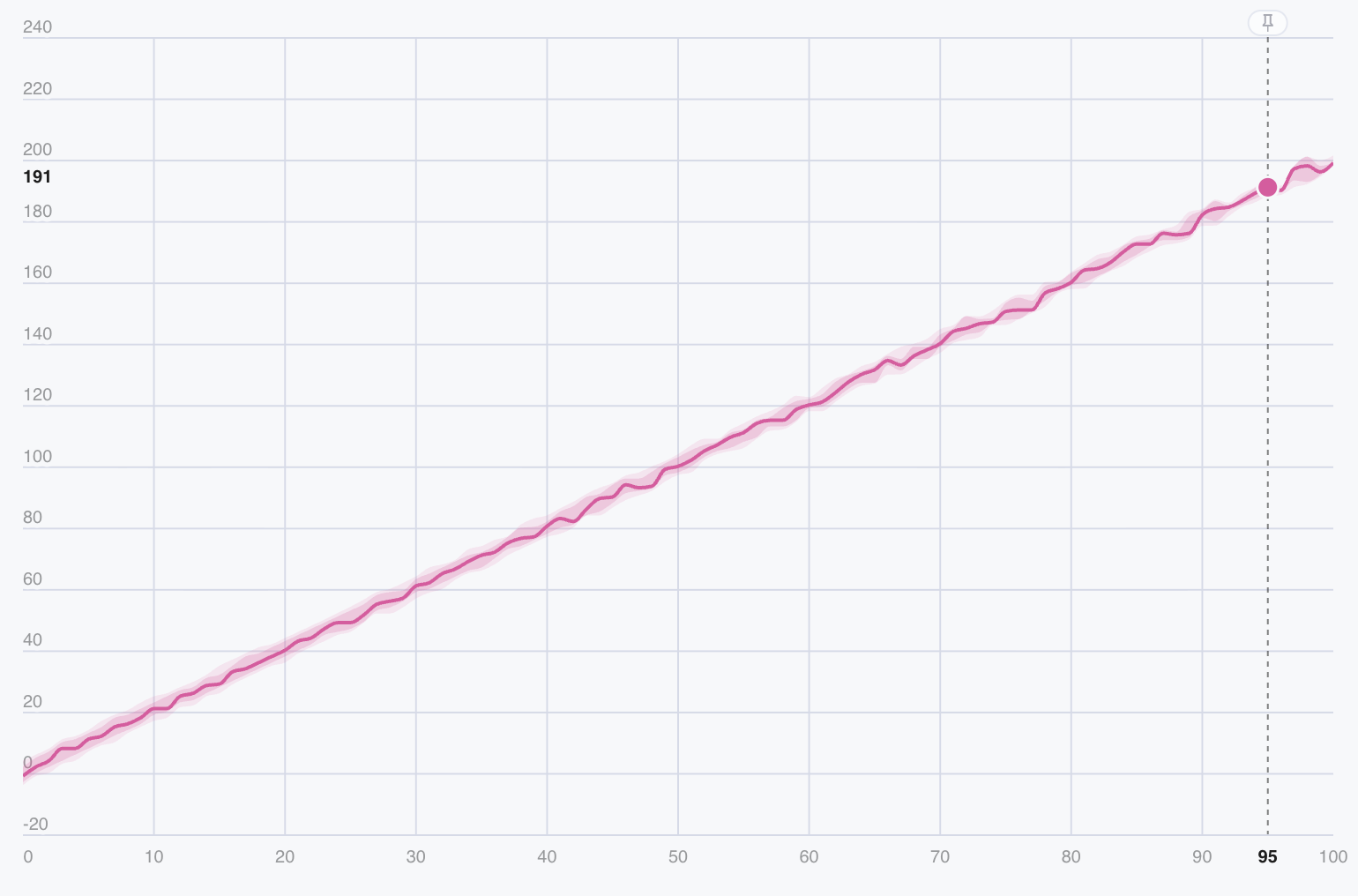
- The highest score out of 100 Plays: is 203, with a tower that’s 100 blocks high (Step count, since 1 Step is 1 Block)
- Half of the Plays end with a tower of 8 to 47 blocks, and the median is about 24 blocks
For a closer look, read the table beside the chart: for each node it lists the median, the min–max range and the mean at the chosen step.
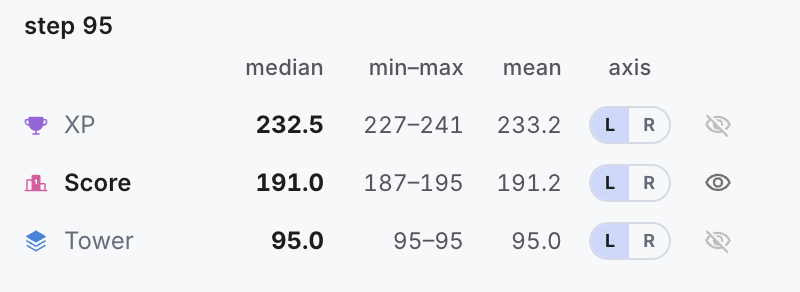
Move the pointer over the chart to read these values at any step.
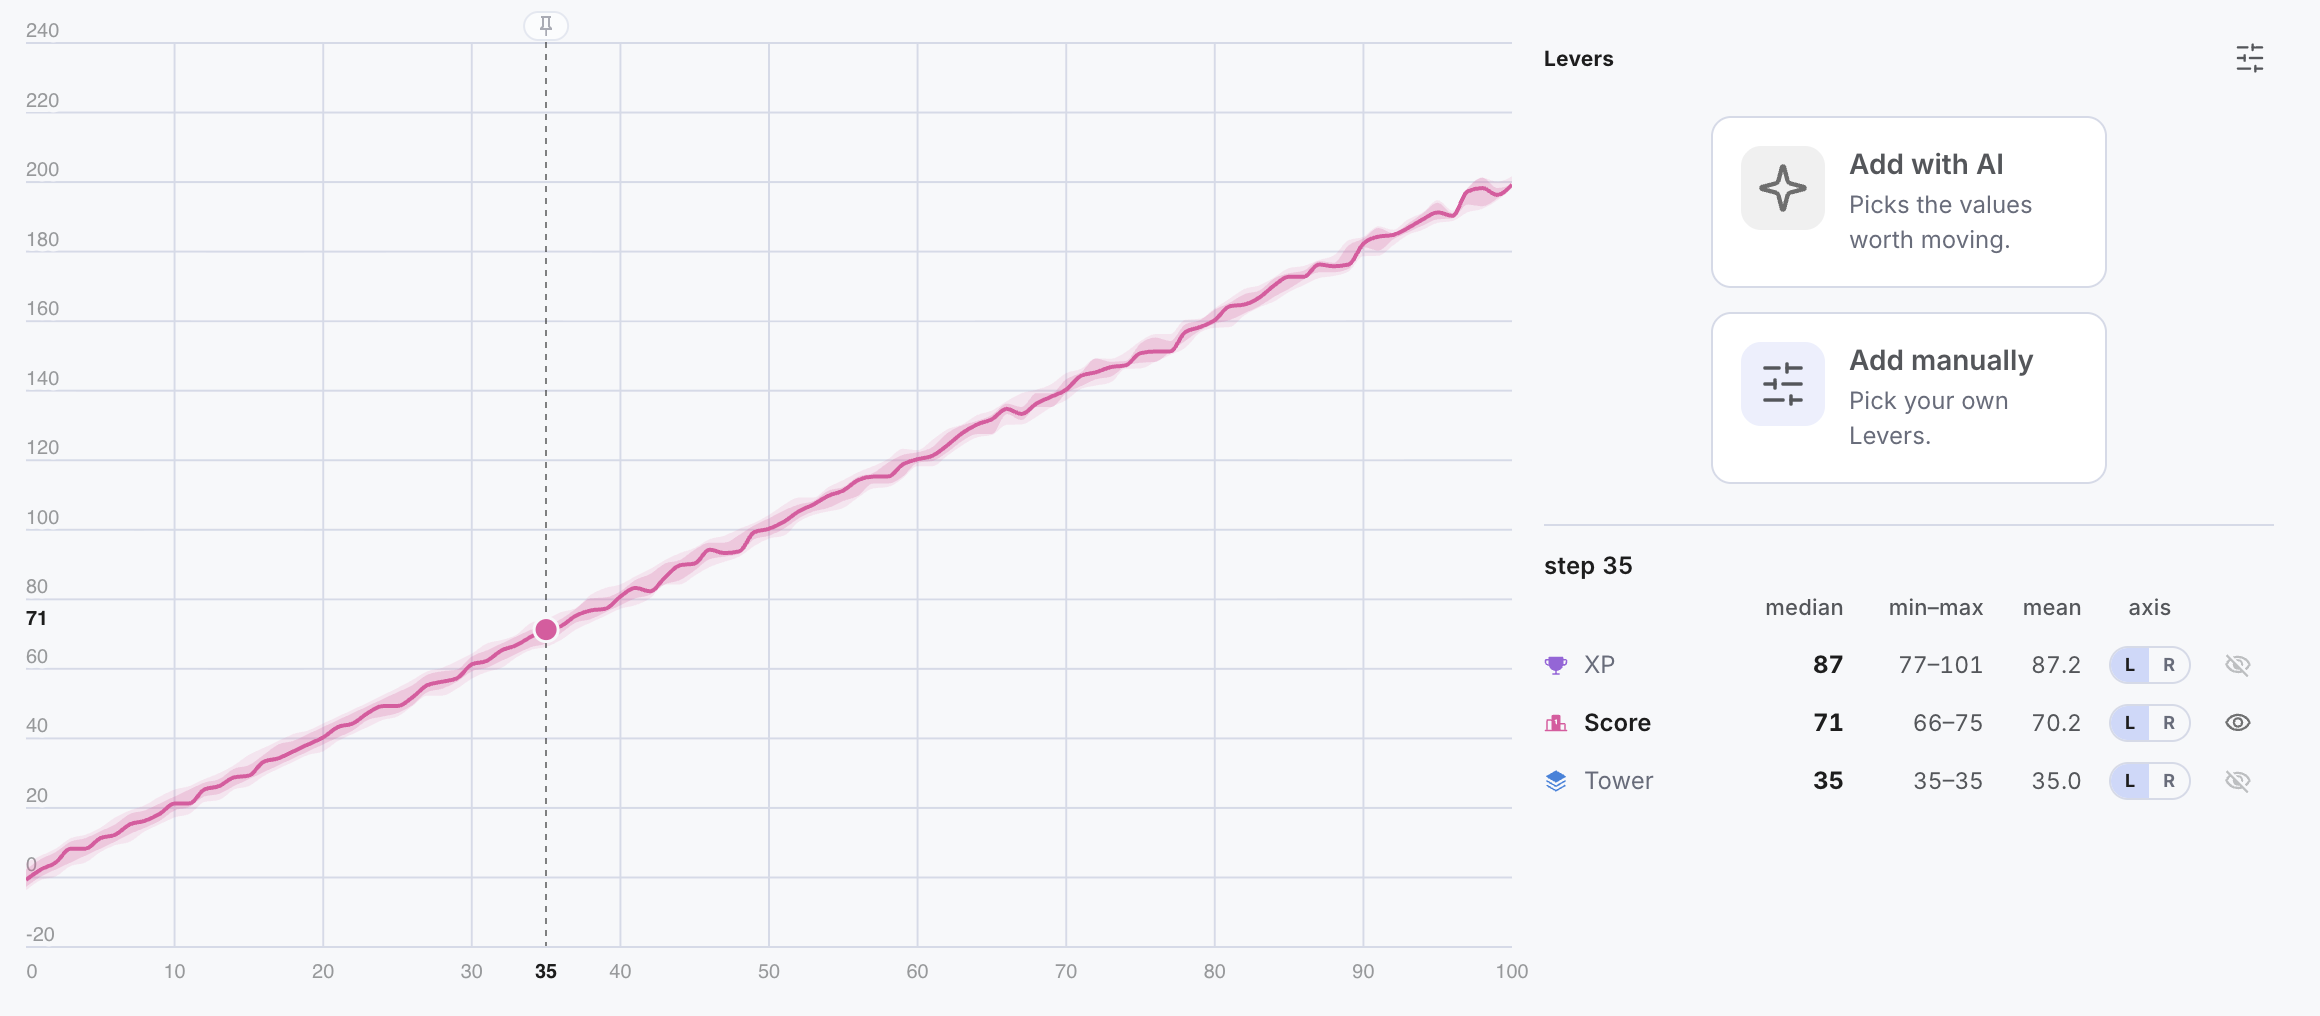
- For where the density of the graph is highest, a player will reach a score of maximum 67, minimum 47 and an average of 54
Your Forecasts on the same diagram, with the same odds, might look slightly different than the ones above. That’s because Machinations accounts for randomness at each of the actions it computes during a Play of the diagram.
In the beginning of this example, we made several assumptions, the first being about player skill. This translates into the % of Fail vs Succeed. We assumed players would succeed at a jump 95% of the time. This may be true for a skilled player, but what would our stats look like for a beginner?
On the diagram copy you’ve made, change the % on the Fail and Succeed Resource Connections to 25% and 75%, respectively.
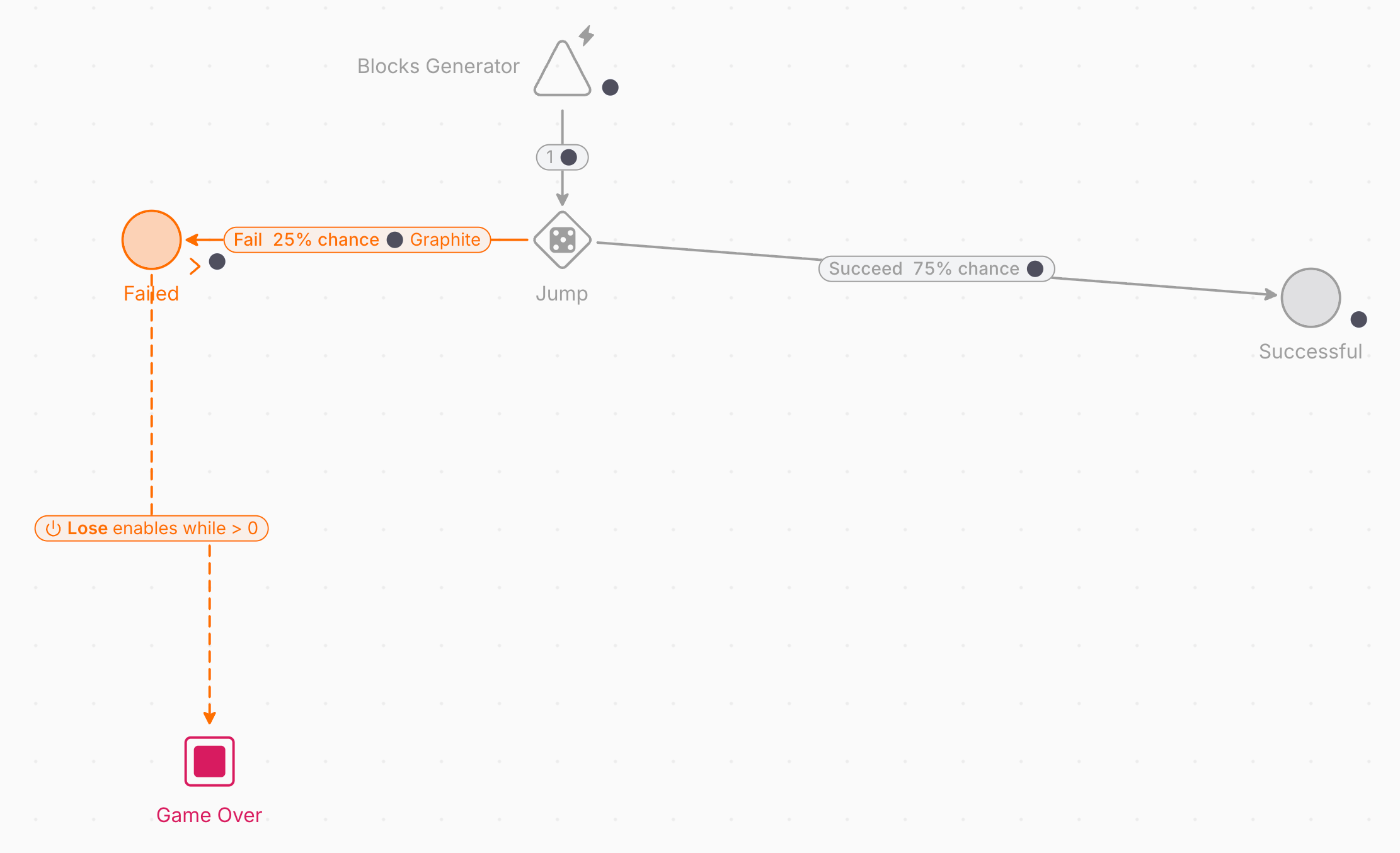
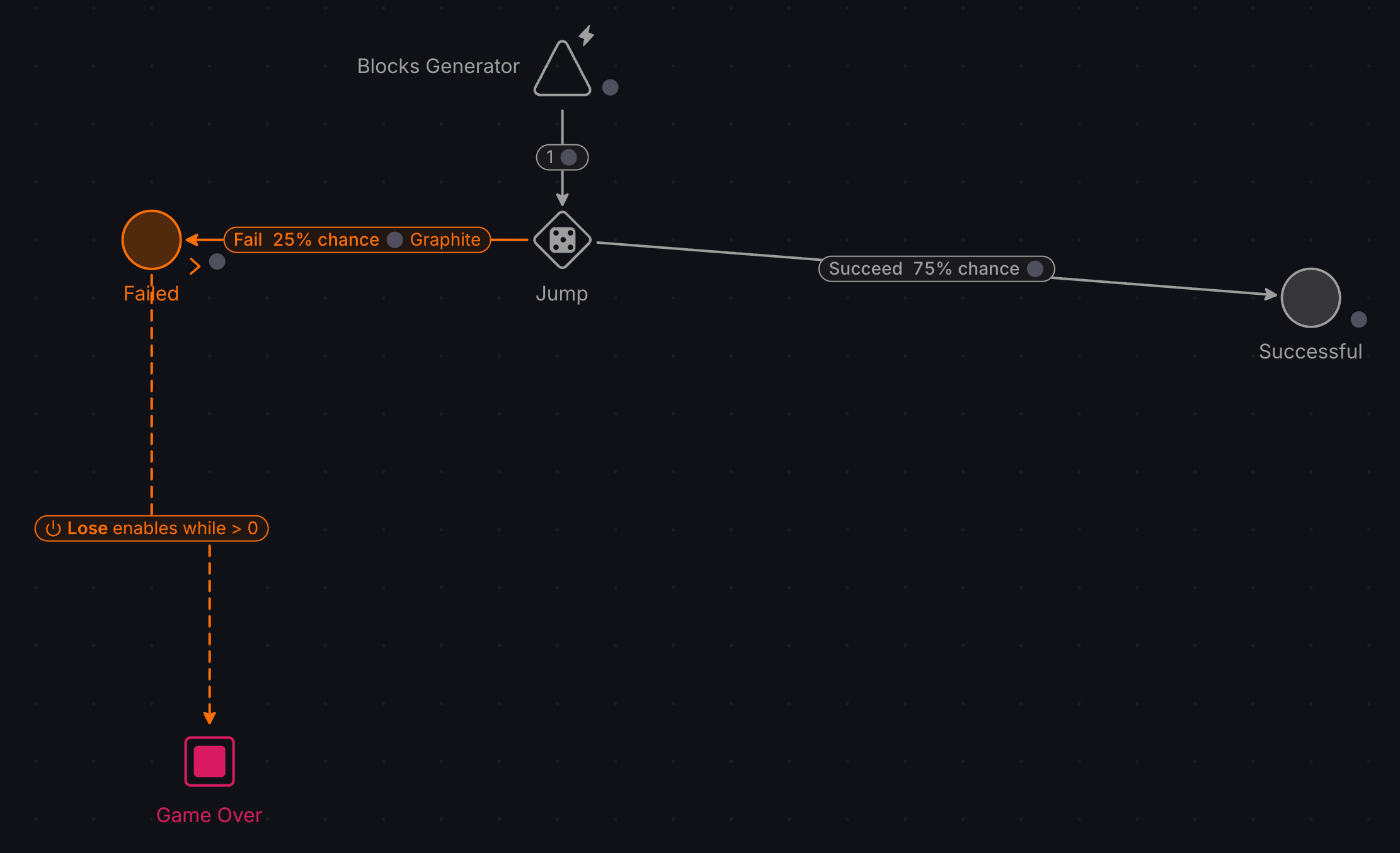
Editing the model starts a new scenario, so the first Forecast stays with the earlier model.
Make a Forecast of 100 Plays with the new parameters.
How do the stats for a beginner look like as opposed to an advanced/more skilled player?
All Forecasts you make on the diagram are saved with it and listed on the left of the chart panel, grouped by scenario: when you edit the model, the next Play starts a new scenario. You can rename each one, to have a clear record of what you have tested and its results.
Since we’re looking at types of players, we named these two Advanced and Beginner Players.
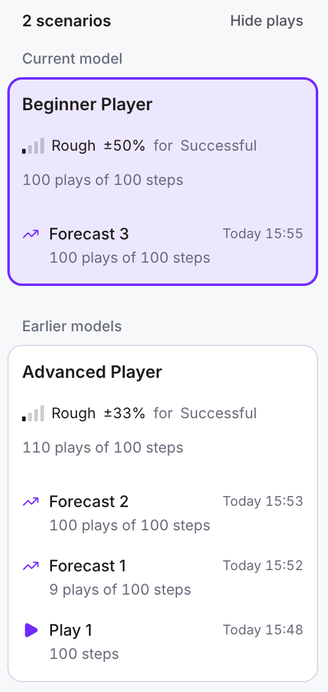
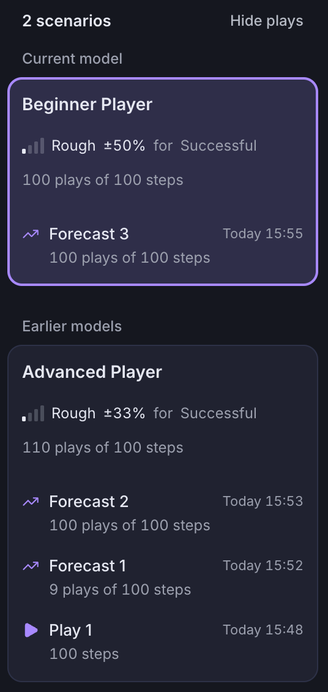
As with any Forecast, the more Plays a Forecast makes, the more accurate its results.
4. Challenges
Stack Jump monetizes in 3 ways: via banner ads and forced videos, via a premium version with no ads, and via rewarded videos – the Second Chance mechanic.
How would you model the Second Chance mechanic and connect it to the gameplay diagram in the example above?
Hints:
- The Second Chance is granted only once per game. First figure out how you need to expand the Fail branch of the diagram to implement a Second Chance mechanic that’s granted each time a Fail happens.
- Once you have figured that out, how do you stop offering Second Chances? Is it a secondary condition that can trigger the Game Over Node?
Stack Jump also has 4 types of challenges each with 12 levels. These are used as training grounds.
- How would you model them in Machinations?
- How would you implement a system that influences the Fail/Succeed parameters, based on challenge completion, considering their level of completion would increase a player’s skill?