A shared language for complex systems
Plain definitions of the economics and systems ideas behind finance, energy, healthcare, operations, tokenomics and games. Each has a worked example, and many have a Machinations diagram you can open and Play.
Abstracting
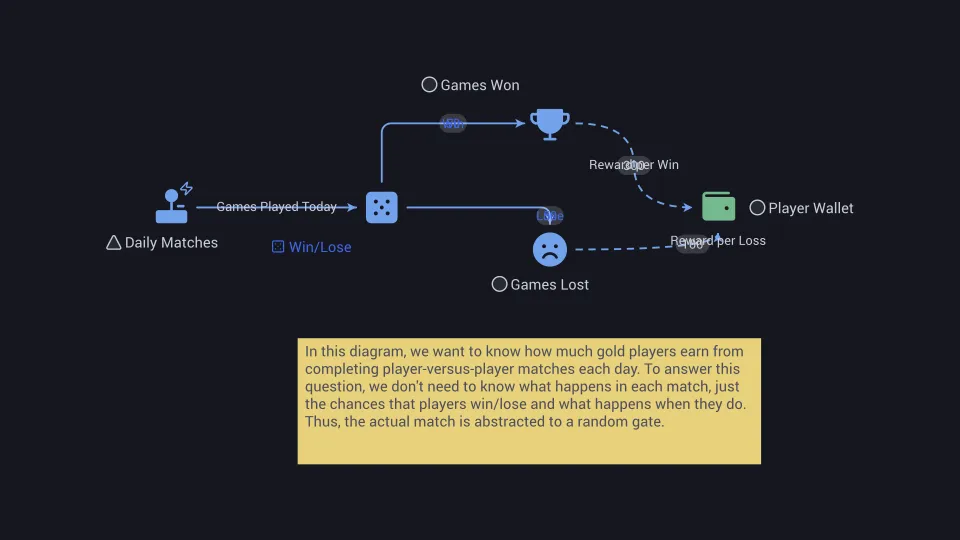
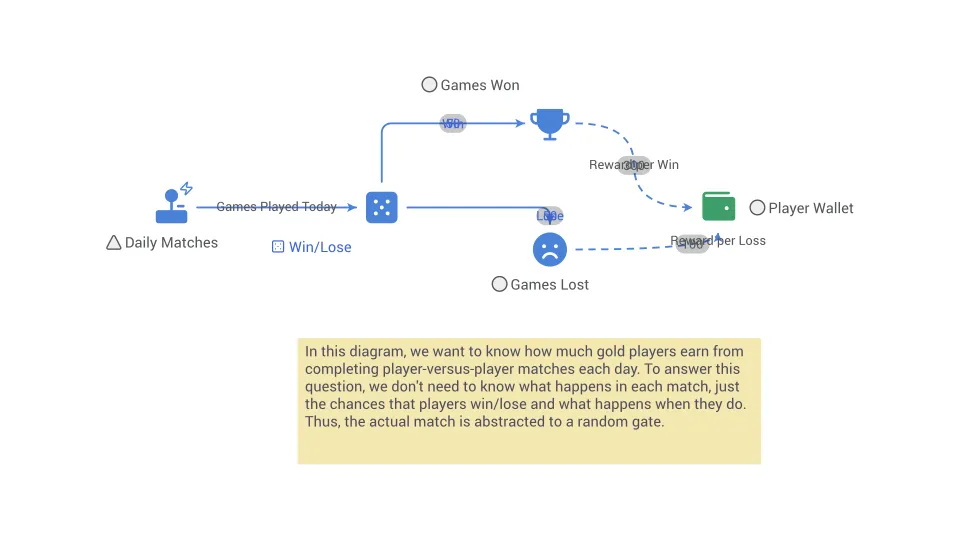
In game system modeling, abstraction is key. Skip excessive detail; focus on questions your model answers for maximum productivity.
Adverse selection
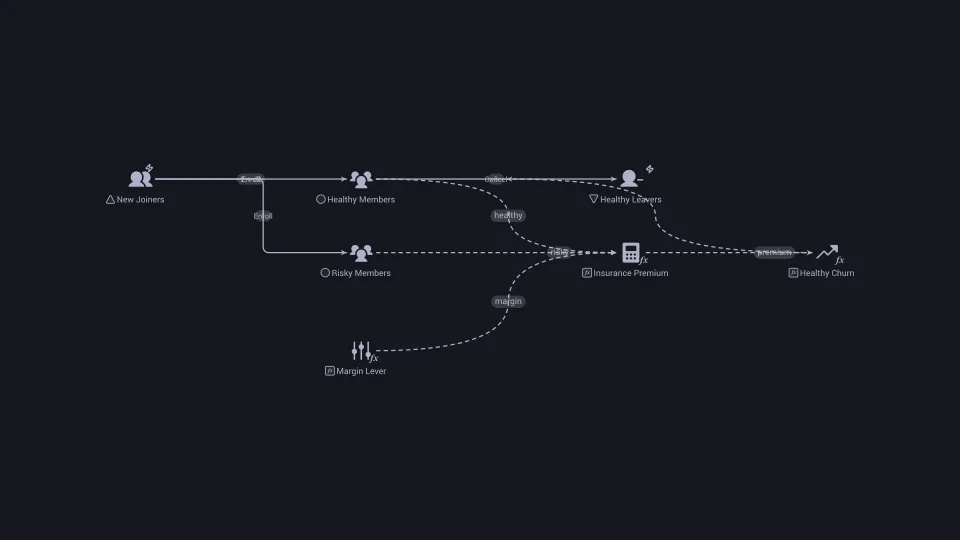
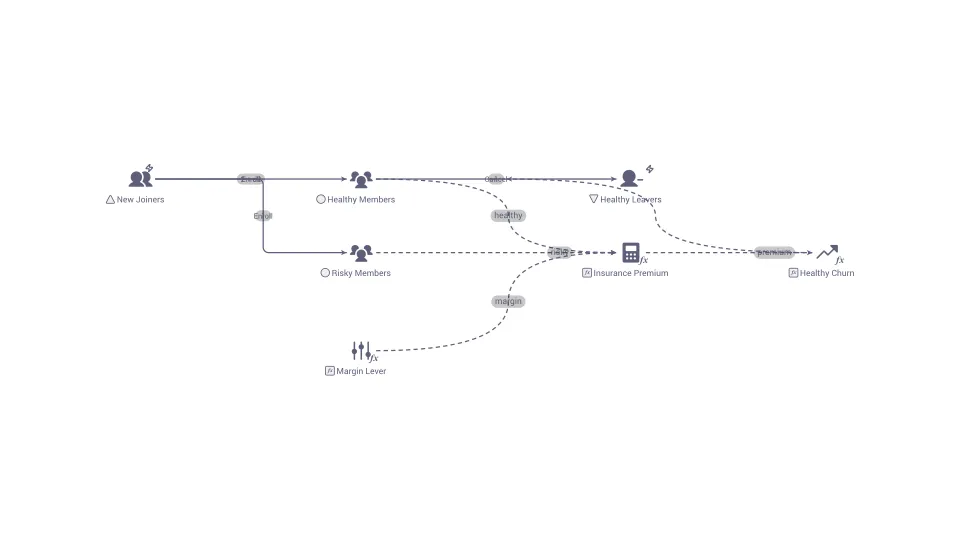
What happens when the people most likely to cause a loss are the ones most likely to buy, which pushes the price up for everyone.
Agency
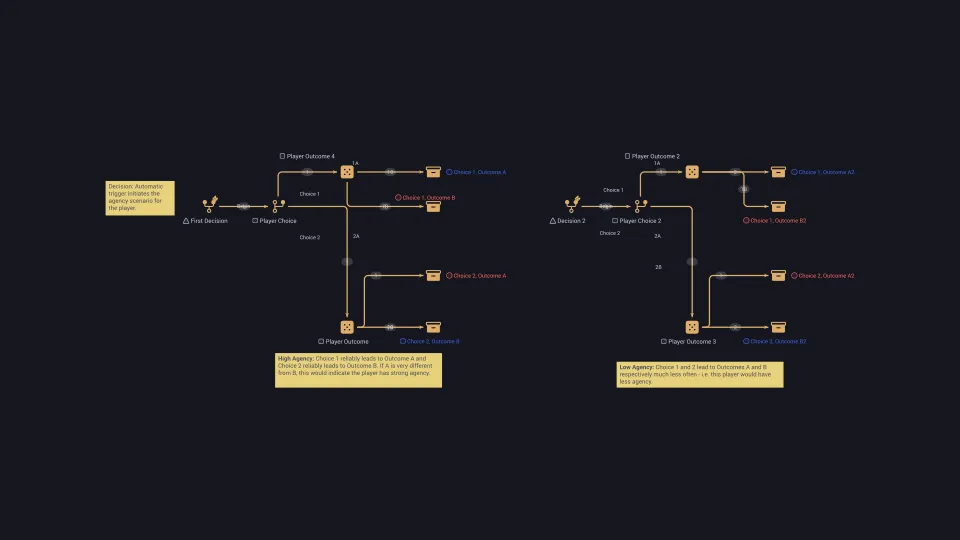
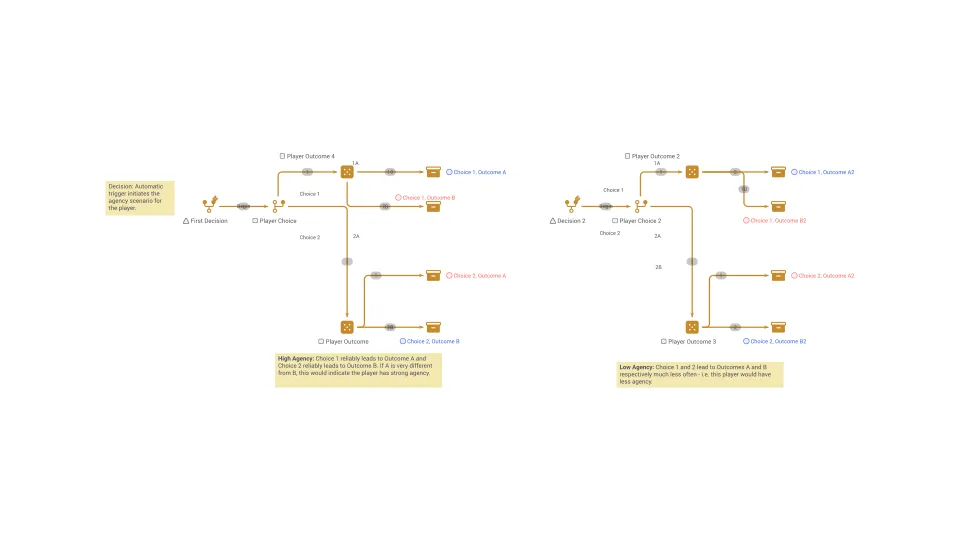
With agency, player's choices have a tangible impact on the game world.
Agent-based modeling (ABM)
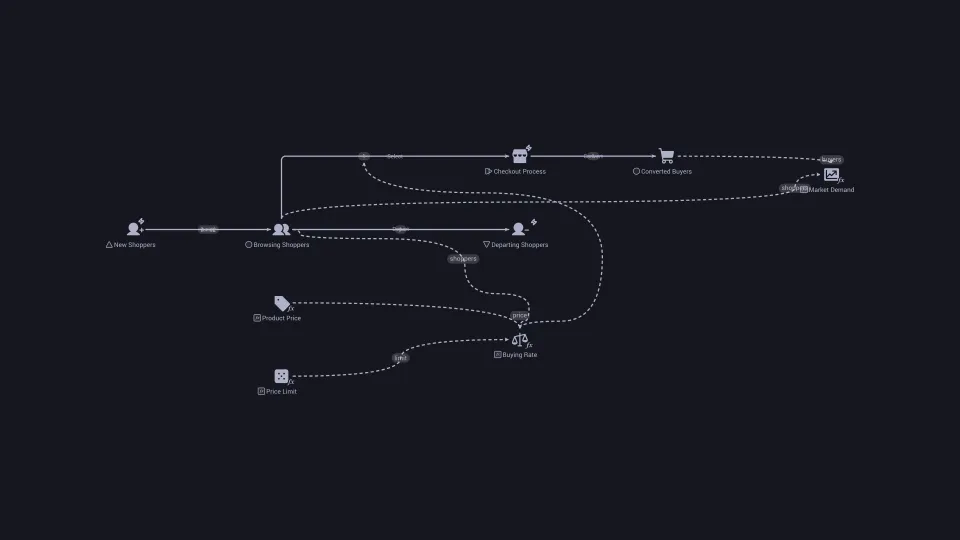
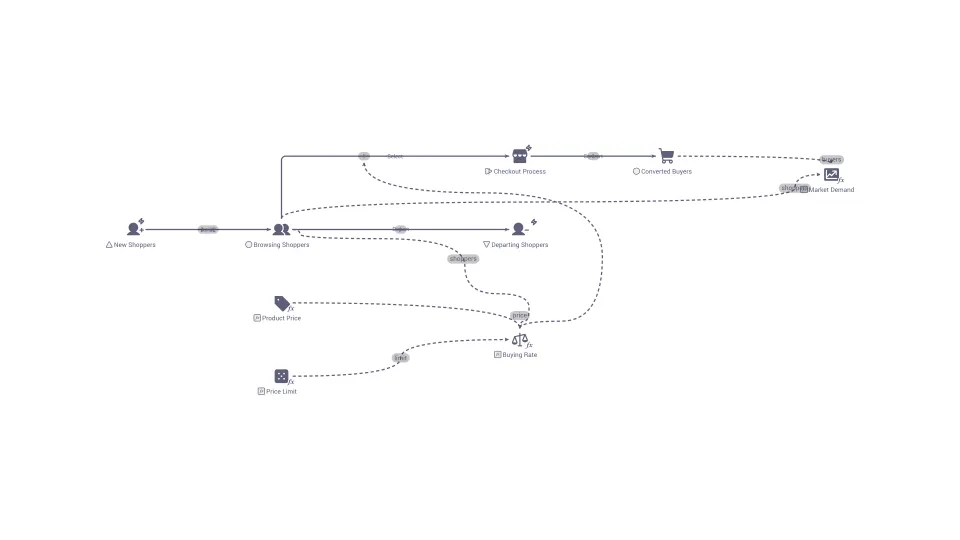
Agent-based modeling (ABM) builds a model from many individual actors following their own simple rules, so the overall pattern emerges from their interactions.
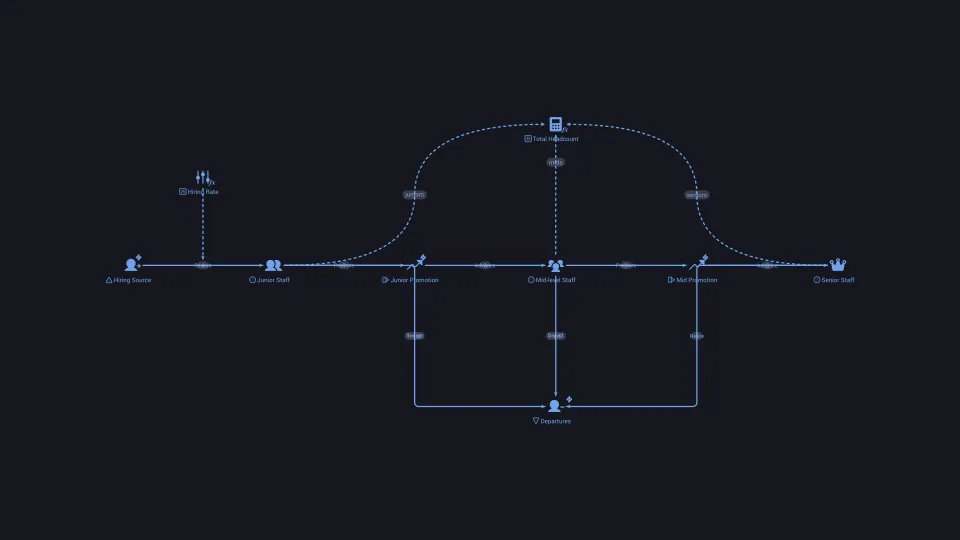
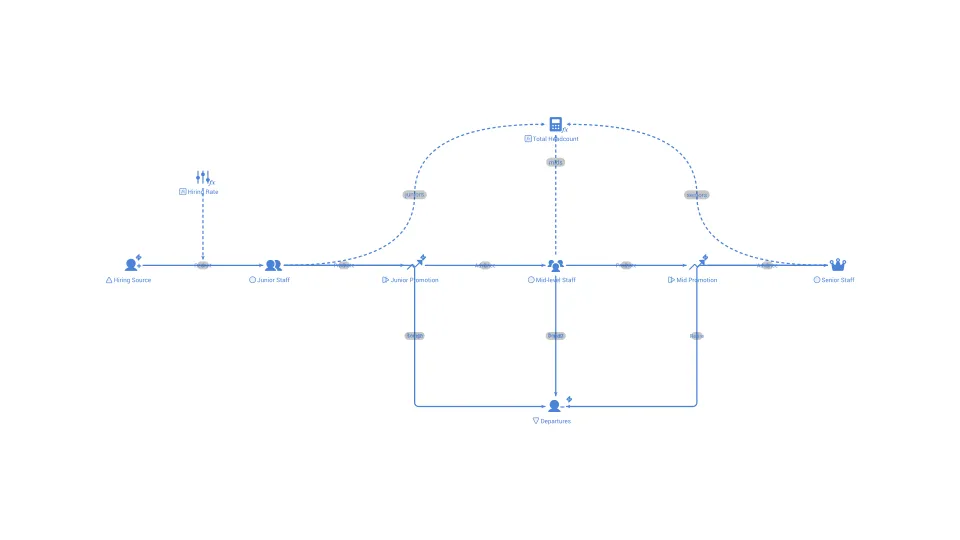
Aging chain
A series of connected stocks in which items move one stage at a time, such as junior to senior staff or young to old trees.
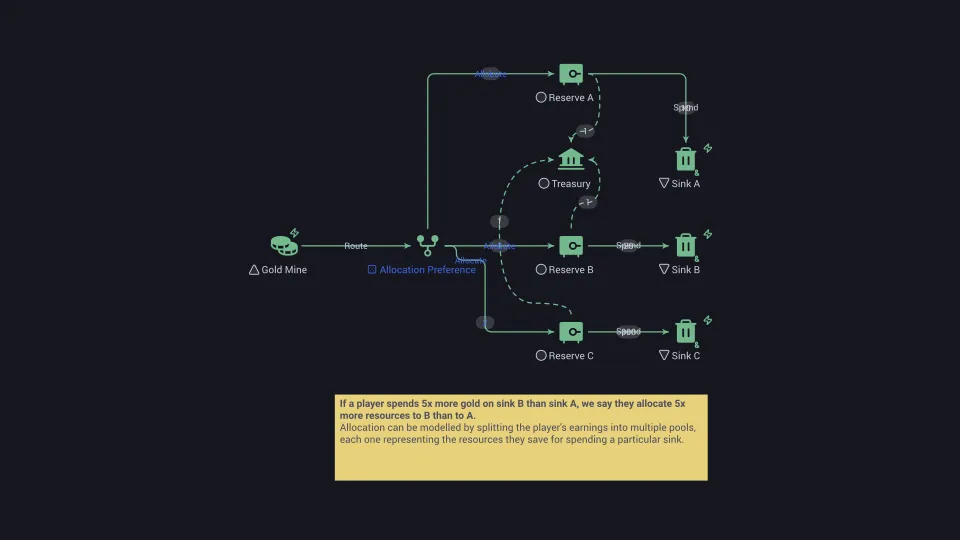
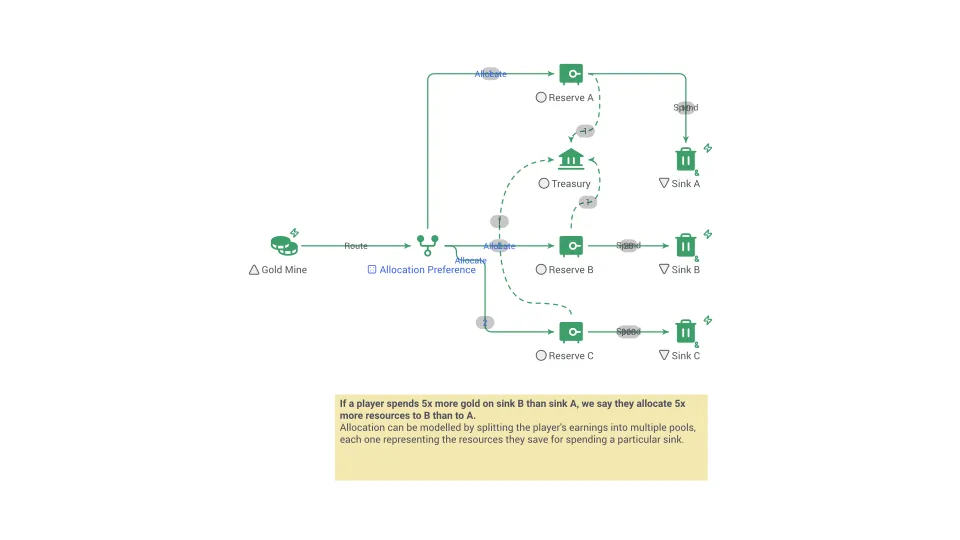
Allocation of earnings
How a person or organization divides the income it earns among competing uses such as spending, saving, investing and paying debts.
Arbitrage
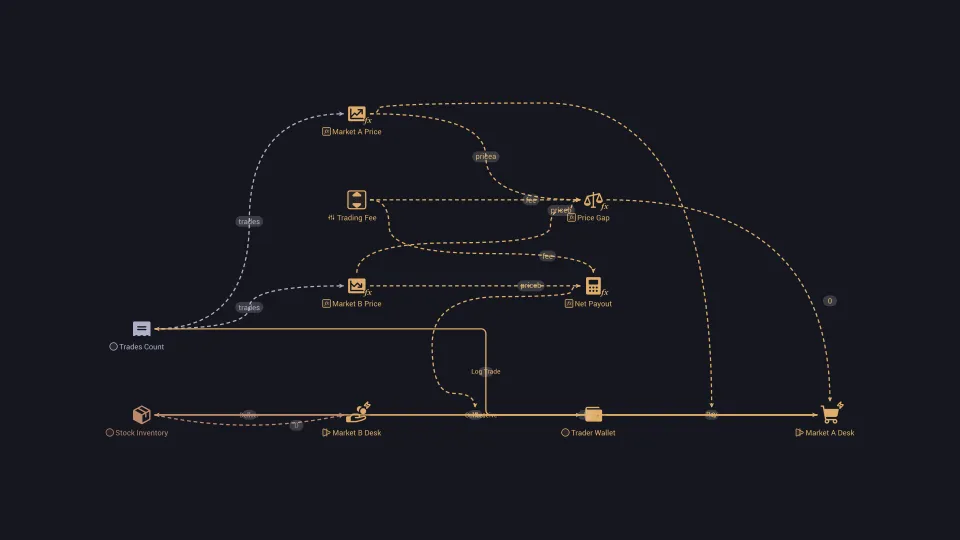
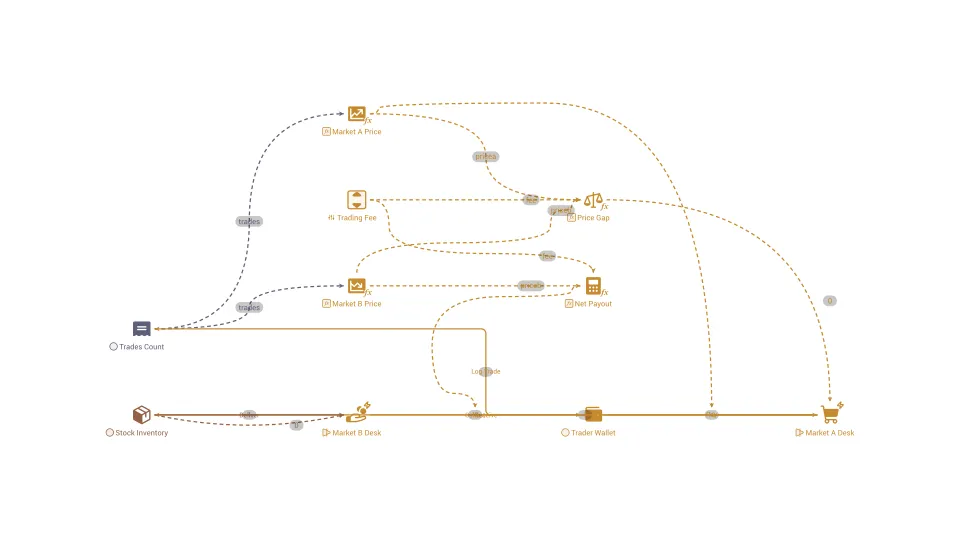
Buying something in one market and selling it in another at the same time to lock in the price difference as a risk-free profit.
Auction
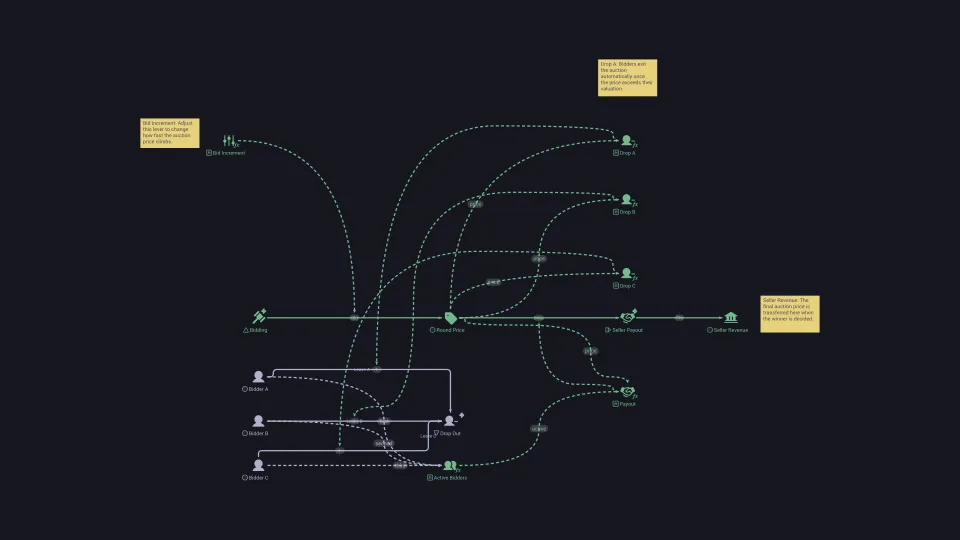
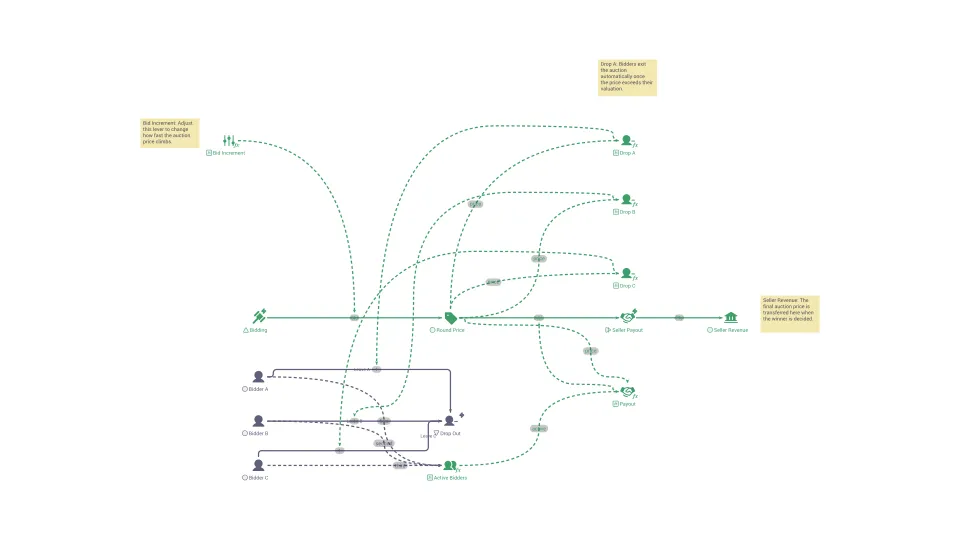
A way of setting a price by letting buyers compete with bids, with the item going to the winner at a price set by the rules.
Auxiliary variable
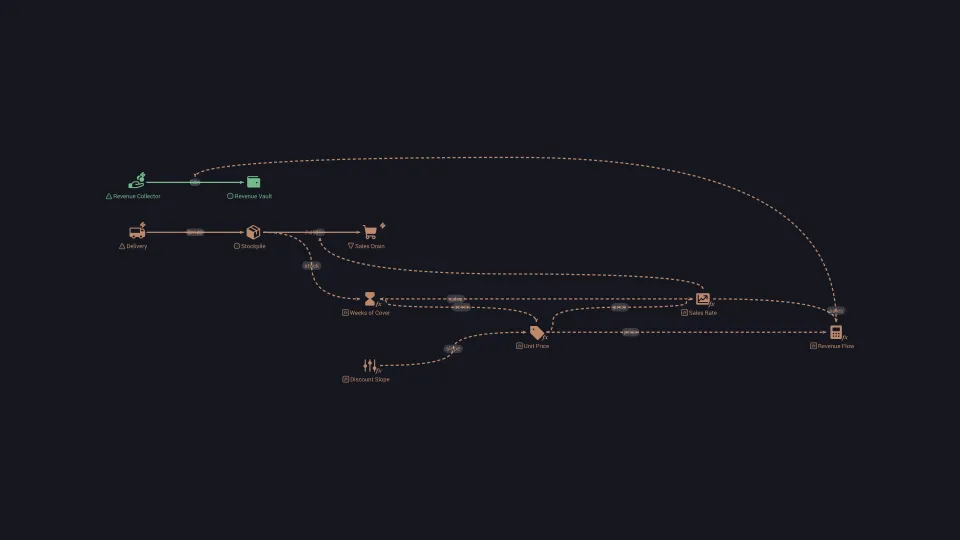
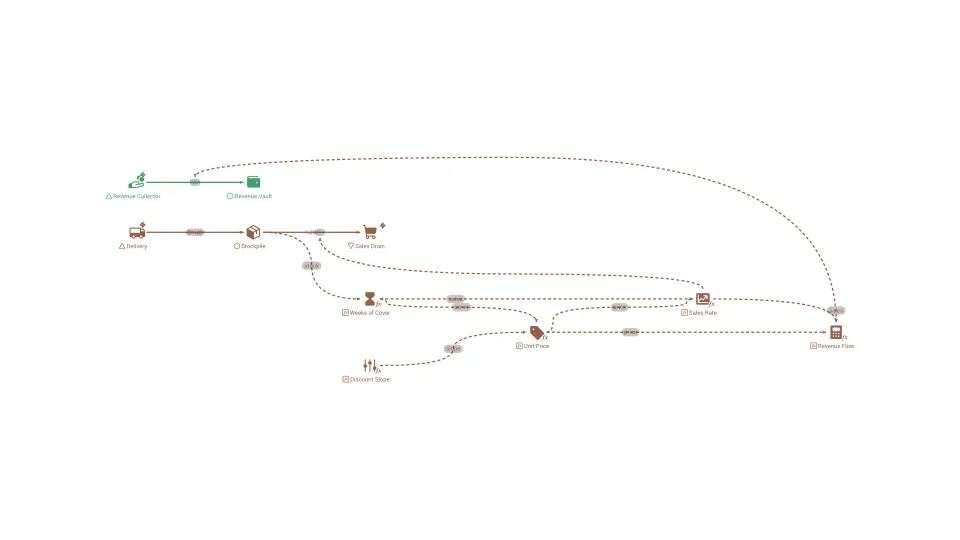
A quantity in a simulation that is calculated from other quantities at each moment and does not accumulate over time.
Backlog
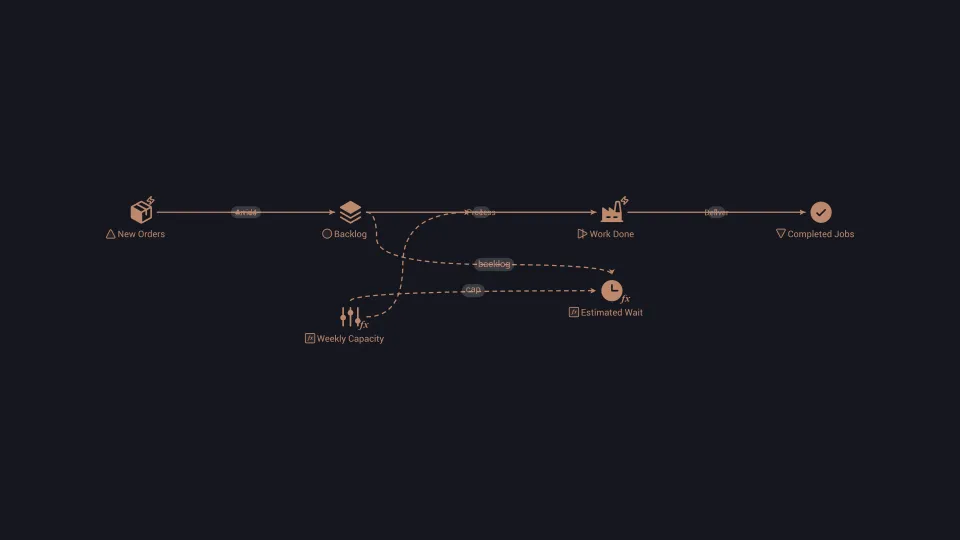
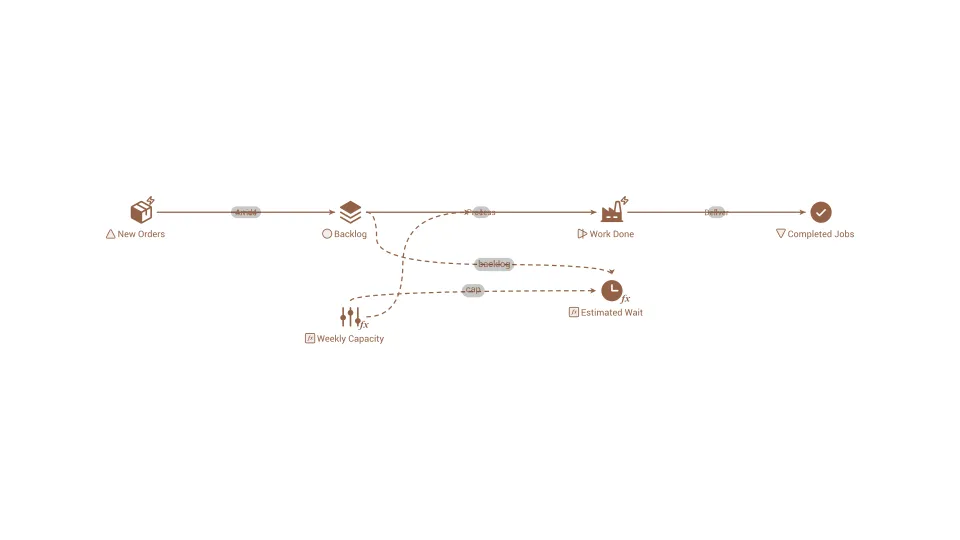
The queue of work or orders that have been accepted and are waiting to be completed, and whether it grows or shrinks.
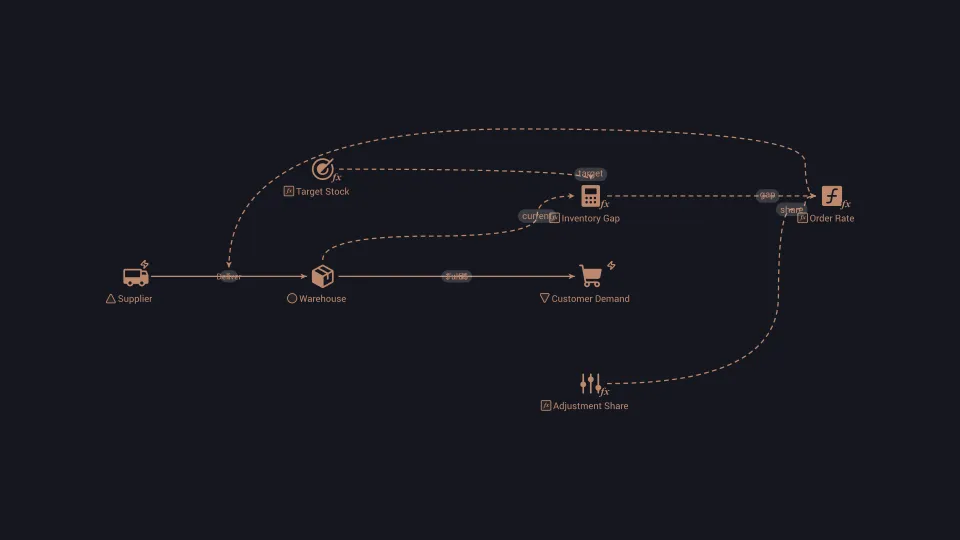
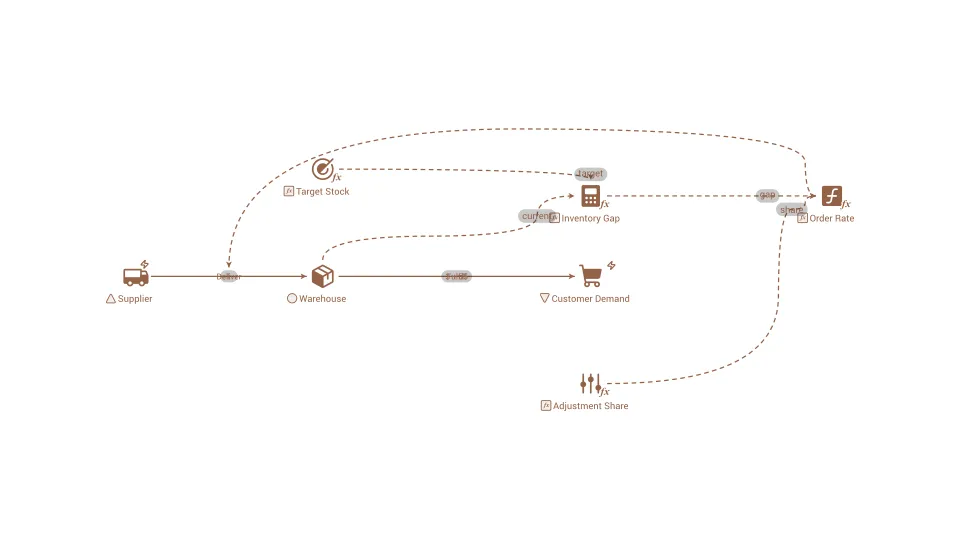
Balancing feedback loop
A circular chain of cause and effect that pushes a quantity back toward a target, so the system resists change and settles near a goal.
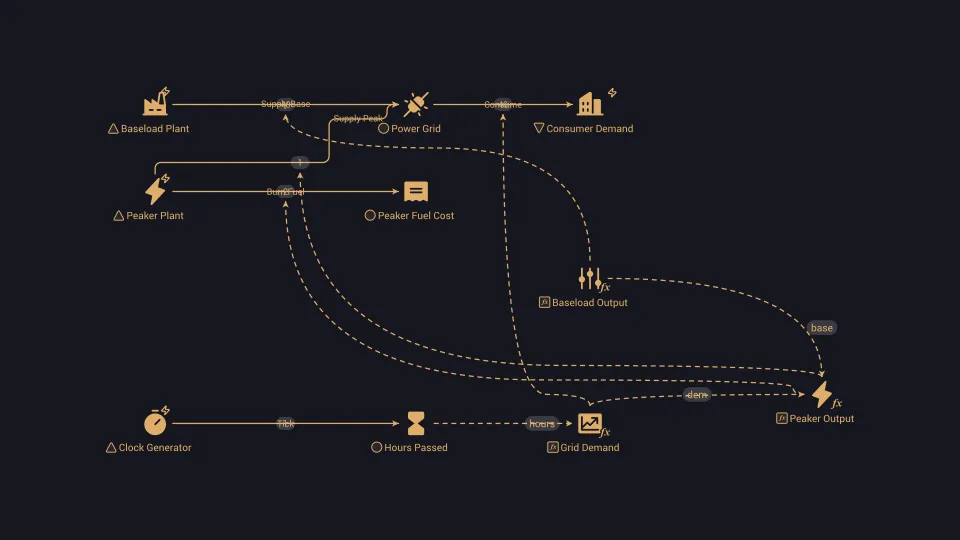
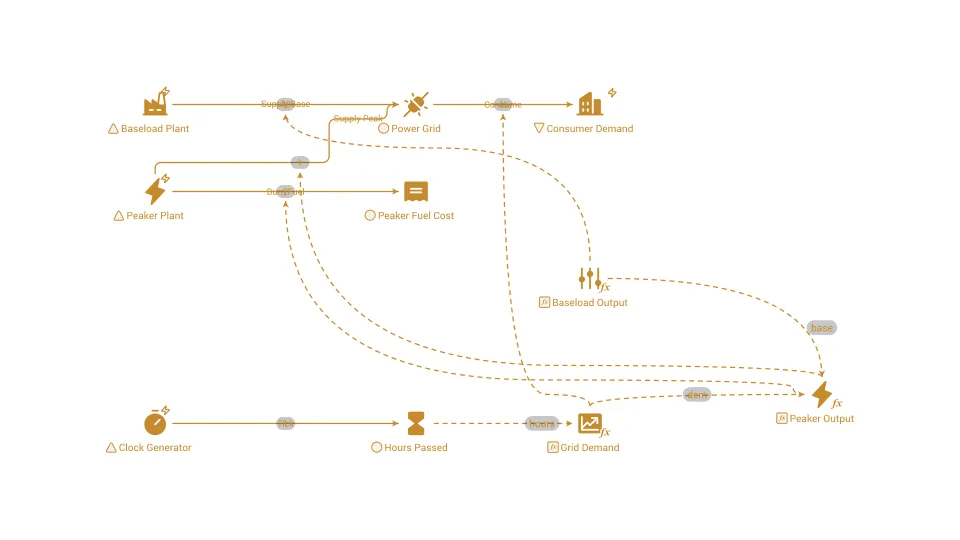
Baseload
The minimum level of electricity demand that is present all day, and the plants that run steadily to supply it.
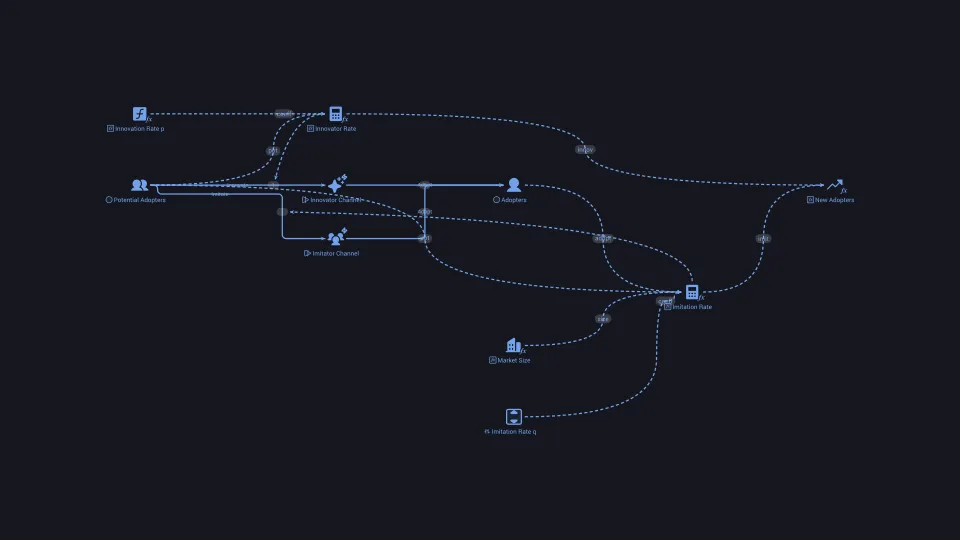
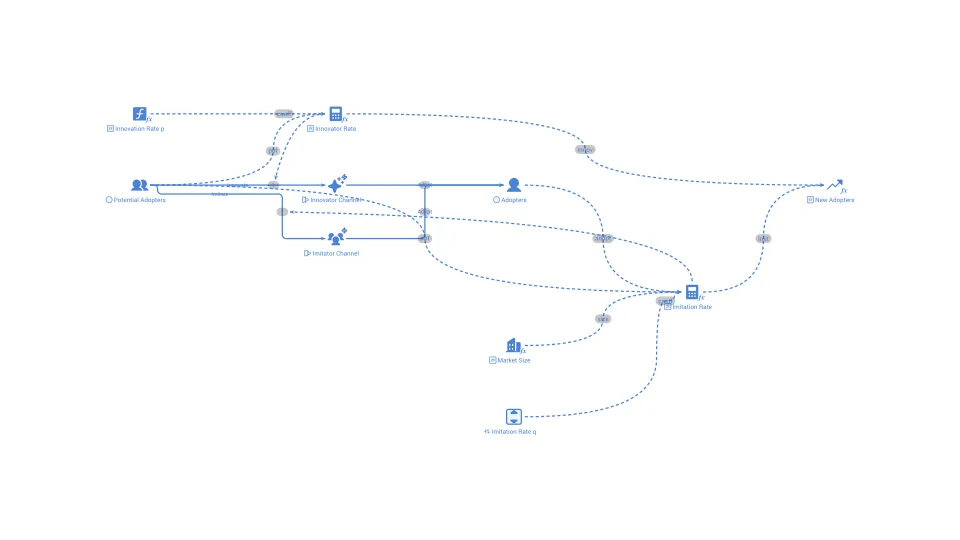
Bass diffusion model
A model of how a new product spreads through a market, in which people adopt either on their own or by copying others who already adopted.
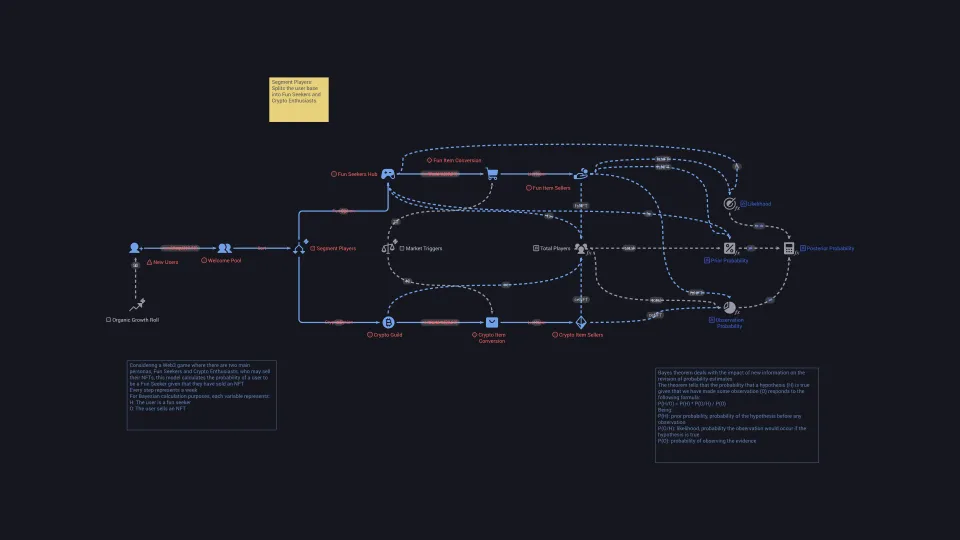
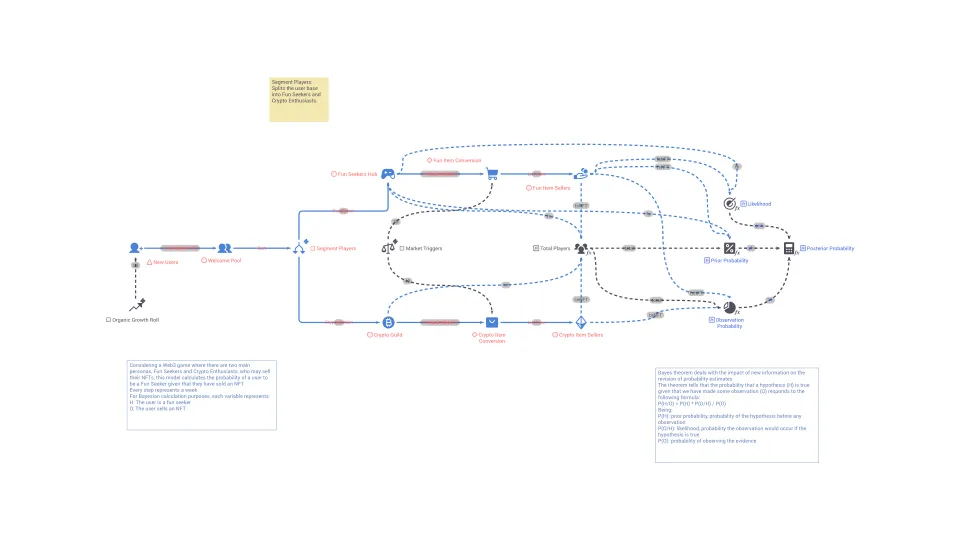
Bayes theorem
A rule for updating the probability of a hypothesis when new evidence arrives, combining prior belief with how likely the evidence is.
Bed occupancy
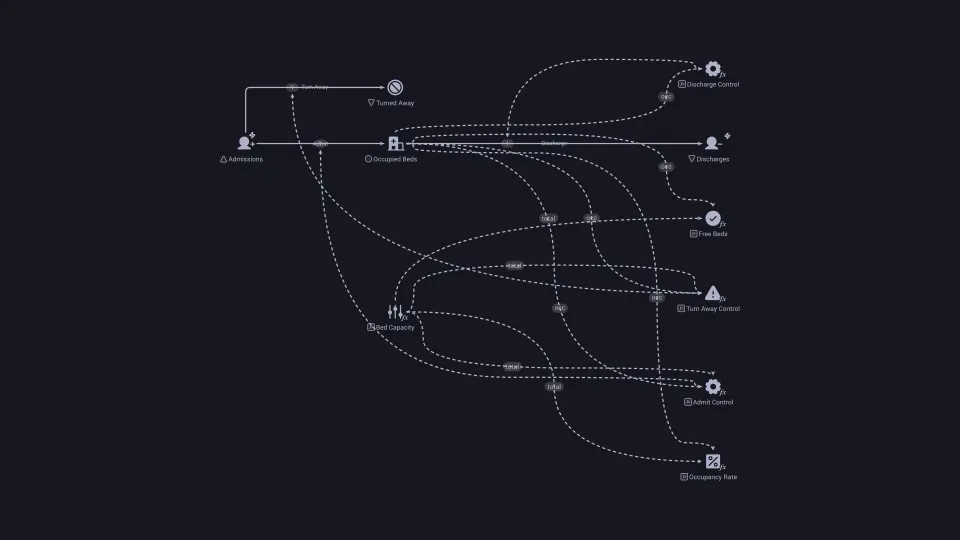
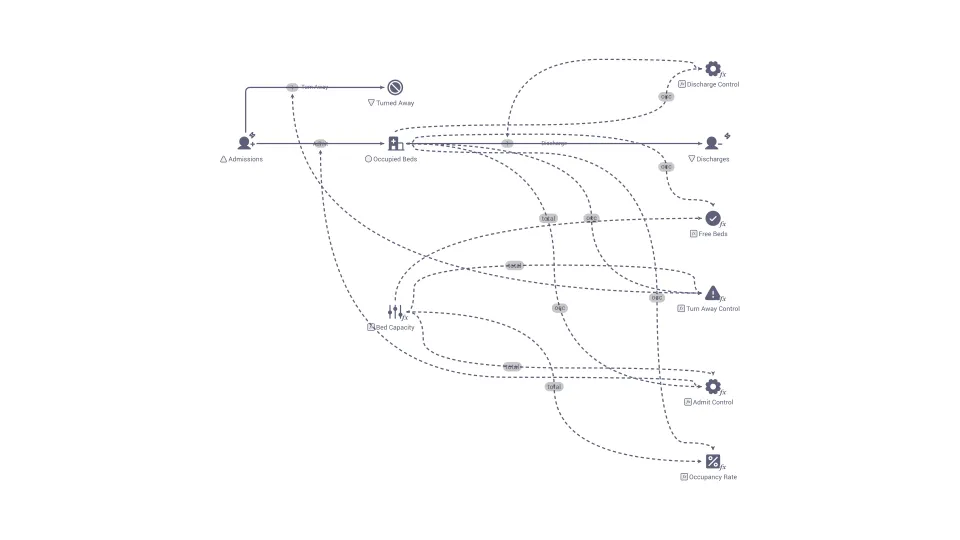
The share of a hospital's available beds that are in use at a given time, a basic measure of how stretched it is.
Behavior-over-time graph (BOT)
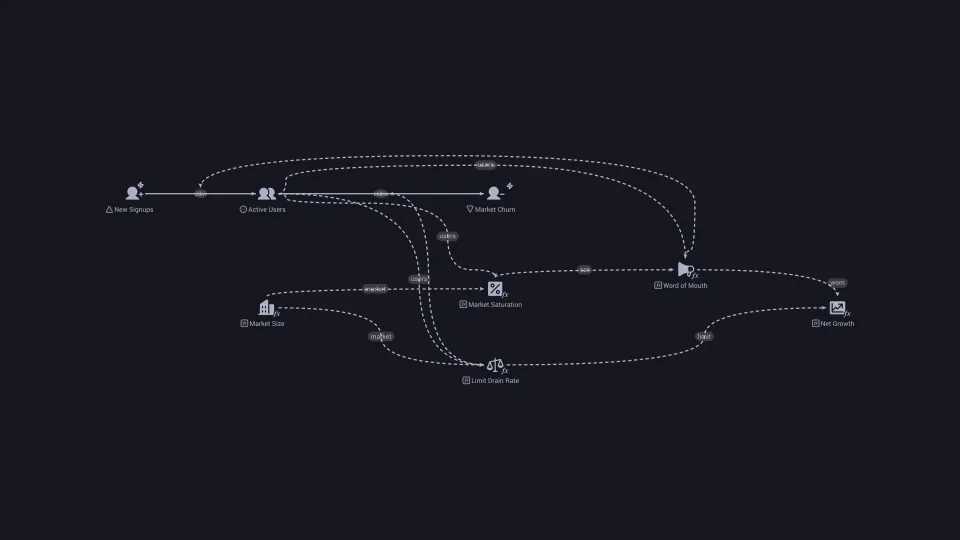
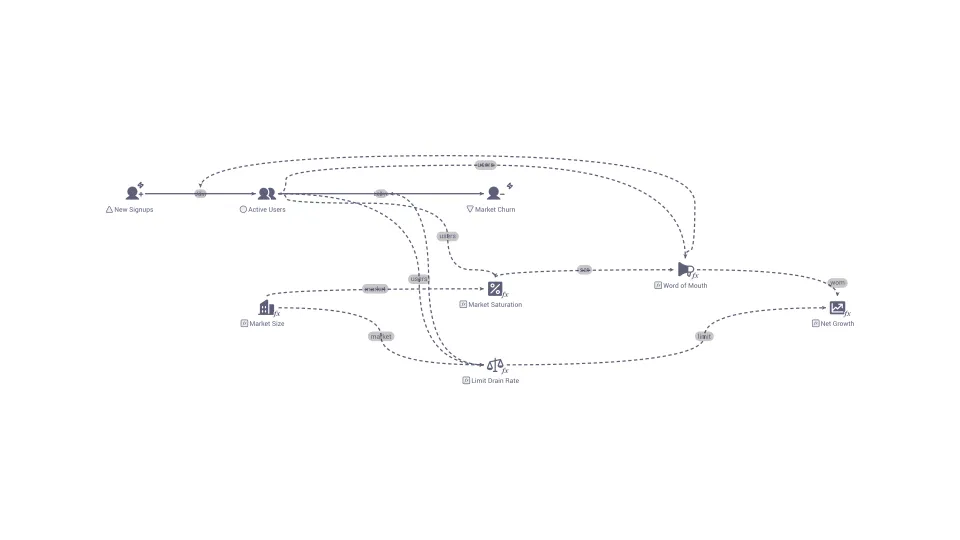
A simple graph that shows how one or more quantities change over time, used to describe a problem or to compare a model's output with reality.
Bonding curve
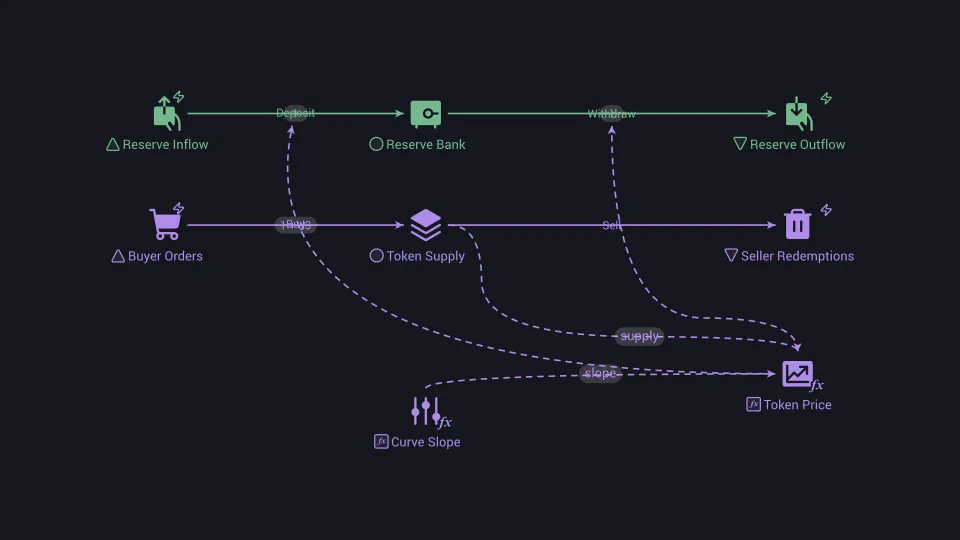
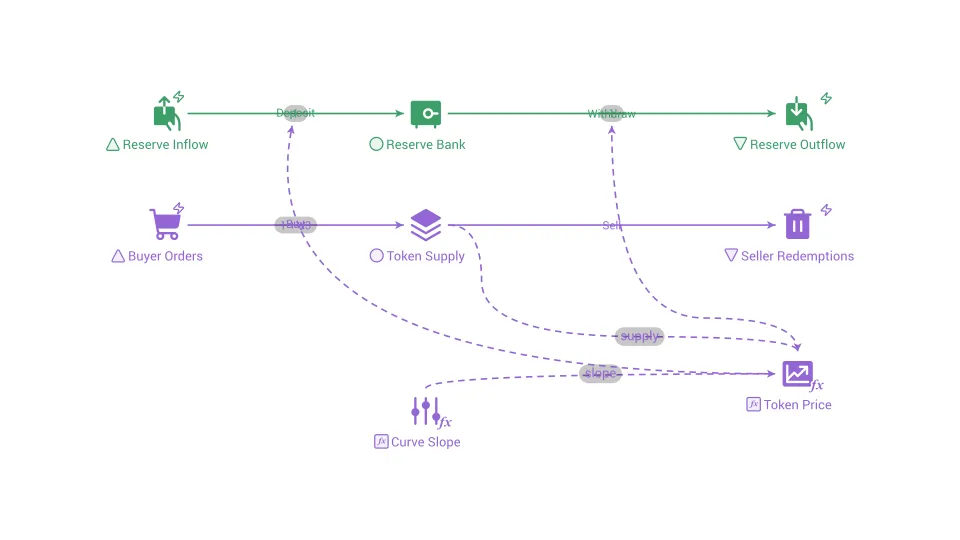
A formula that sets a token's price automatically as a function of its supply, rising as more tokens are bought.
Bottleneck
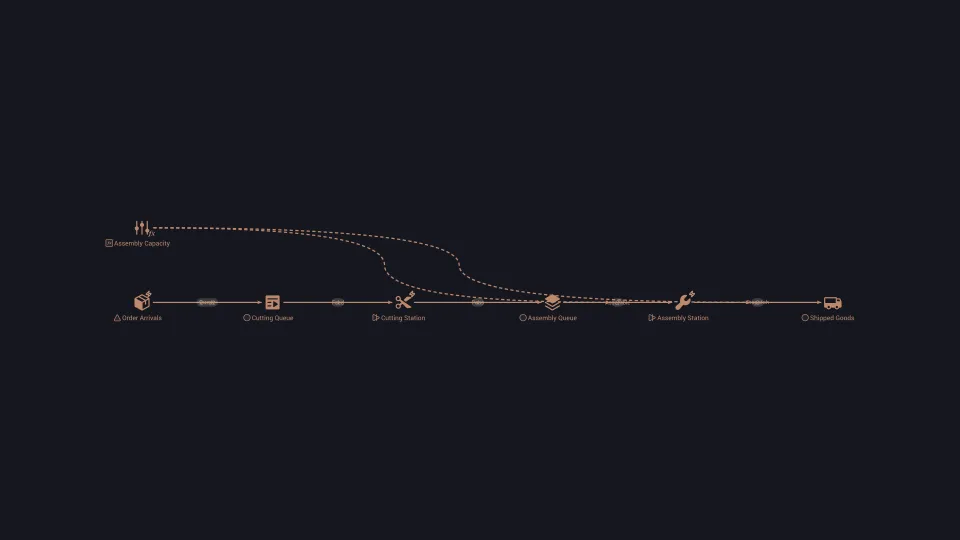
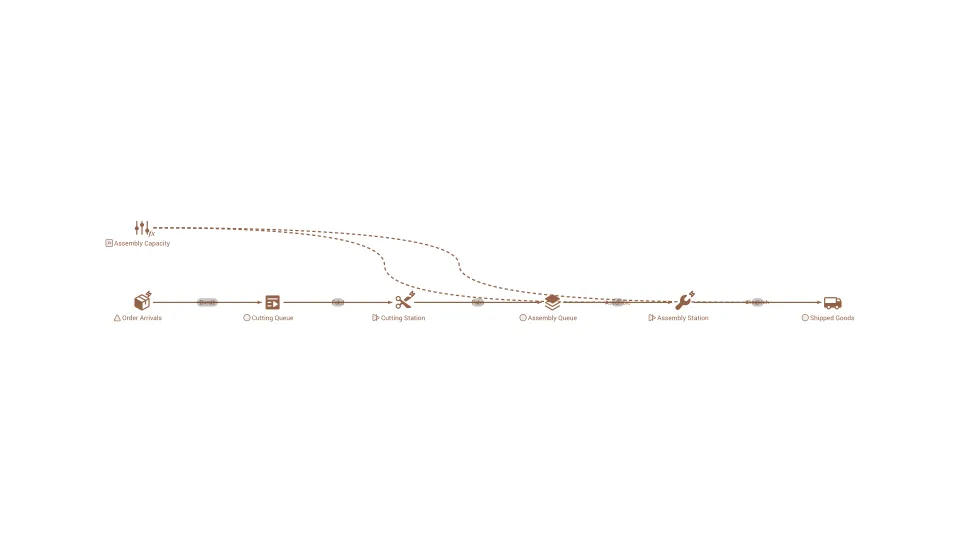
The single step in a process that limits the output of the whole system, because it has the least capacity.
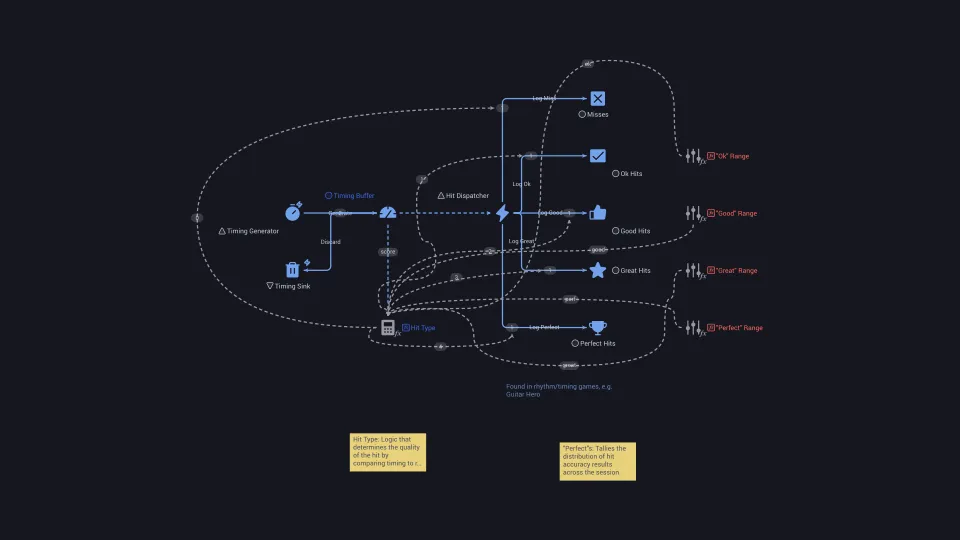
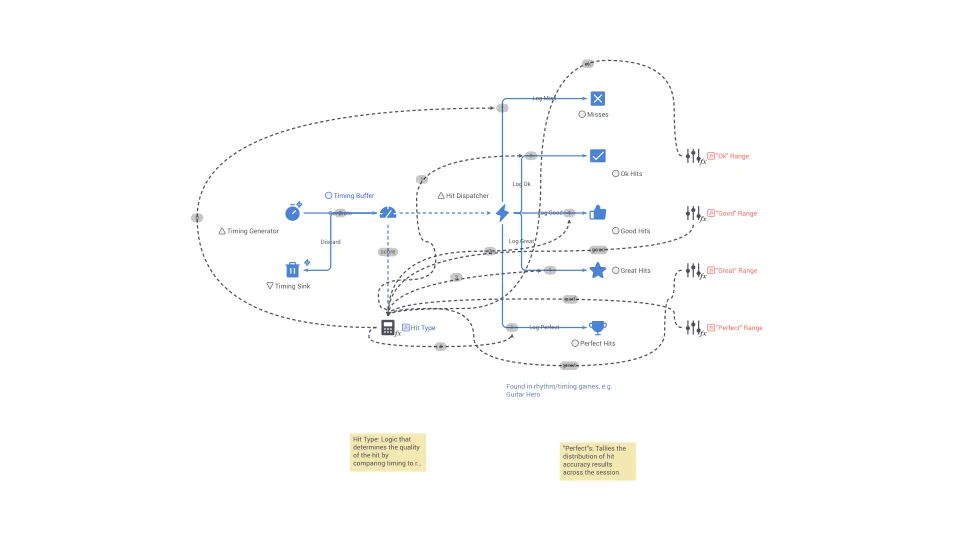
Buffer mechanic
The player has a fixed time window to perform an action. The more precisely they time the action, the better their score.
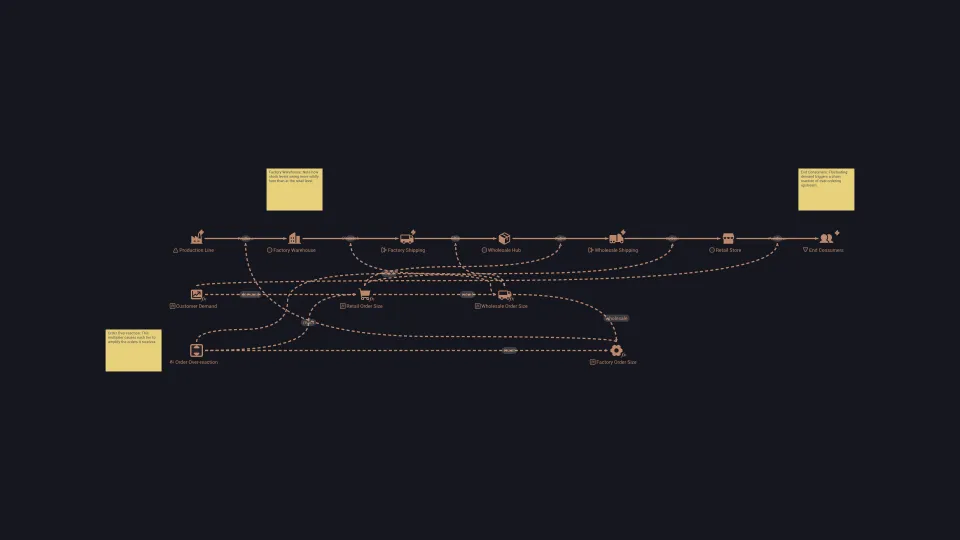
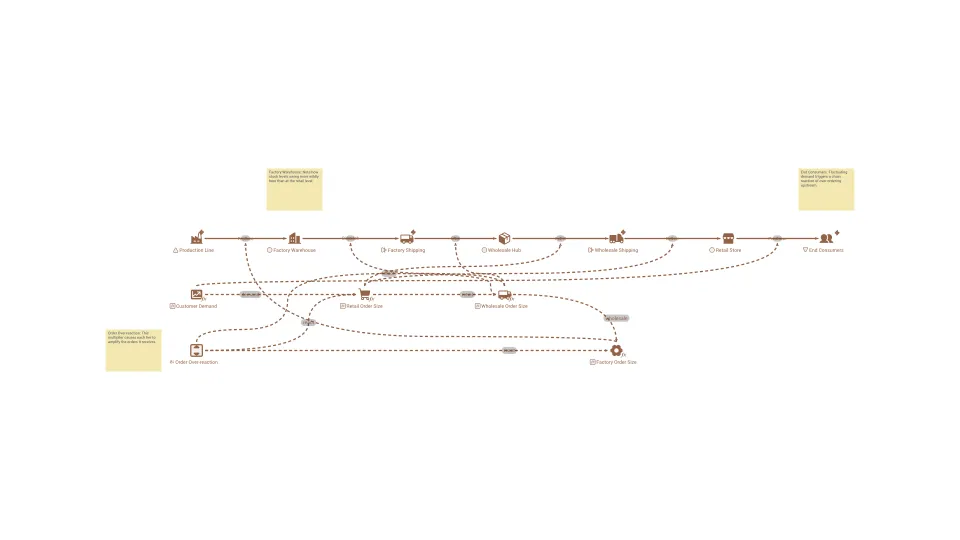
Bullwhip effect
The amplification of small changes in customer demand into larger and larger swings as orders move up a supply chain.
Burn rate
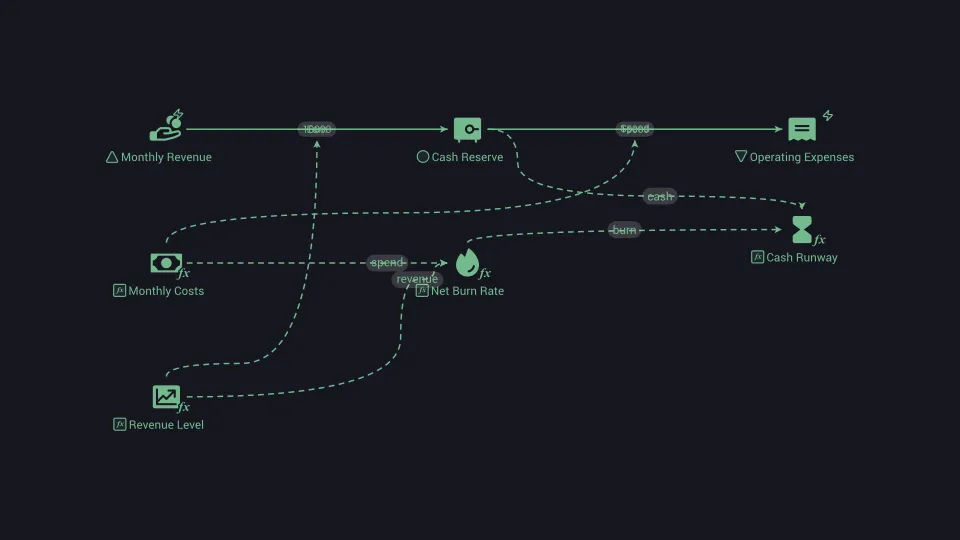
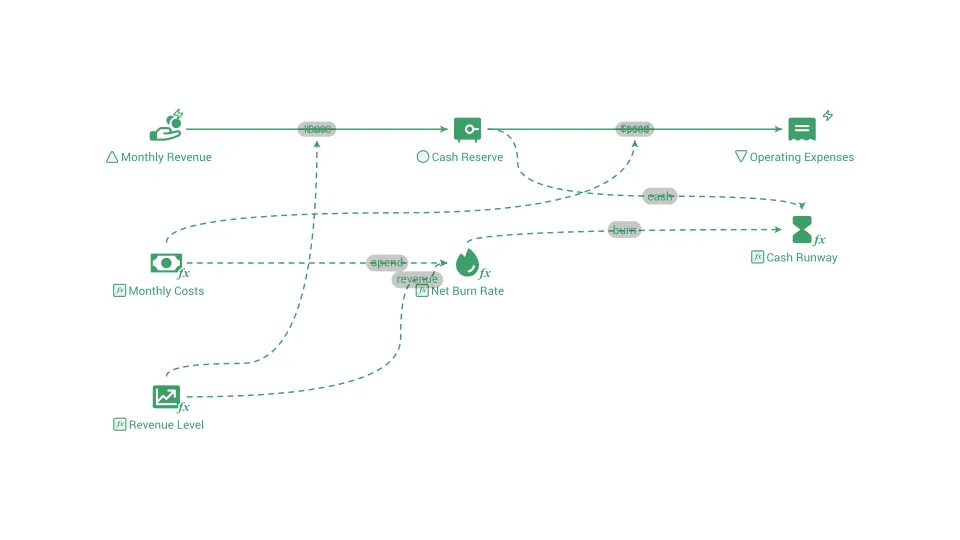
The speed at which a company spends its cash reserves, usually measured per month, typically before any revenue comes in.
Capacity factor
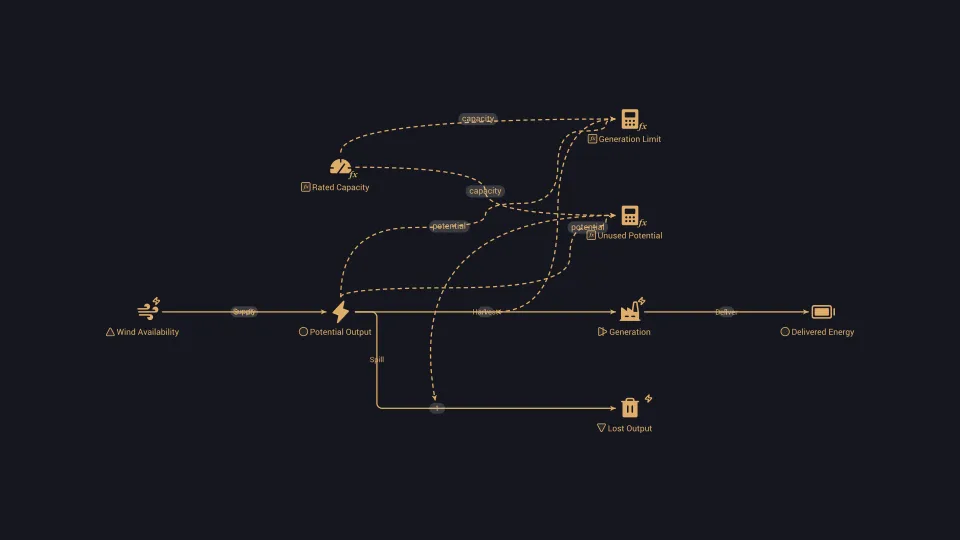
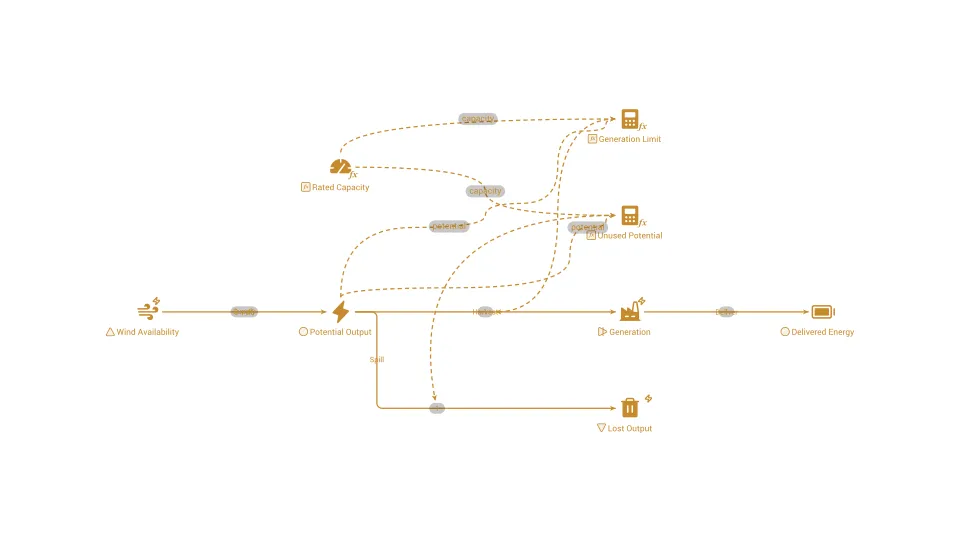
The share of a power plant's maximum possible output that it actually delivers over a period of time.
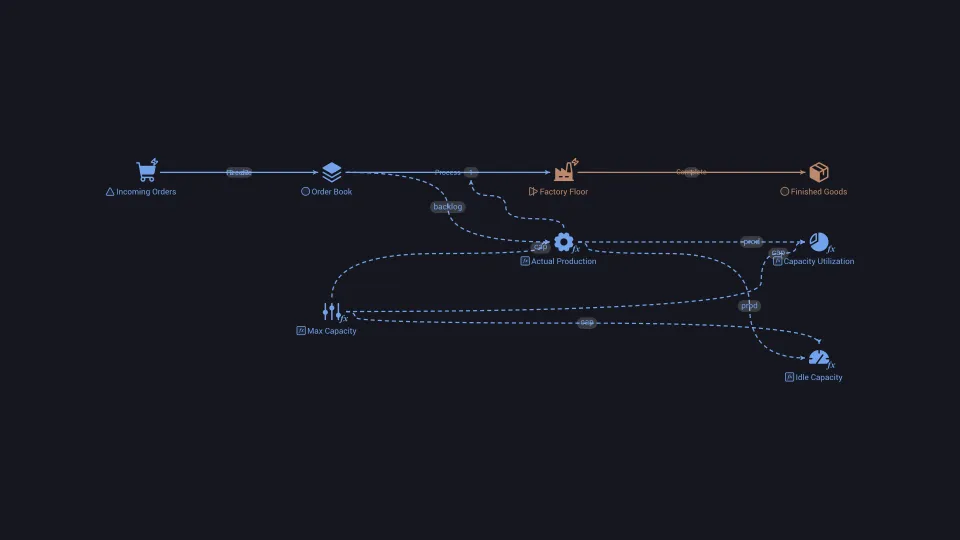
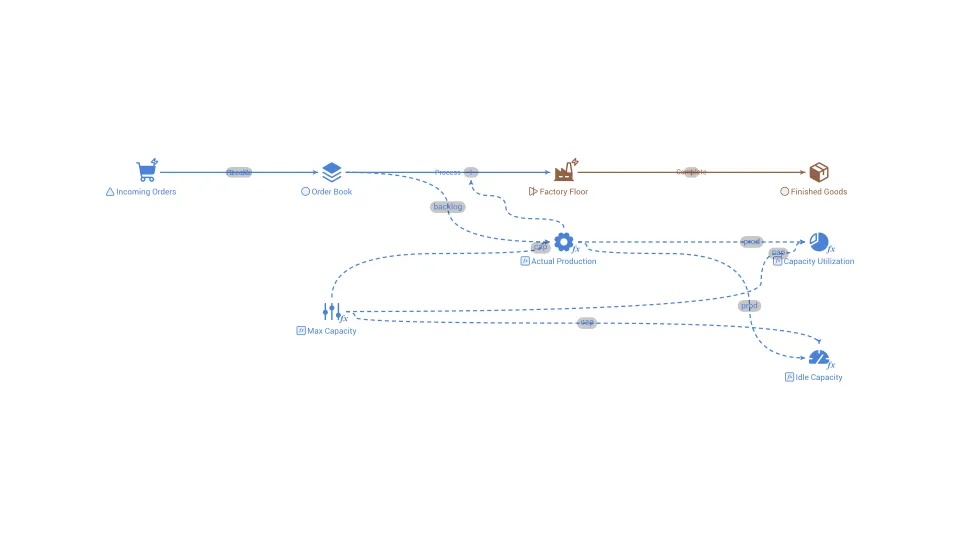
Capacity utilization
The share of the maximum possible output that a process, machine or facility actually produces.
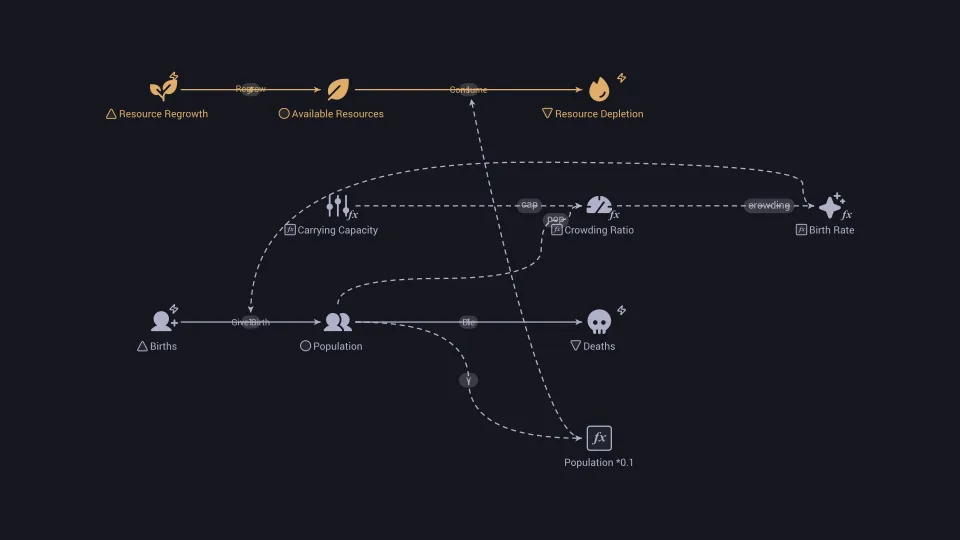
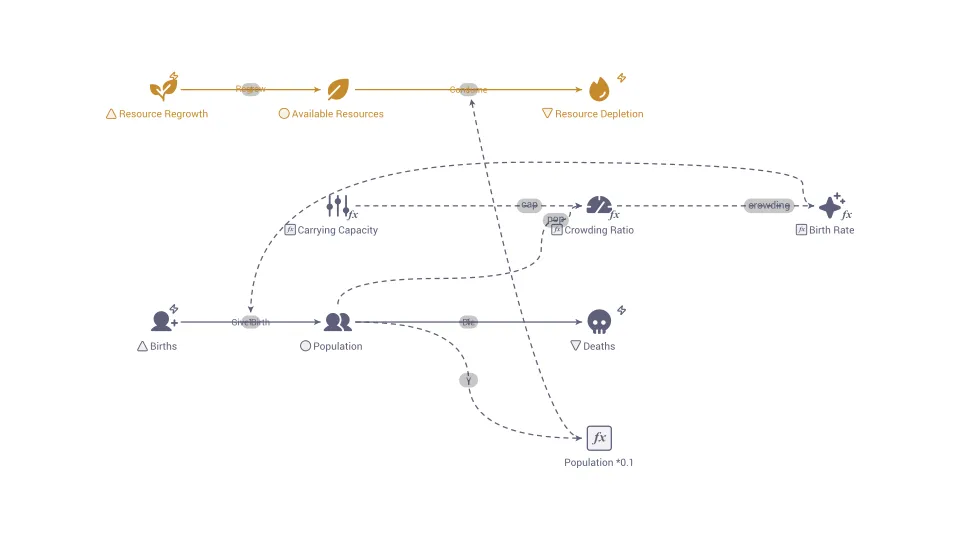
Carrying capacity
The largest population or load a given environment can support indefinitely with the resources available to it.
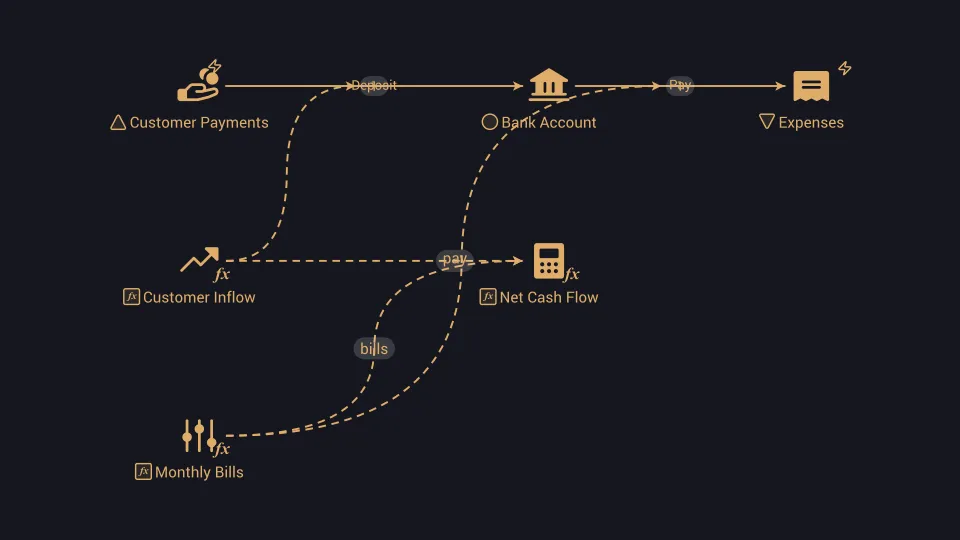
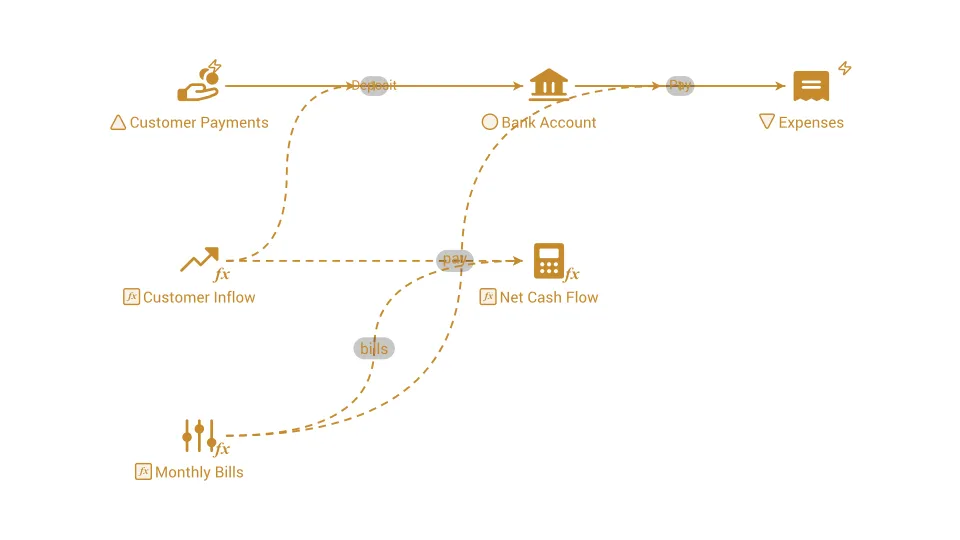
Cash flow
The money moving into and out of a business or person over a period, and the net difference between the two.
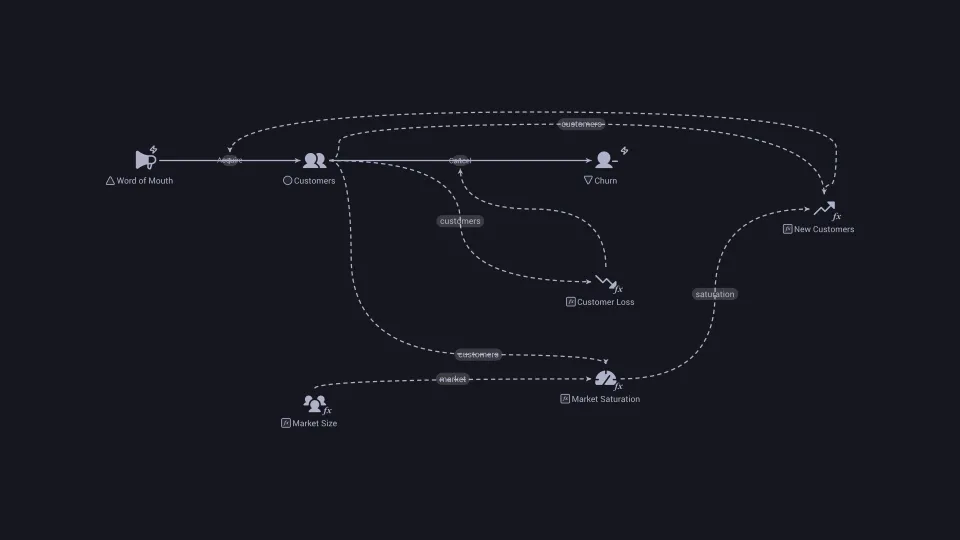
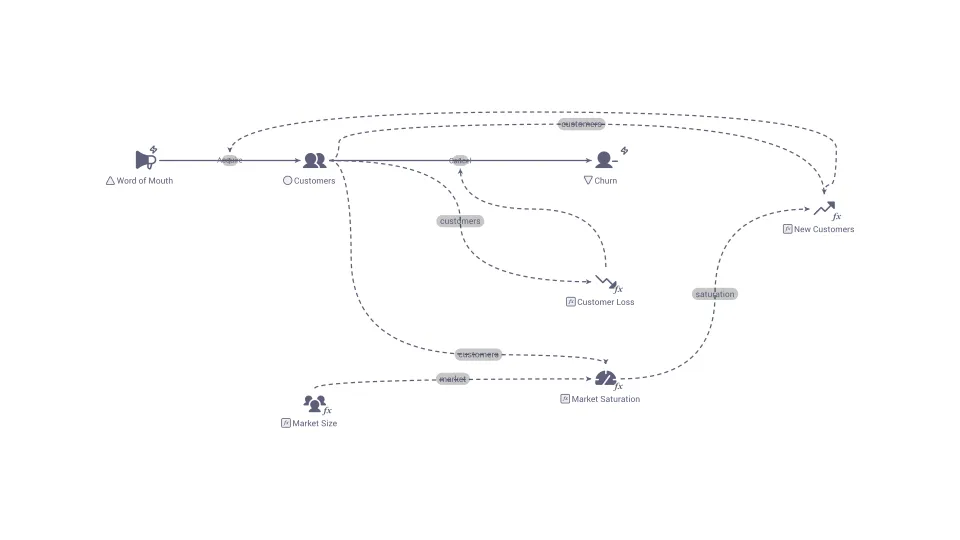
Causal loop diagram (CLD)
A causal loop diagram (CLD) is a sketch of the variables in a system joined by arrows that show which pushes which up or down, used to reveal feedback loops.
Churn rate
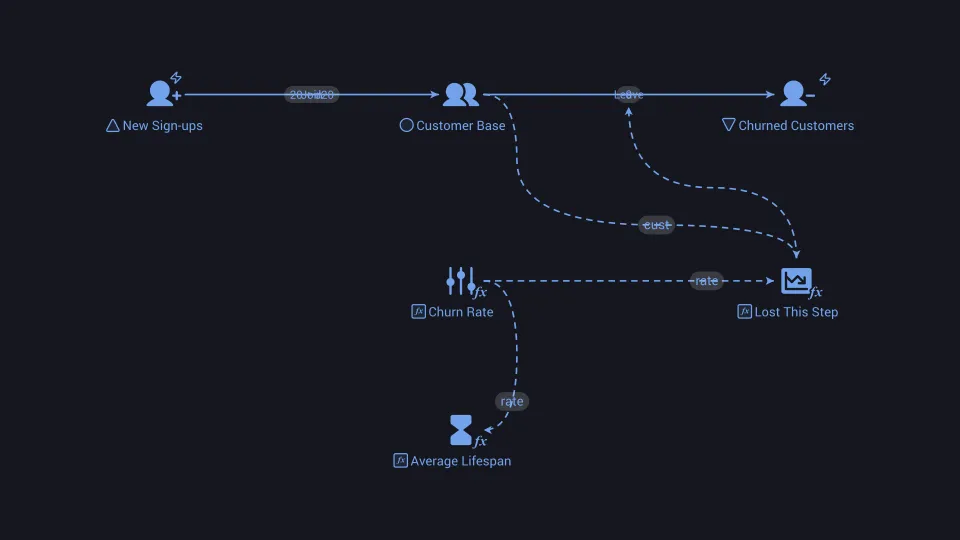
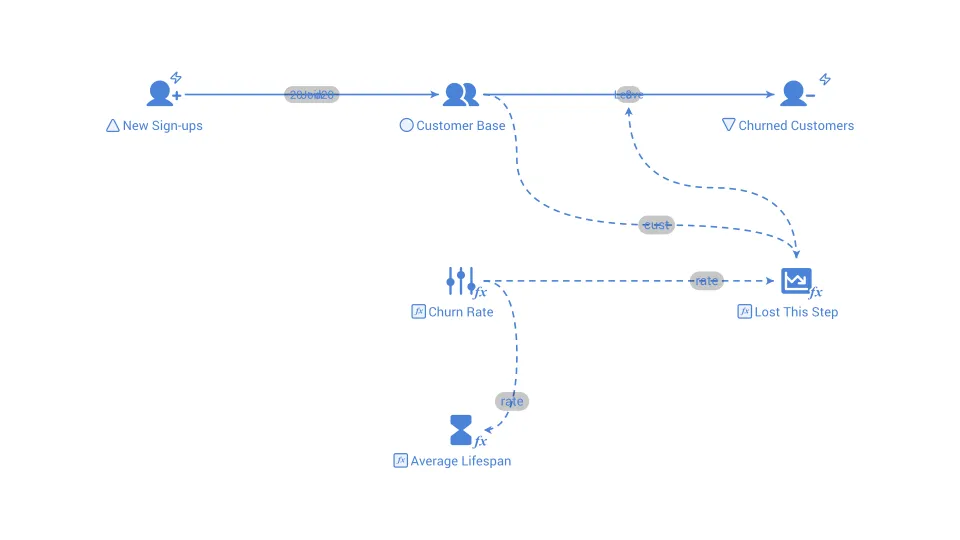
The share of customers who stop using or paying for a product in a given period, usually measured monthly.
Co-flow
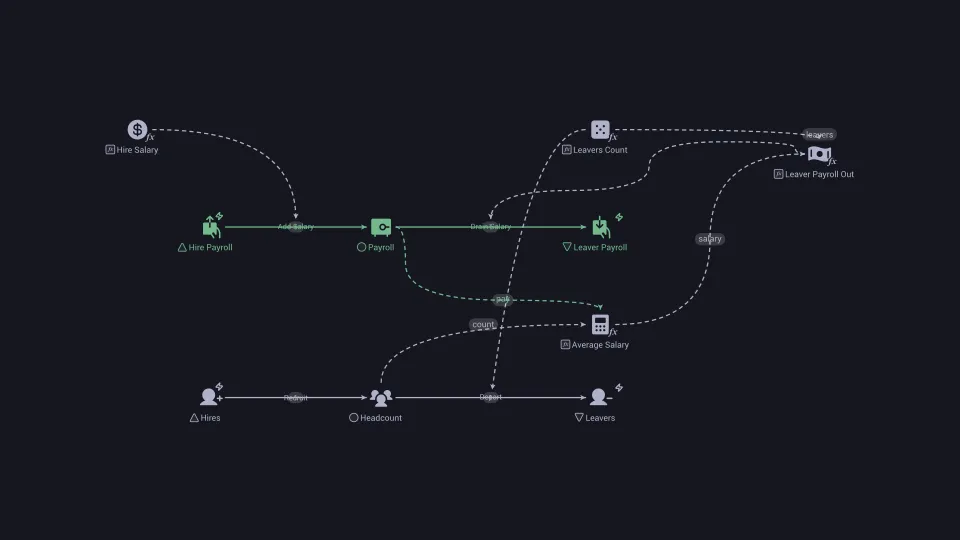
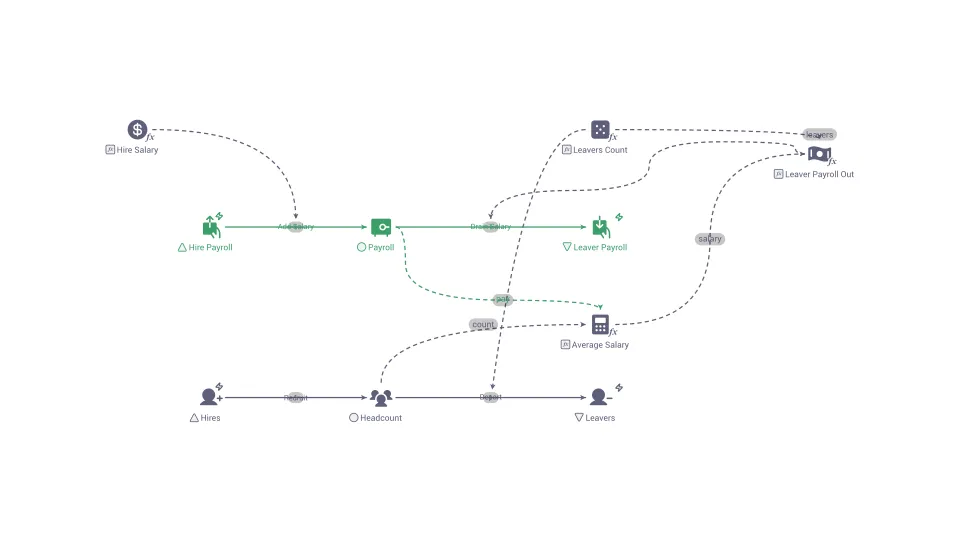
A second flow that travels alongside the main flow and carries an attribute, such as cost, age, or quality, so that its average can be tracked.
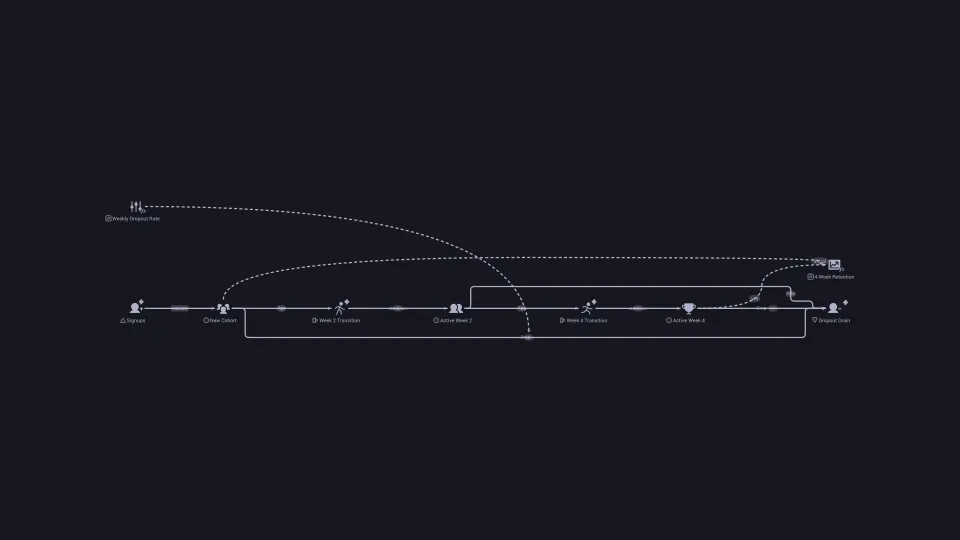
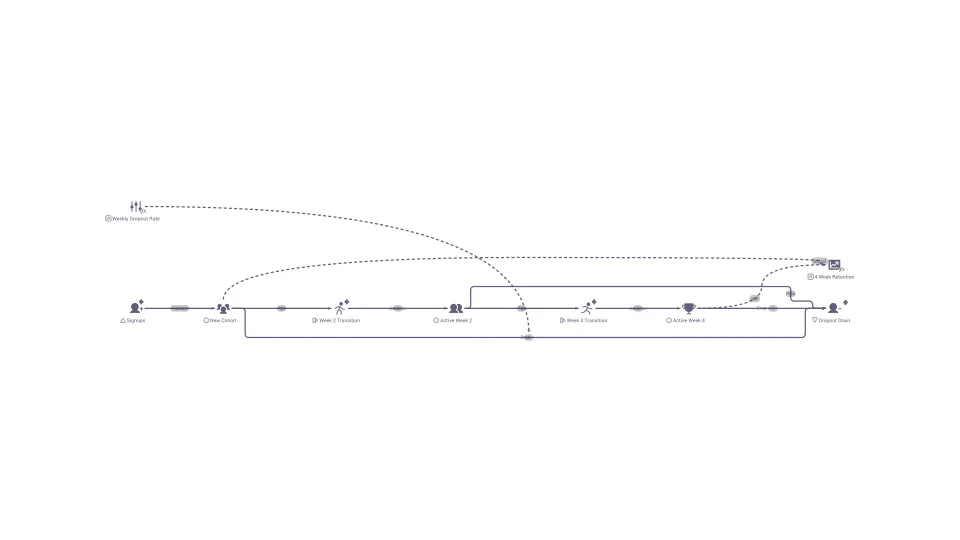
Cohort analysis
A way of tracking a group of people who started together, so changes in their behavior over time can be compared fairly.
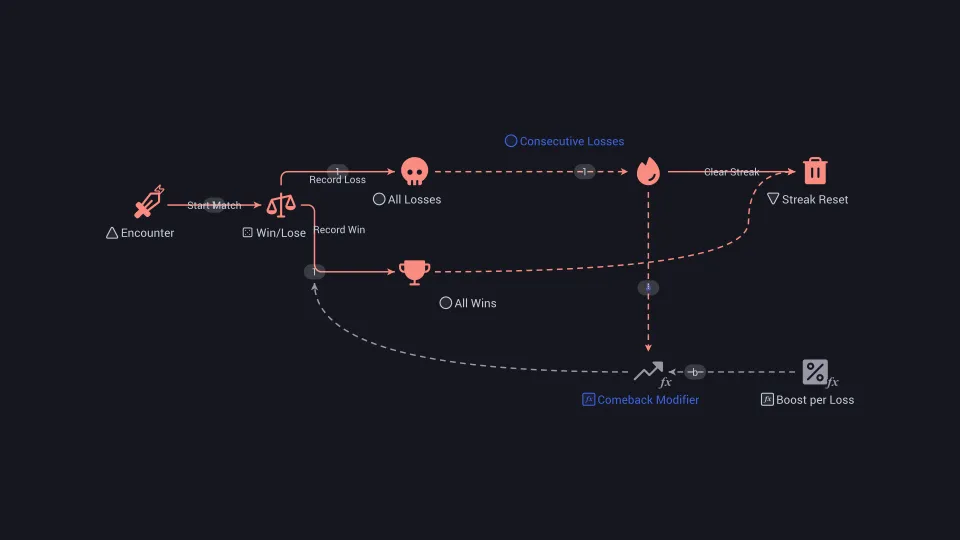
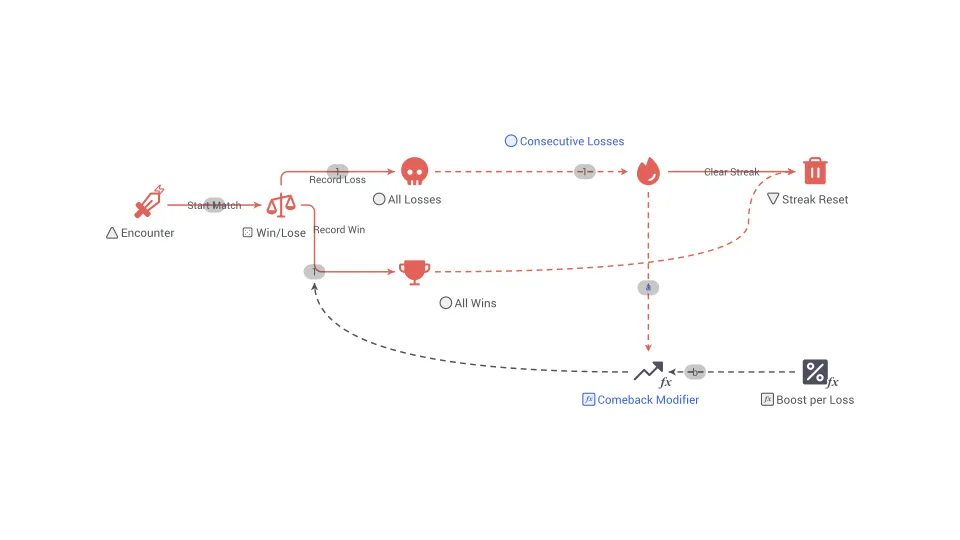
Comeback mechanic
A "comeback mechanic" provides a disadvantaged or losing player or team, the opportunity to recover, catch up, or even turn the tide of a match.
Comparative advantage
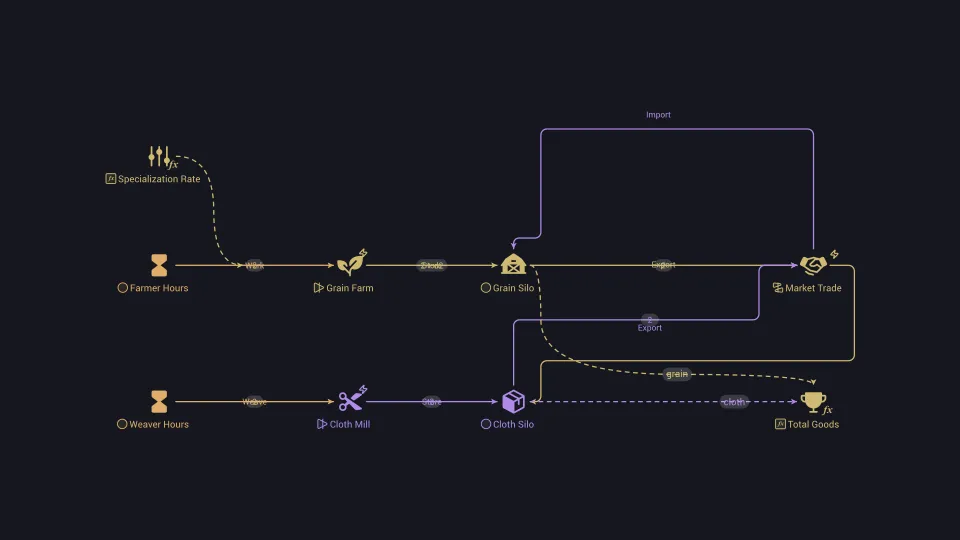
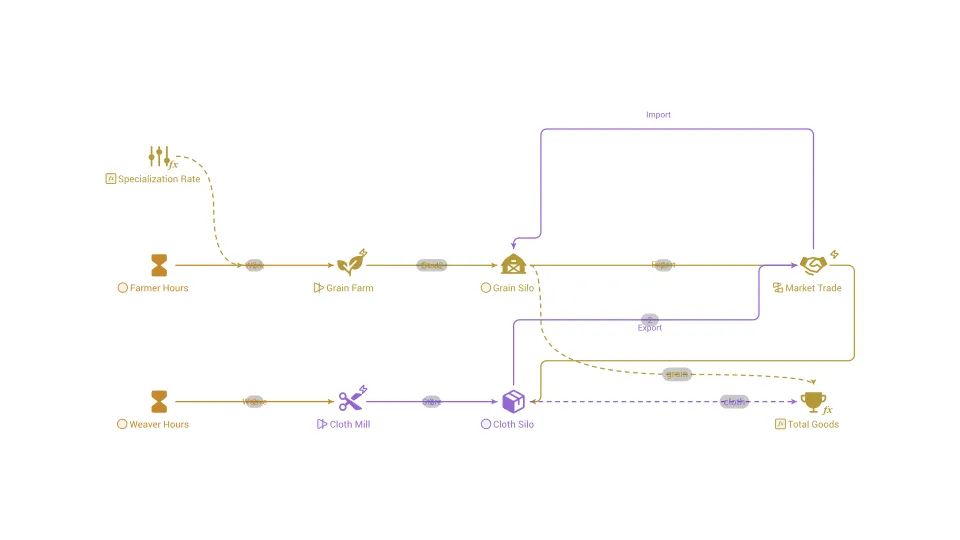
The idea that each party gains by focusing on what it gives up least to produce, even if another party is better at everything.
Compound interest
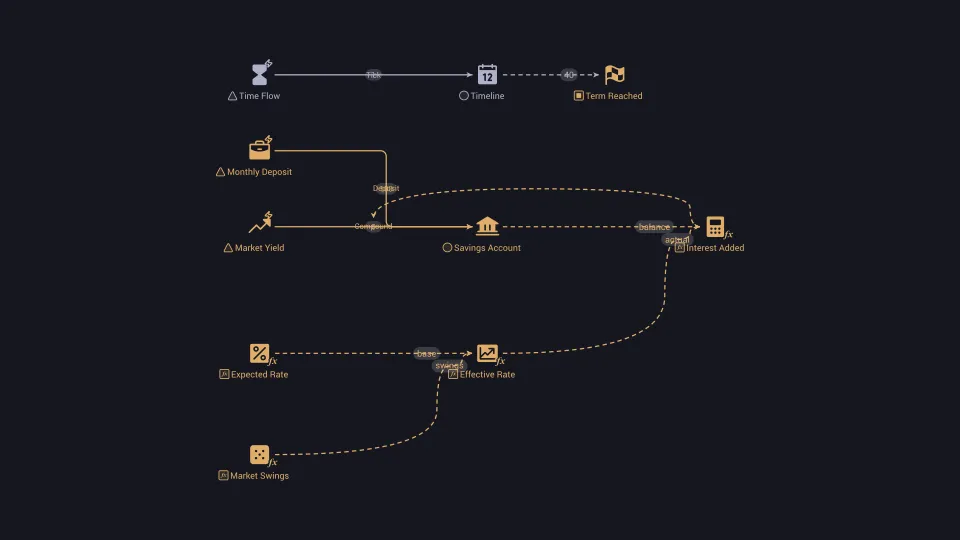
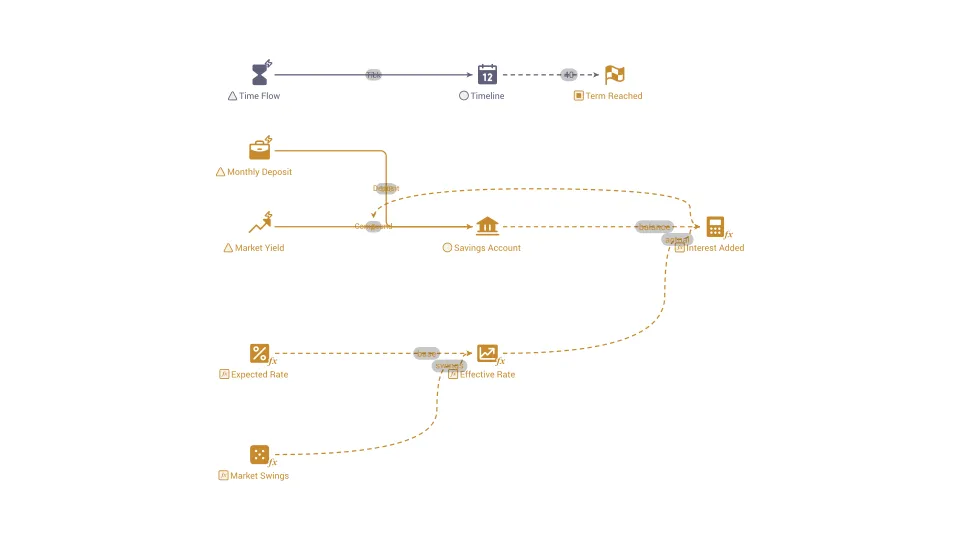
Interest earned on both the original amount and on the interest already added, so balances grow faster over time.
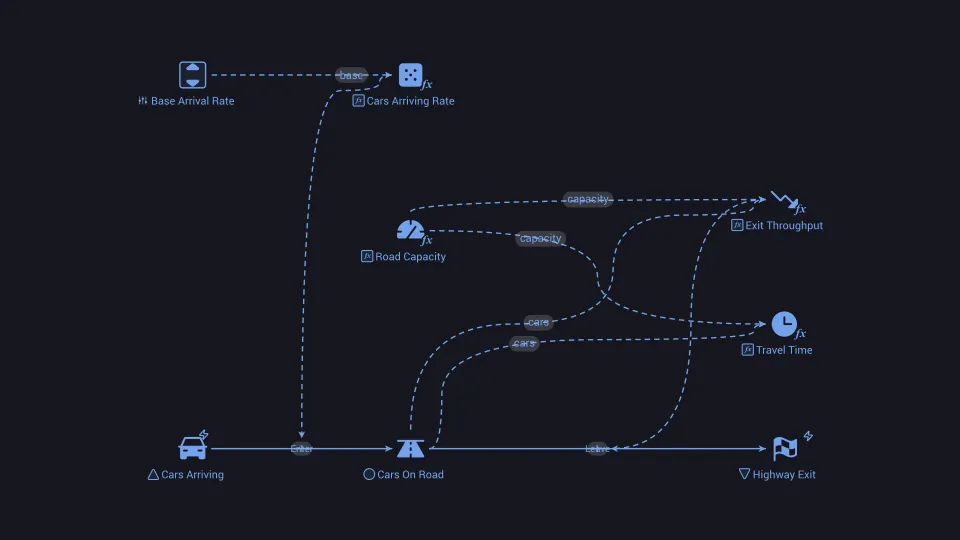
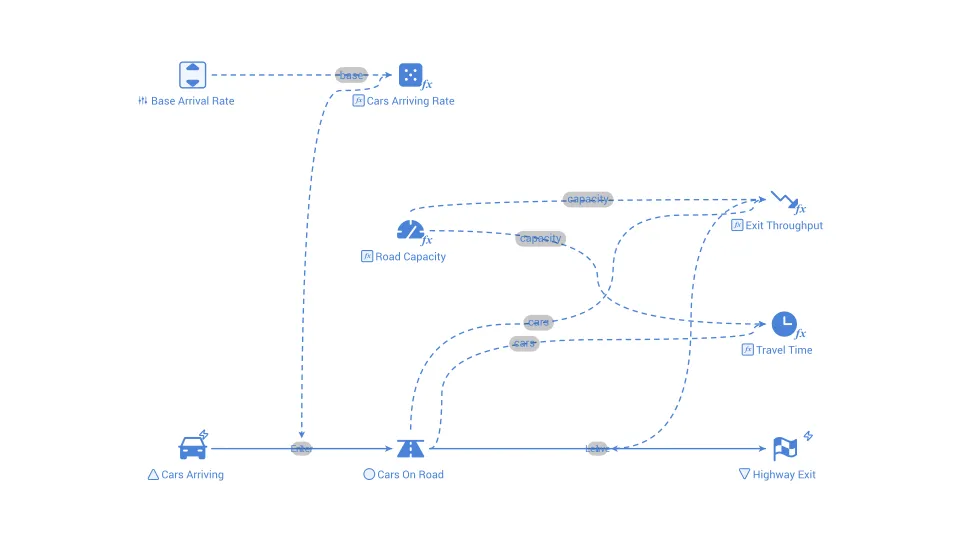
Congestion
The slowing and queuing that occur when demand for a shared resource, such as a road or network link, exceeds what it can handle.
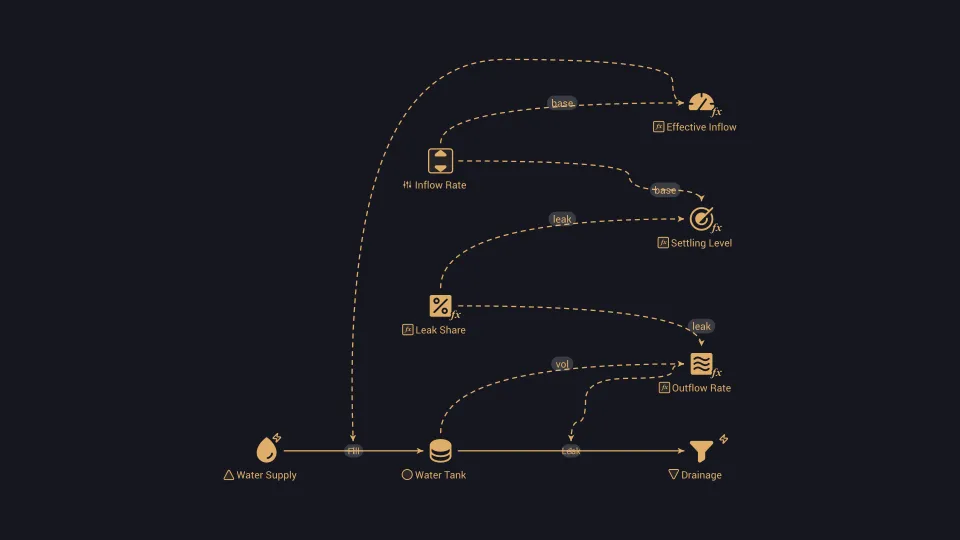
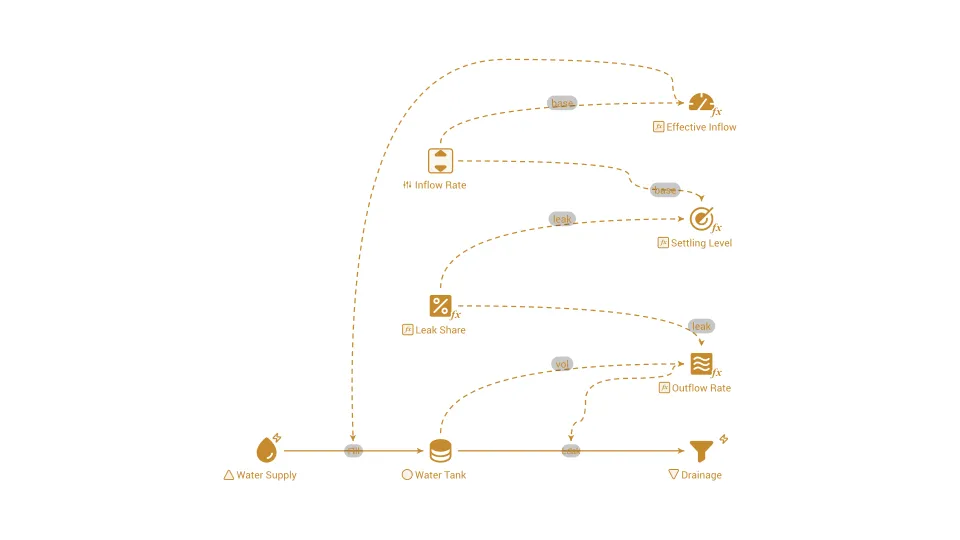
Continuous simulation
A way of simulating a system in which quantities change smoothly and continuously over time, calculated in many small steps.
Conversion funnel
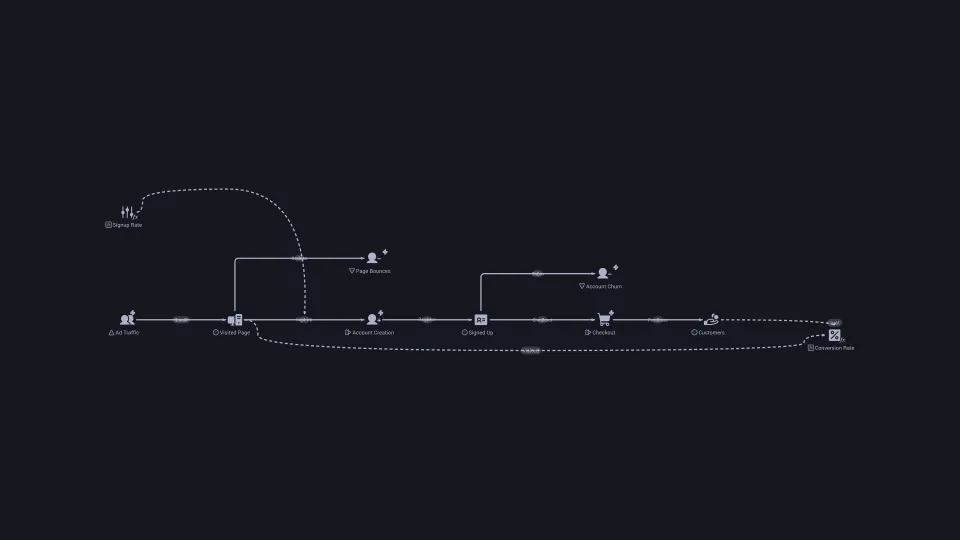
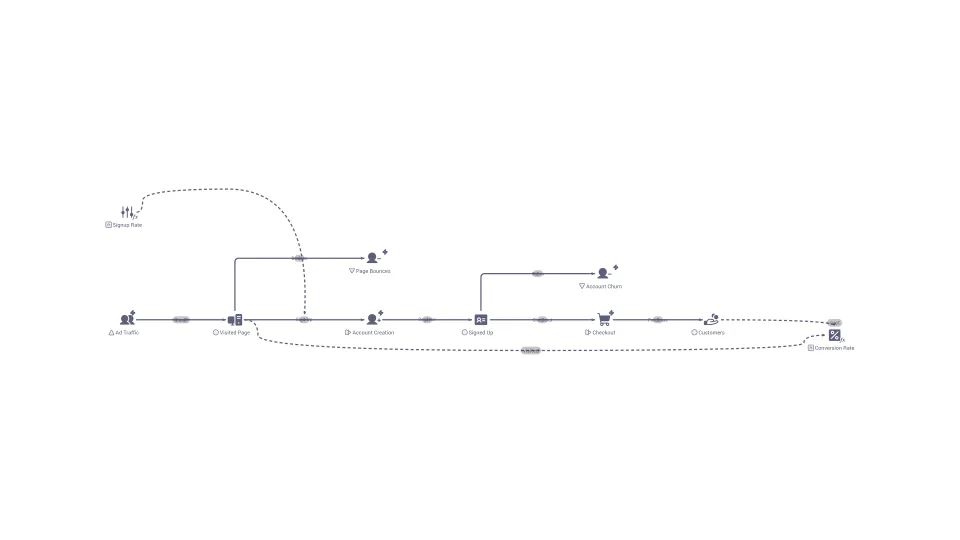
The ordered stages people pass through from first contact to a completed goal, with some share lost at every step.
Credit risk
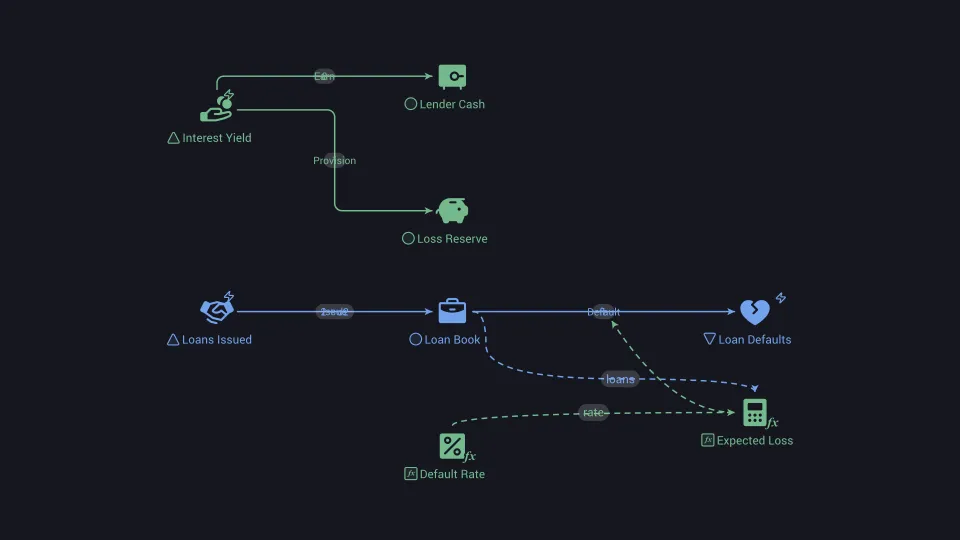
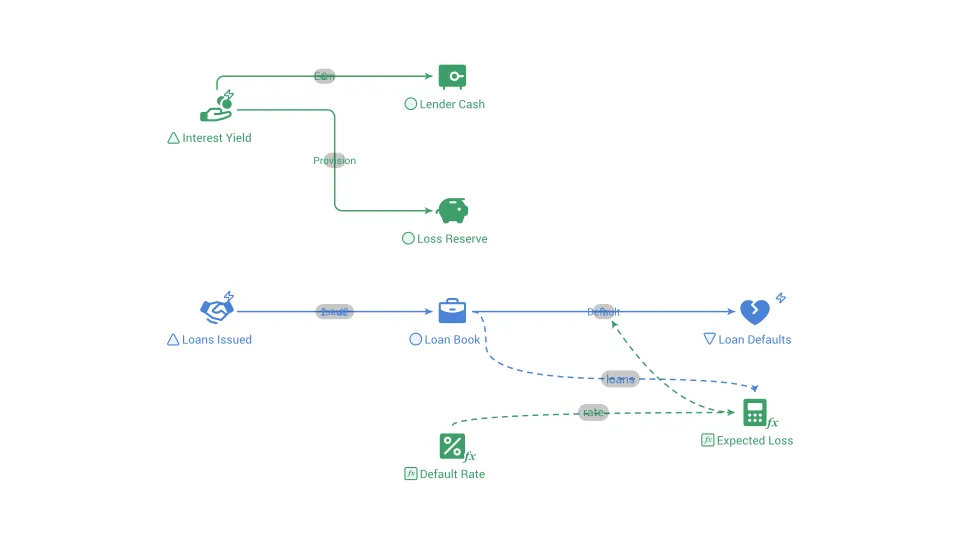
The chance that a borrower fails to repay a loan or meet a payment, and the loss the lender suffers as a result.
Cumulative cost
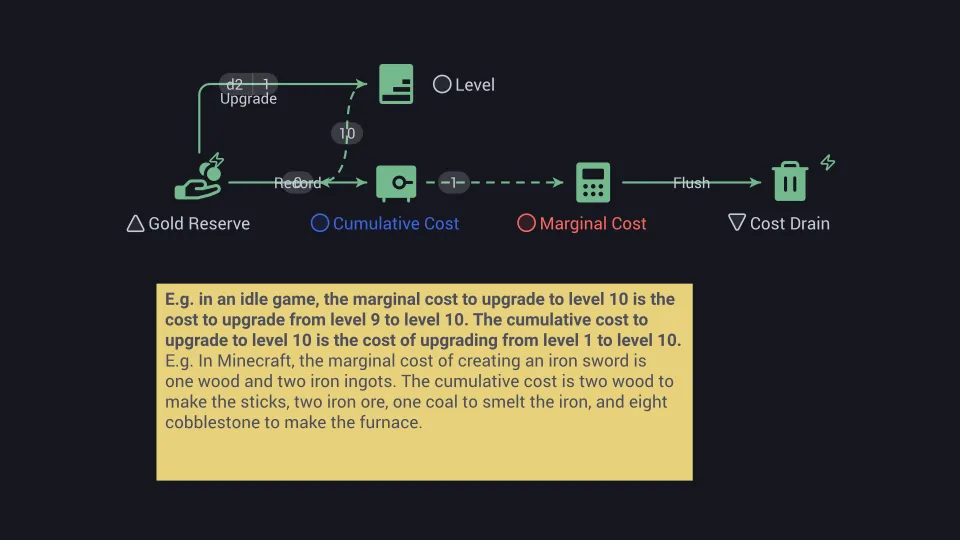
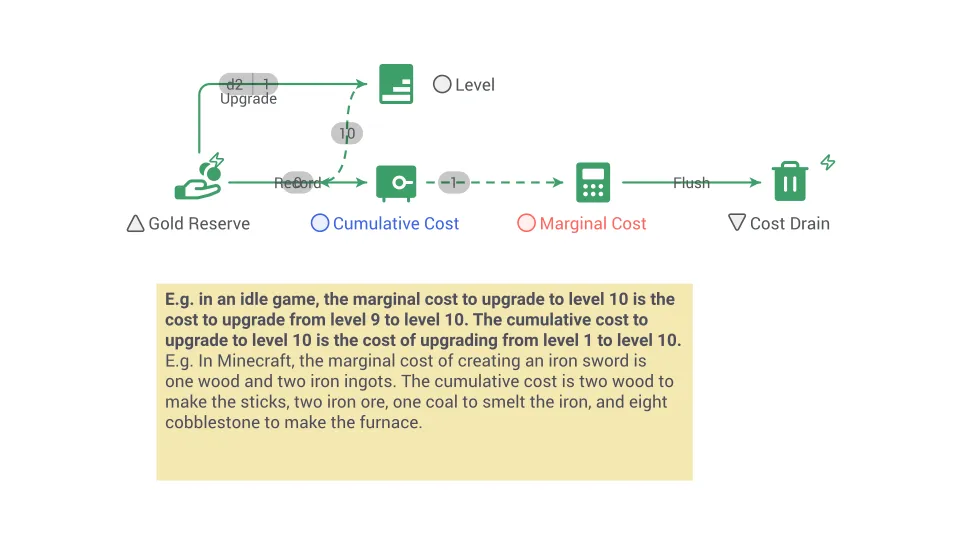
The running total of all costs that have been incurred from a starting point up to now, built up period by period.
Curtailment
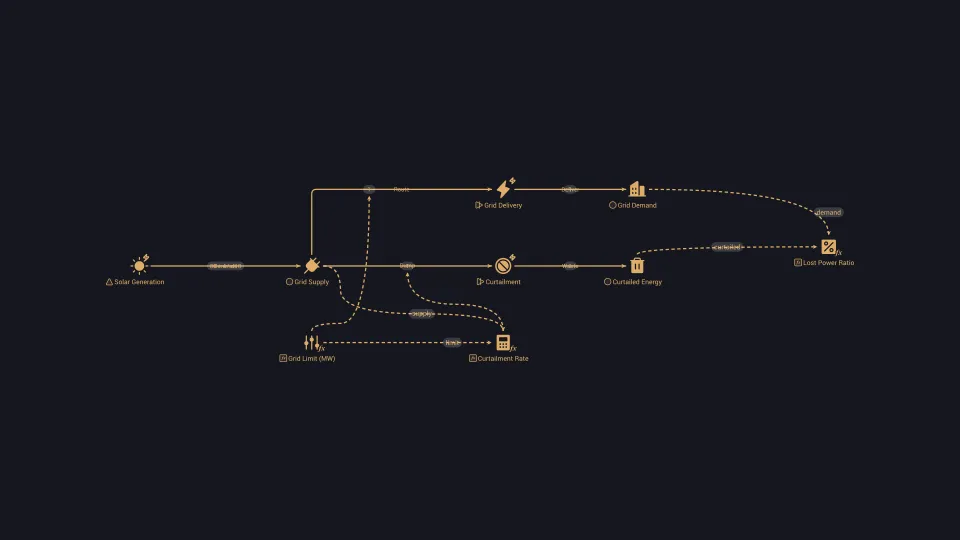
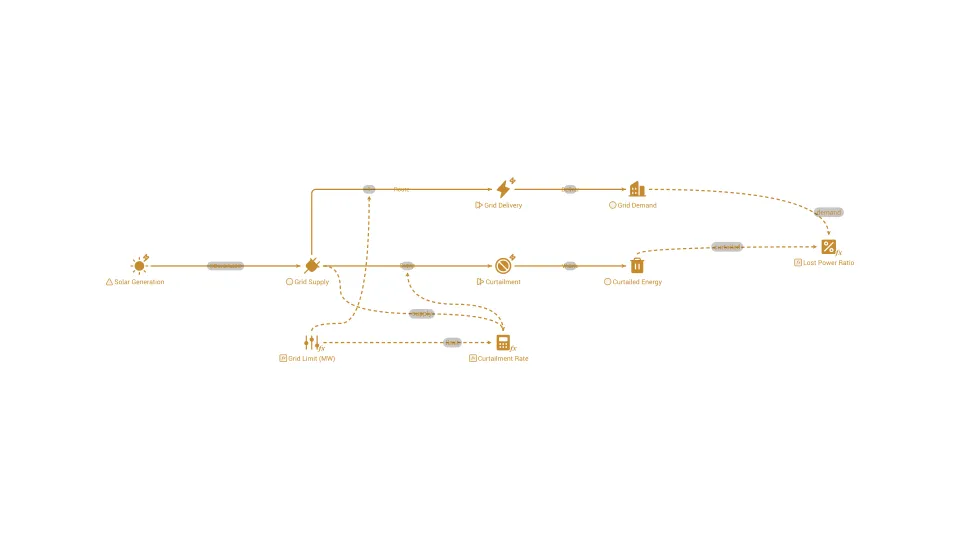
The deliberate reduction of a power plant's output below what it could produce, usually because the grid cannot use it.
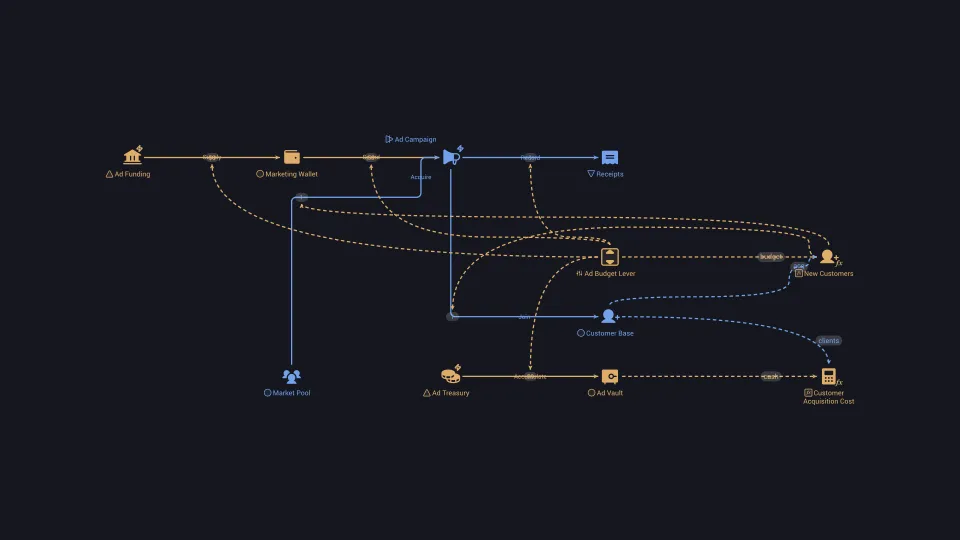
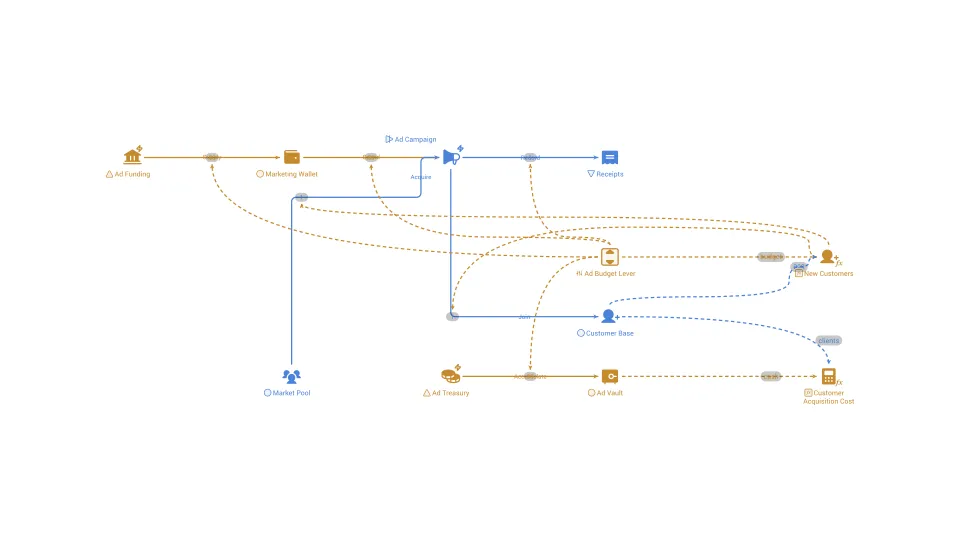
Customer acquisition cost
The average amount a business spends on sales and marketing to win one new paying customer.
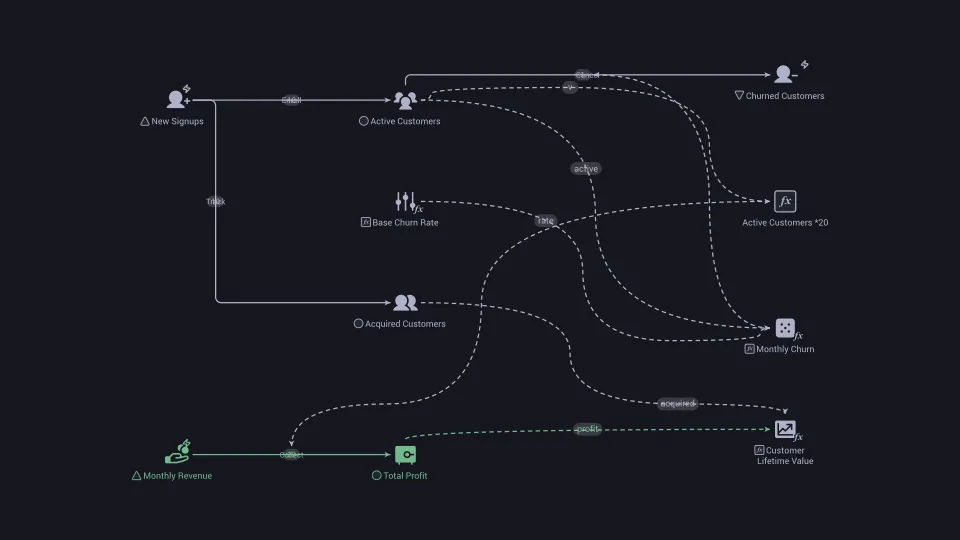
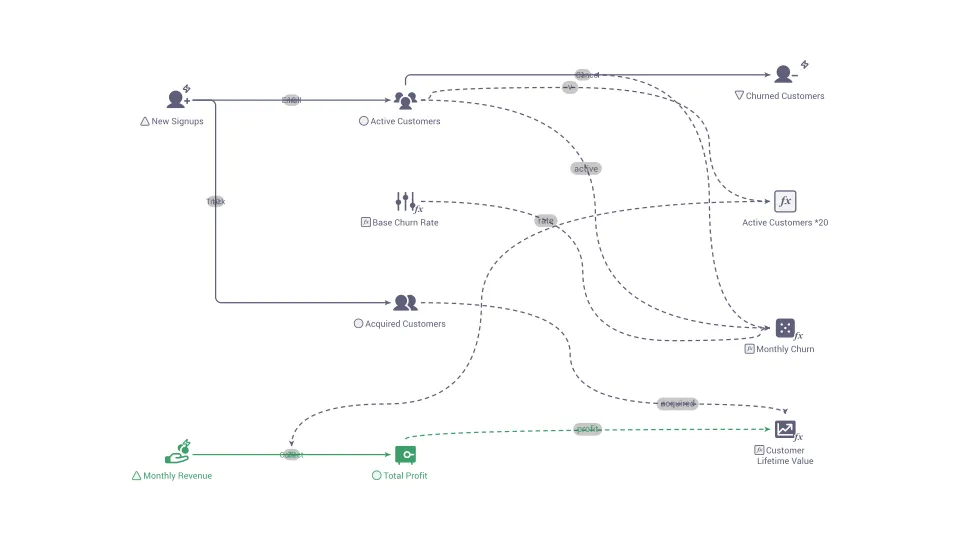
Customer lifetime value
The total profit a business expects to earn from an average customer over the whole time they stay a customer.
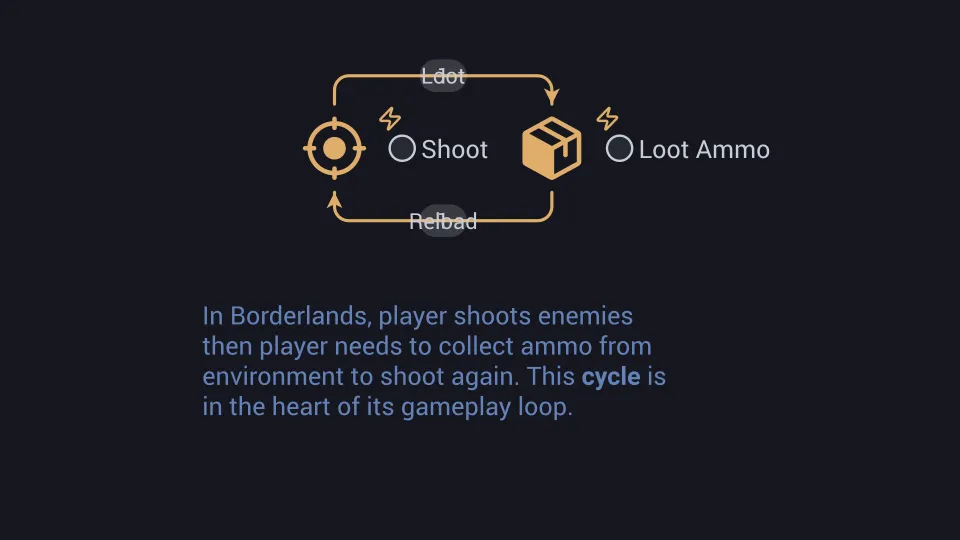
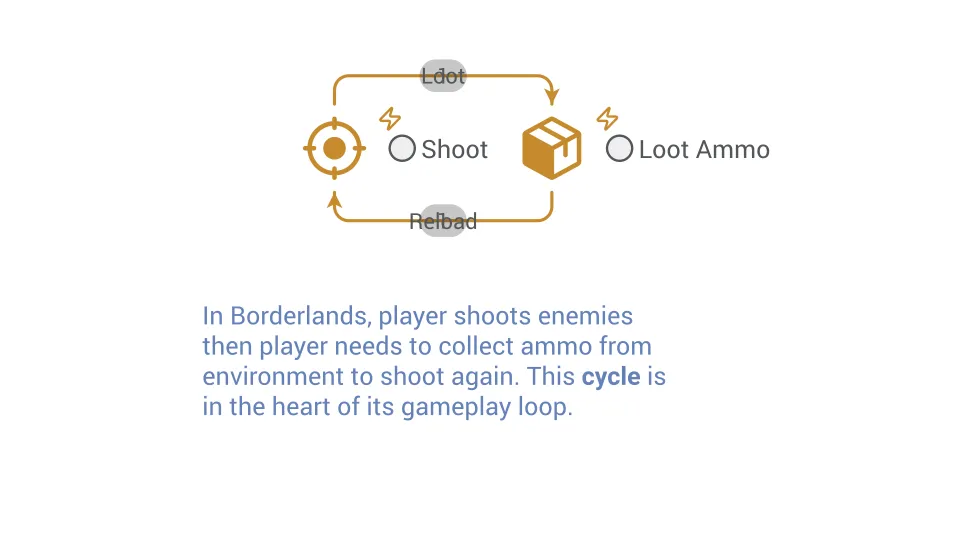
Cycle
The term "cycle" related to decay typically refers to a gameplay mechanic where game elements or conditions gradually deteriorate or worsen over time.
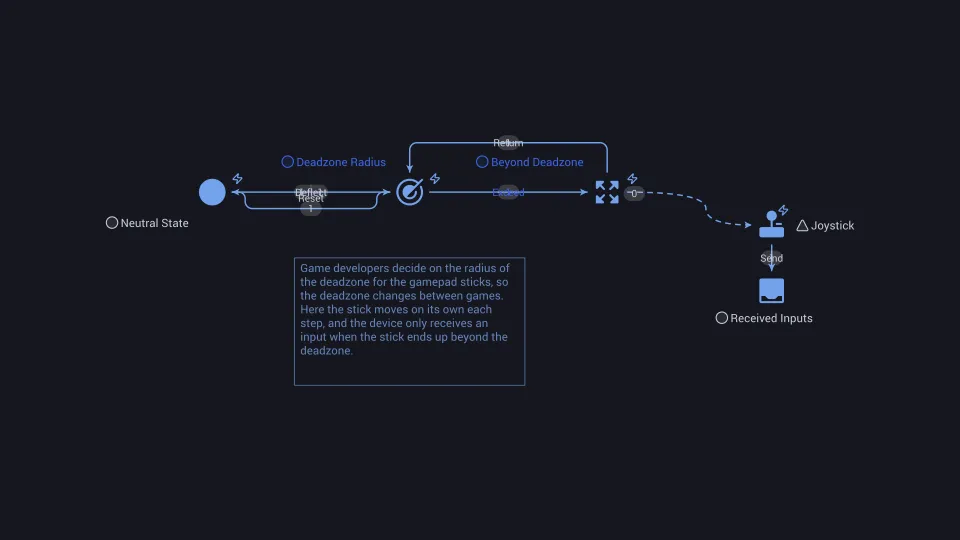
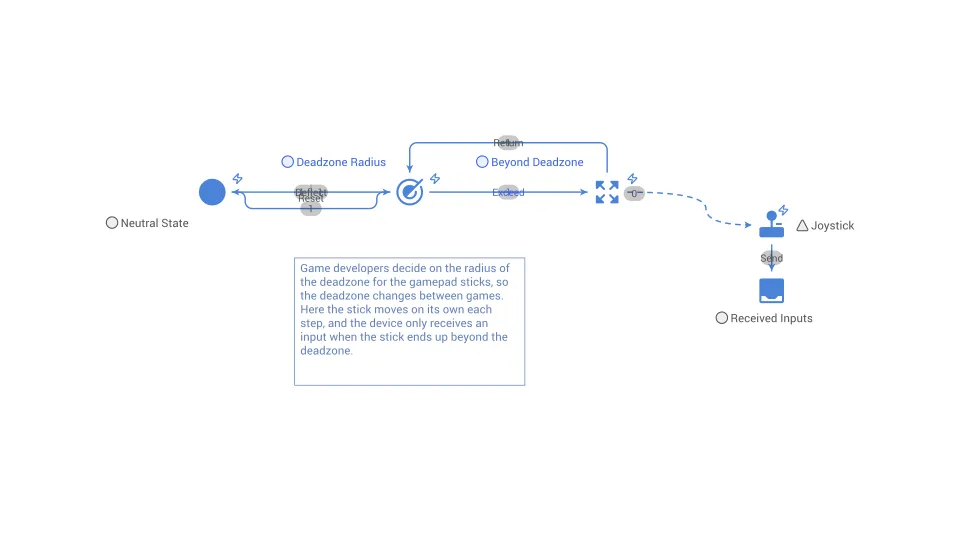
Dead zone
A "dead zone" refers to an area or region within the game's control input system where little to no response or effect occurs despite player input.
Deadweight loss
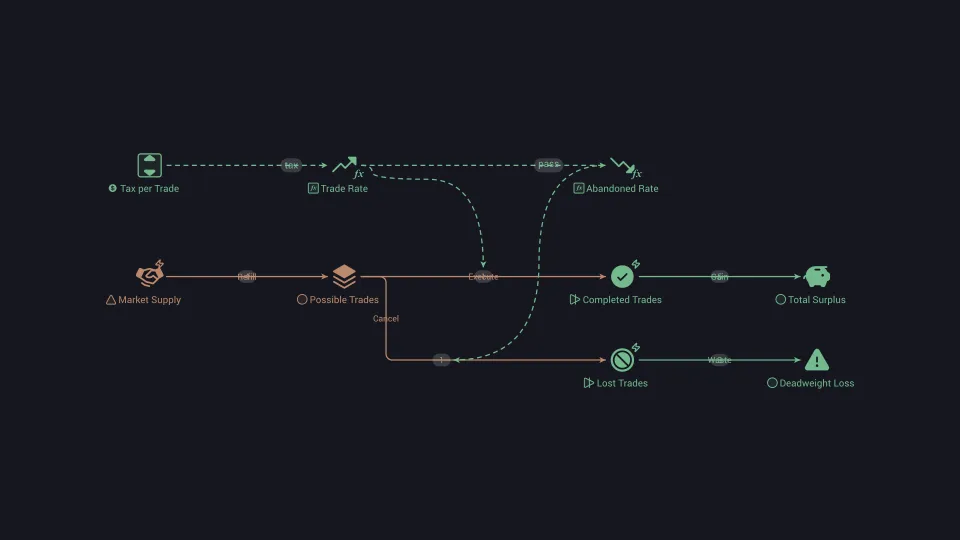
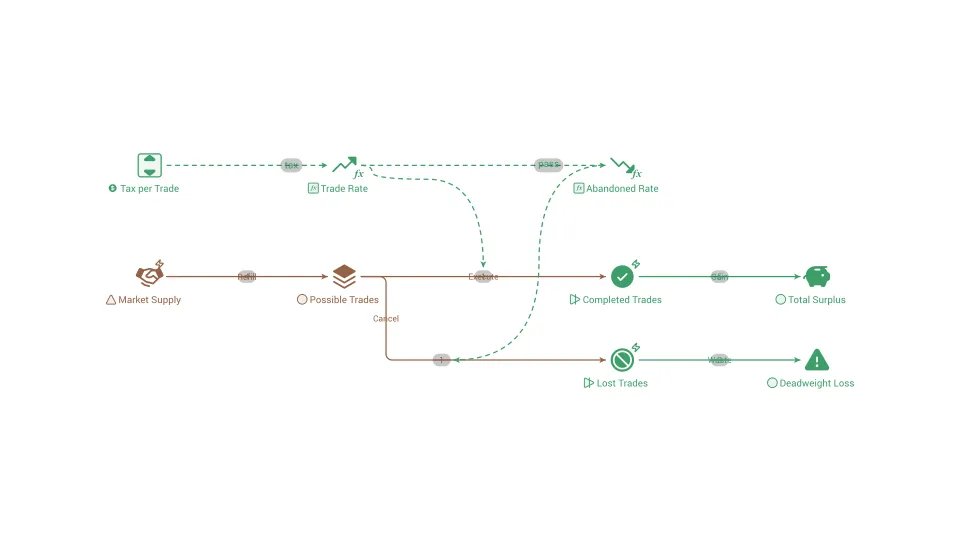
The value that disappears when a market trades less than it otherwise would, so nobody gets the benefit.
Decay (dynamic)
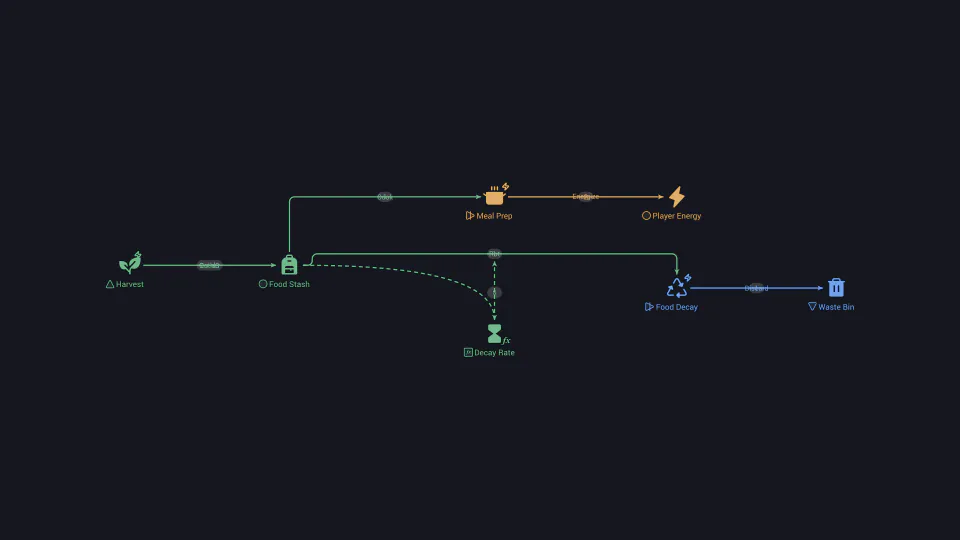
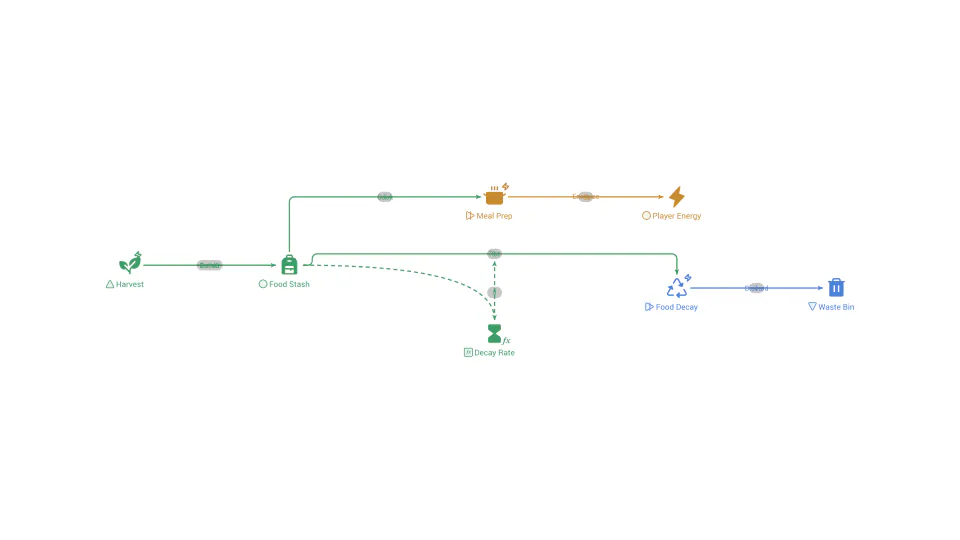
Decay refers to a mechanic or system where certain elements or conditions gradually deteriorate or change over time in a dynamic manner.
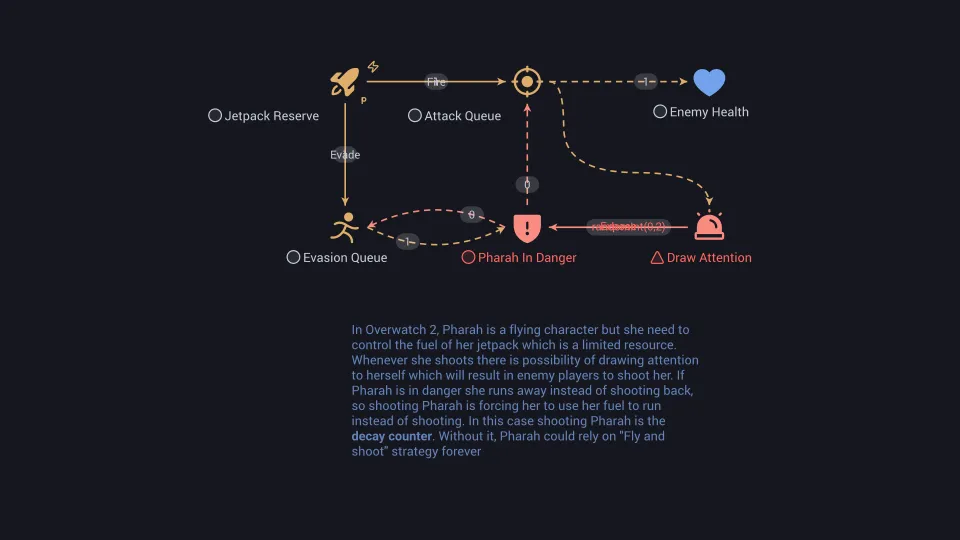
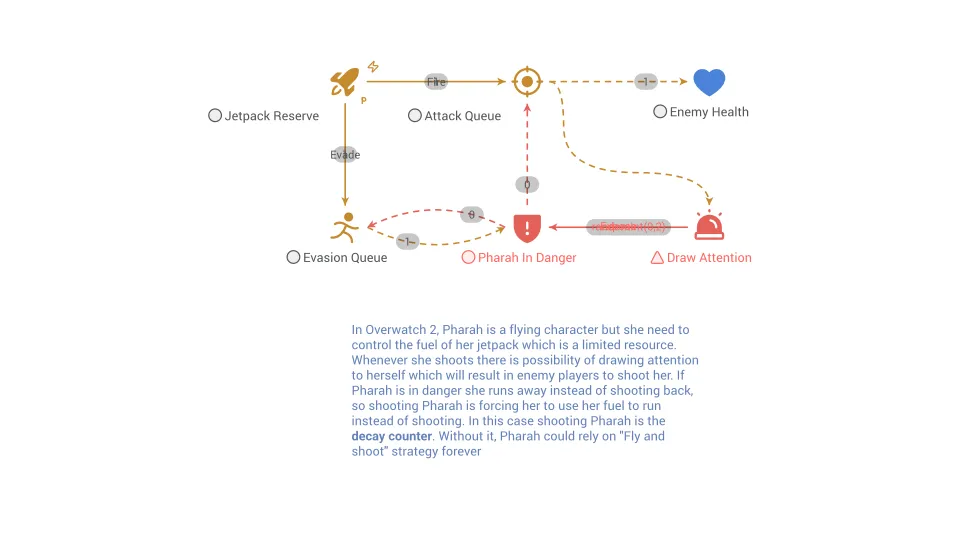
Decay counter
Decay counters deplete the opponent's resources over time, rendering their strategies that heavily rely on the depleted resource no longer viable.
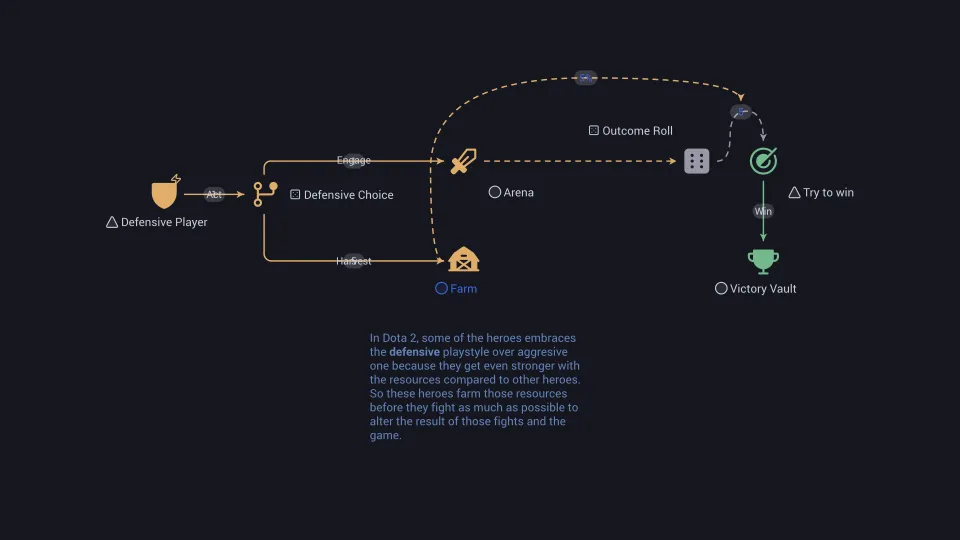
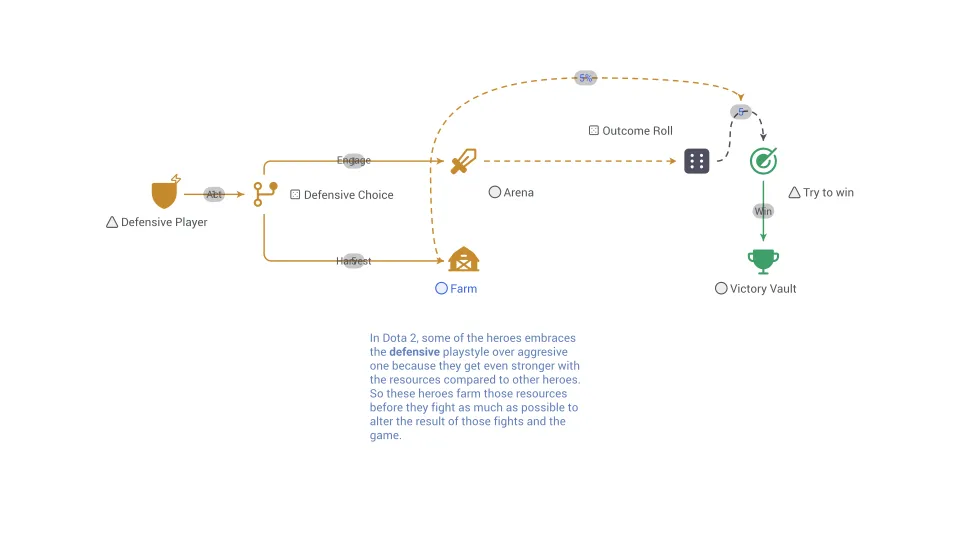
Defensive (playstyle)
Defensive playstyle refers to a strategic approach where players prioritize defense, protection, and cautious tactics over aggressive actions.
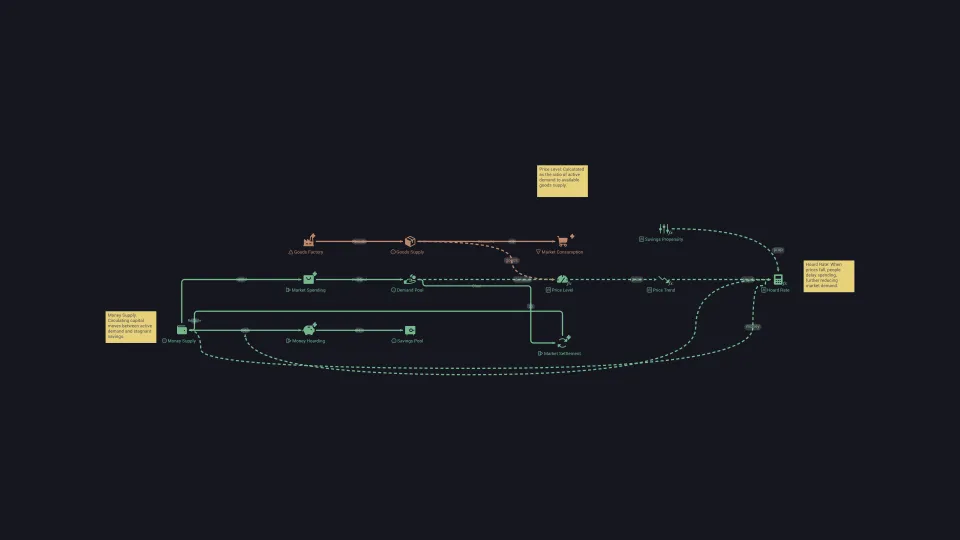
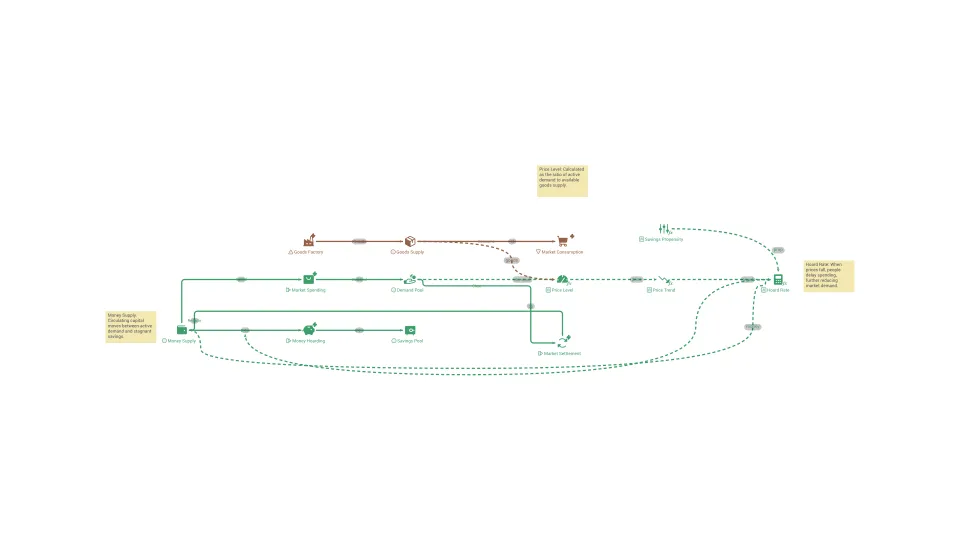
Deflation
A general, sustained fall in prices over time, which means each unit of money buys more than it did before.
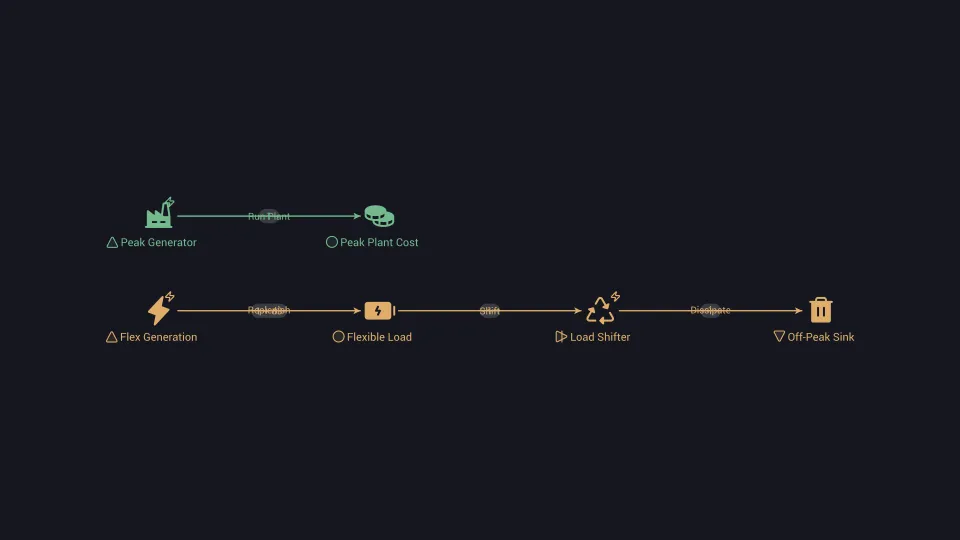
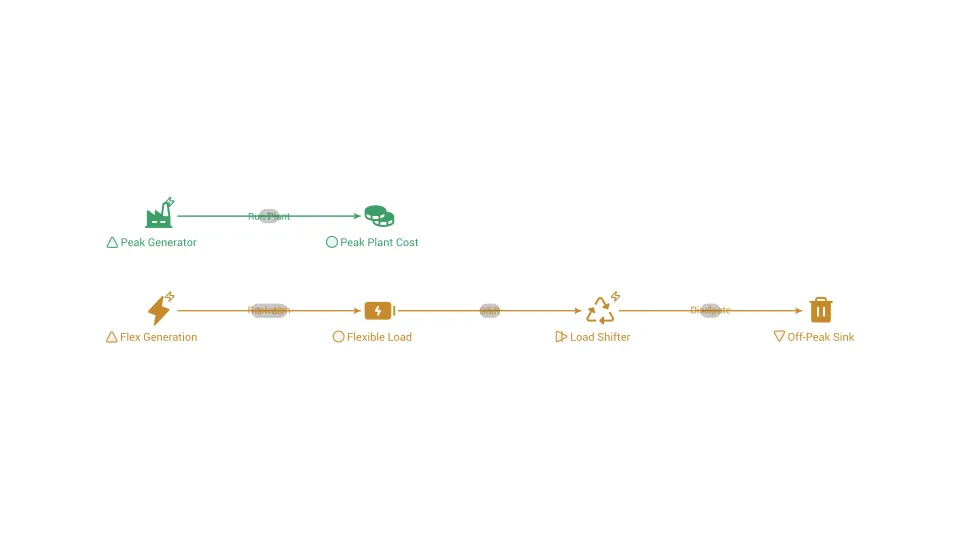
Demand response
A way of balancing a power system by paying or encouraging customers to use less electricity, or to shift use, when supply is tight.
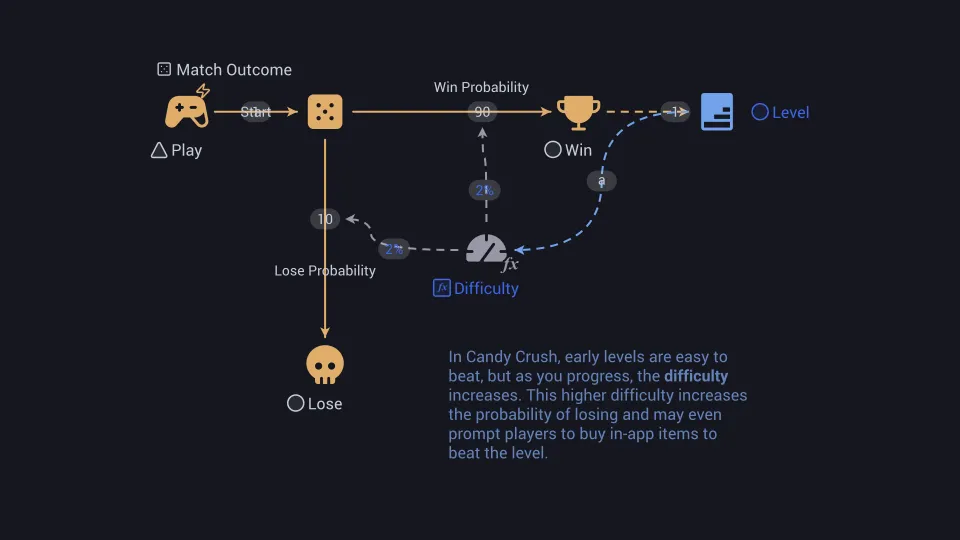
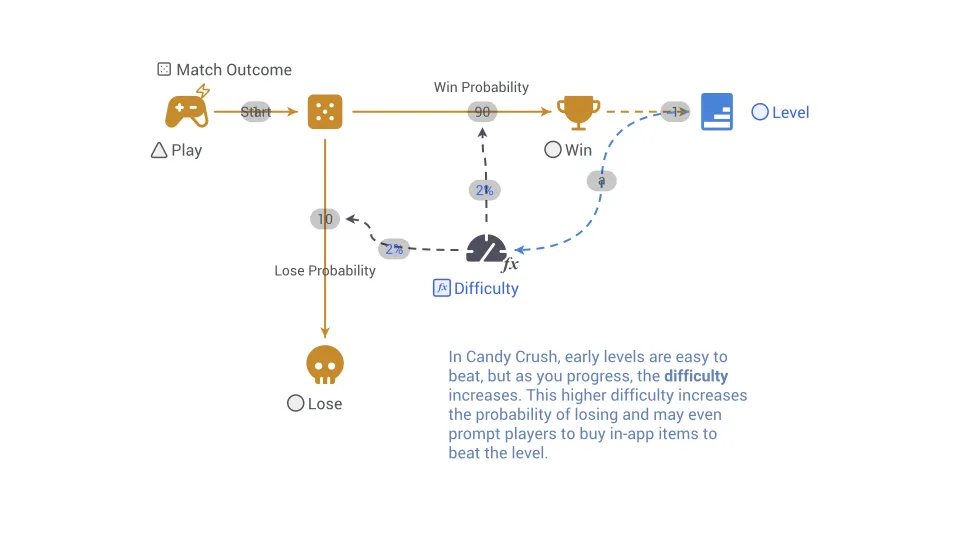
Difficulty
Difficulty in game design refers to the level of challenge or complexity presented to players.
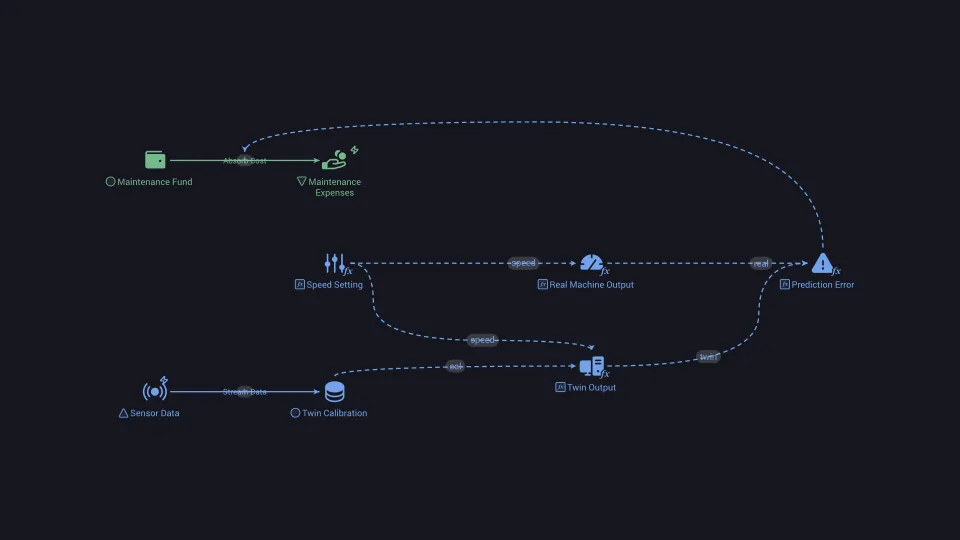
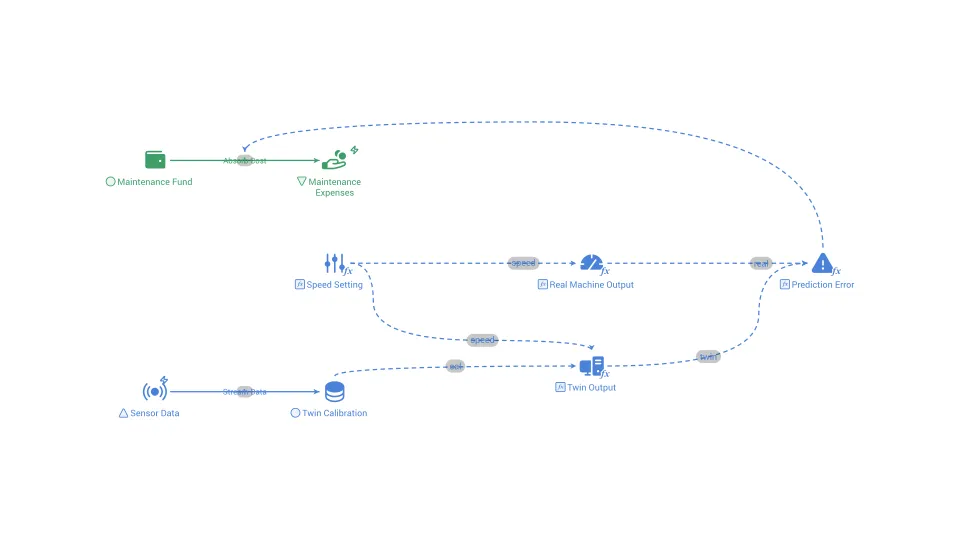
Digital twin
A live or regularly updated model of a real asset, process, or organization that is used to test changes and predict results before acting.
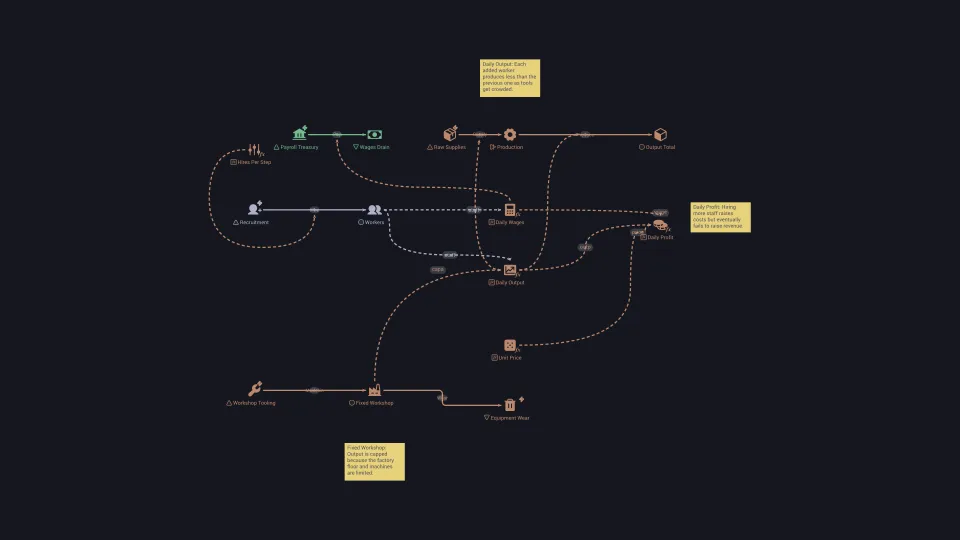
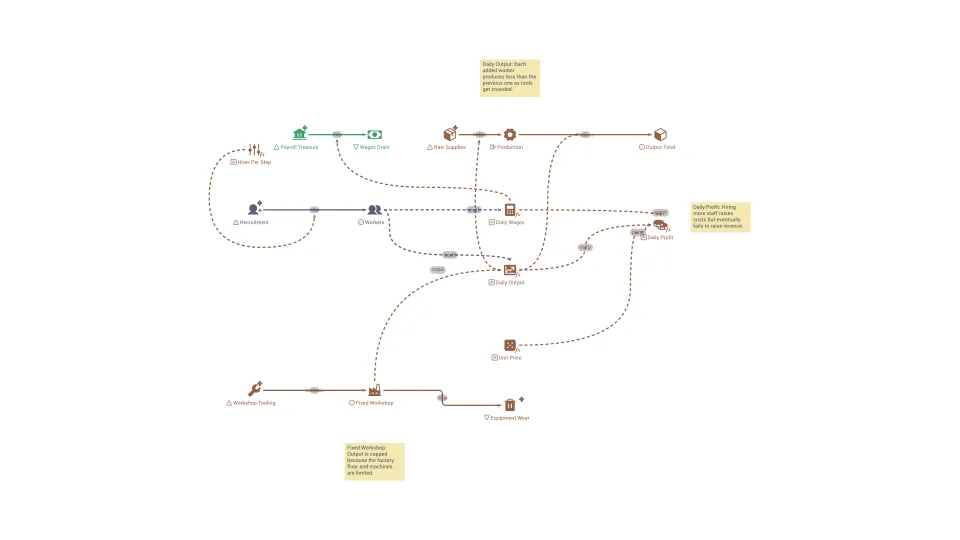
Diminishing returns
The pattern where each extra unit of input adds less to output than the one before it, when everything else stays fixed.
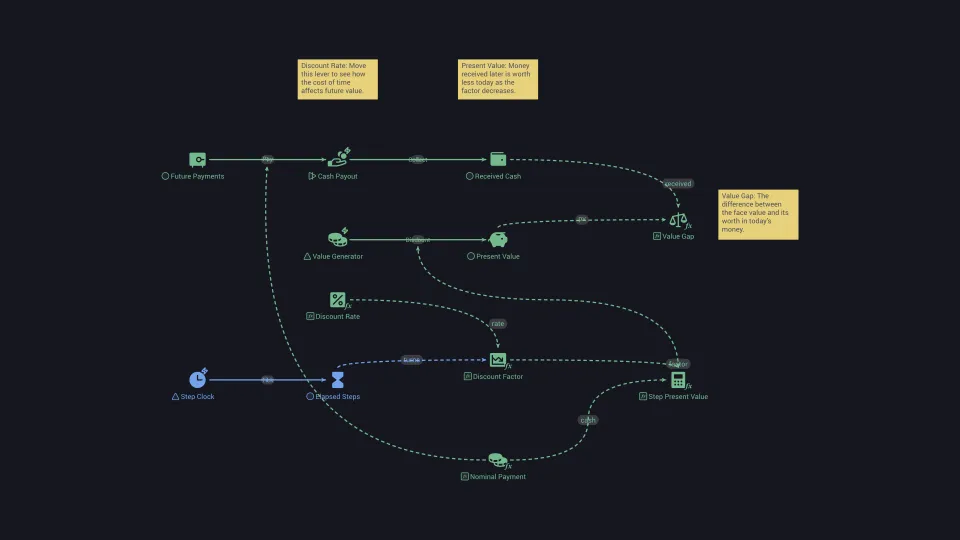
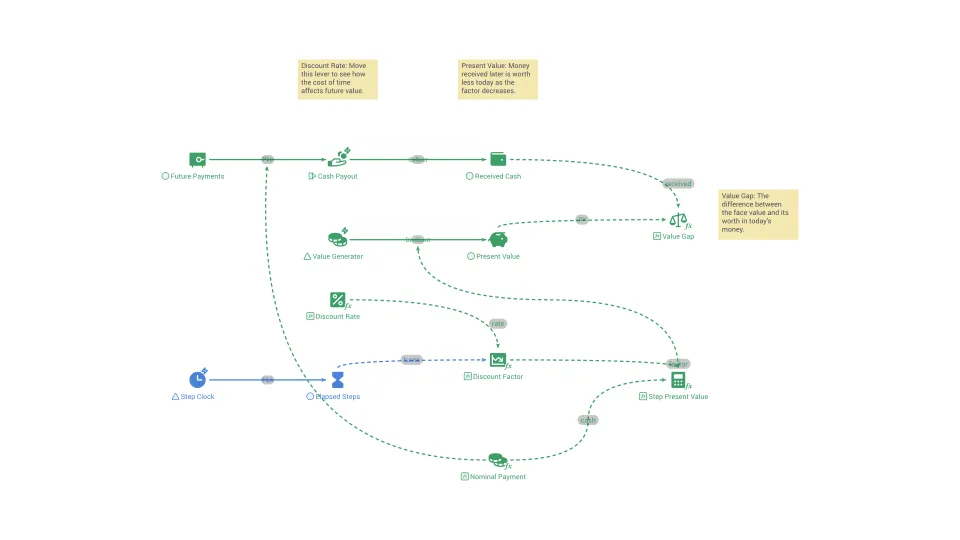
Discount rate
The yearly percentage used to convert future money into today's value, reflecting the return you could earn elsewhere and the risk.
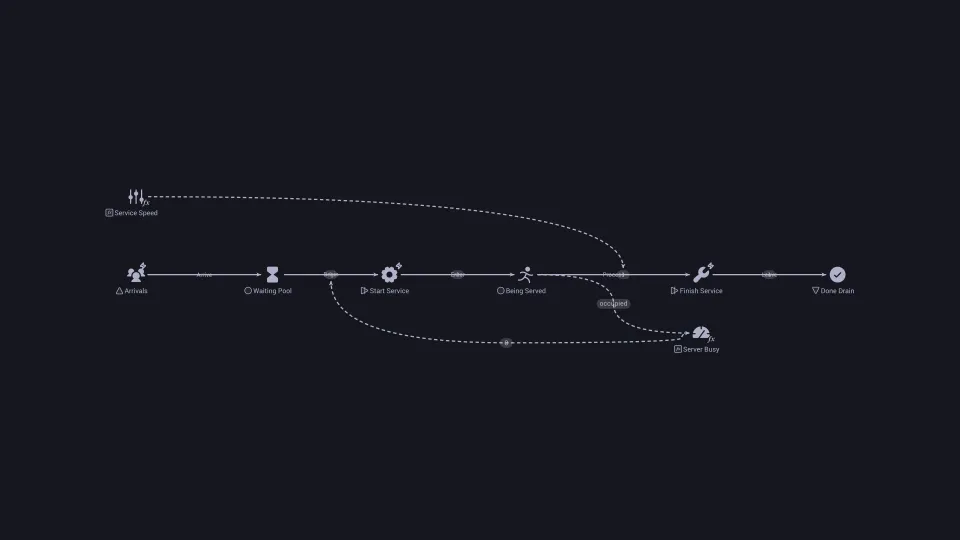
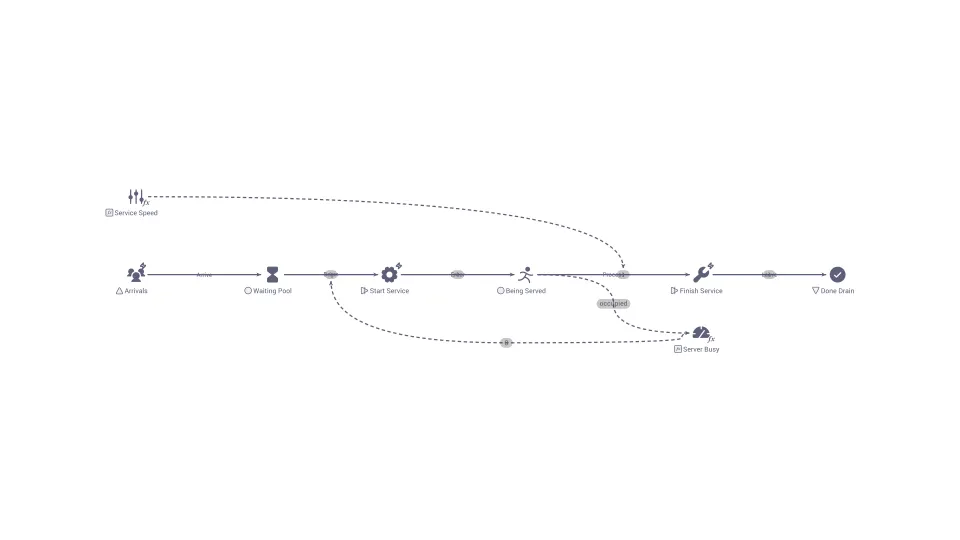
Discrete-event simulation (DES)
Discrete-event simulation (DES) models a system as a sequence of separate events, jumping from one event to the next, such as an arrival or a finished job.
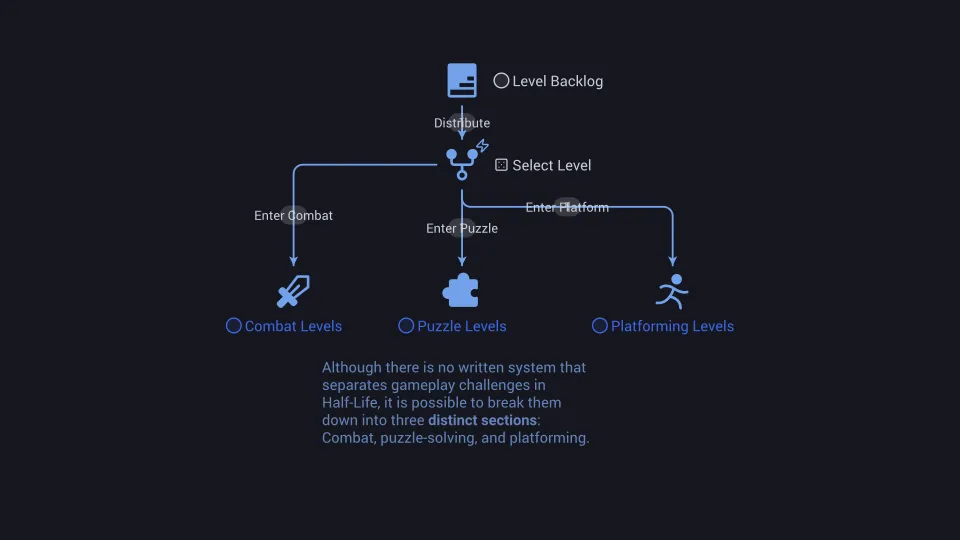
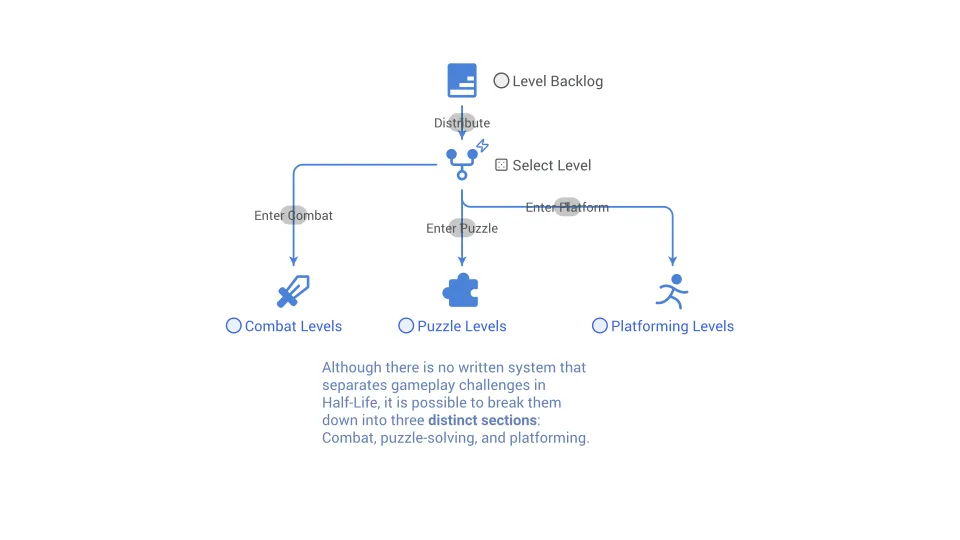
Distinct section (variation)
Distinct Section refers to a specific segment within a game that offers unique gameplay mechanics, aesthetics, or narrative elements.
Diversification
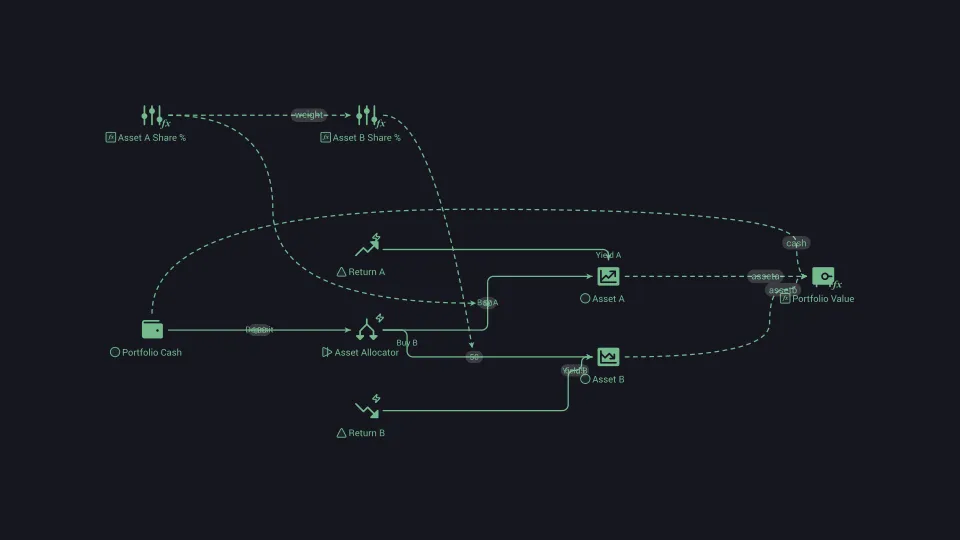
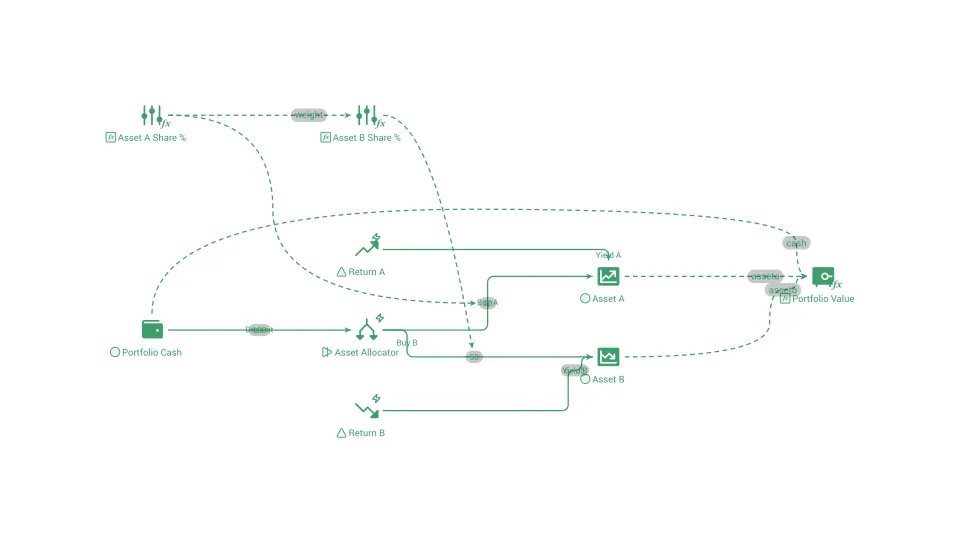
Spreading money across assets that do not move together, so one bad result hurts less and overall swings shrink.
Dominant strategy
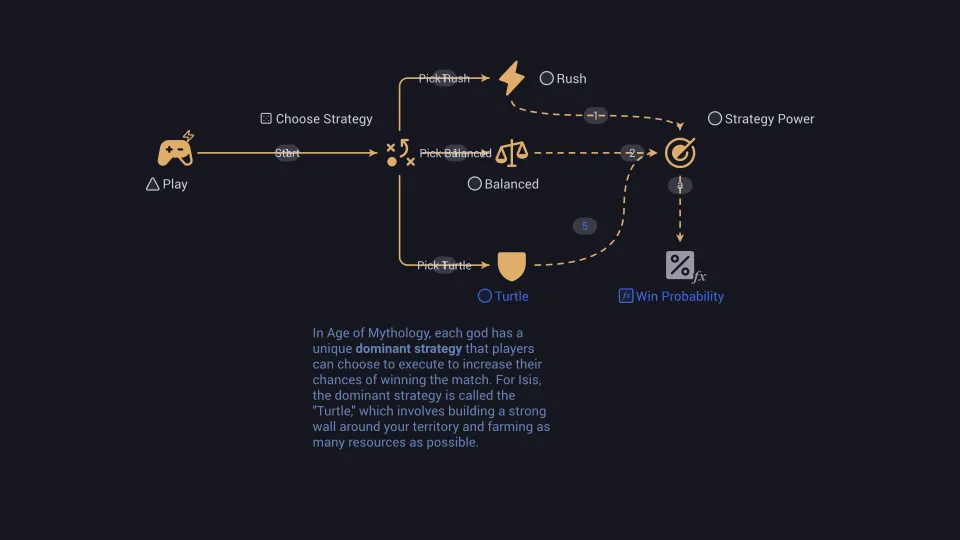
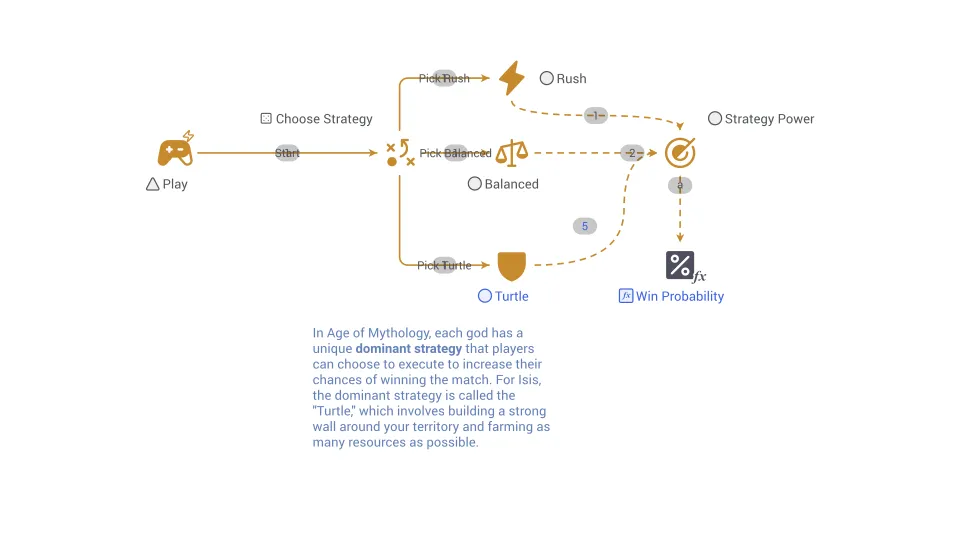
Dominant Strategy refers to a strategy or course of action that provides players with a higher chance of success or advantage over other available options.
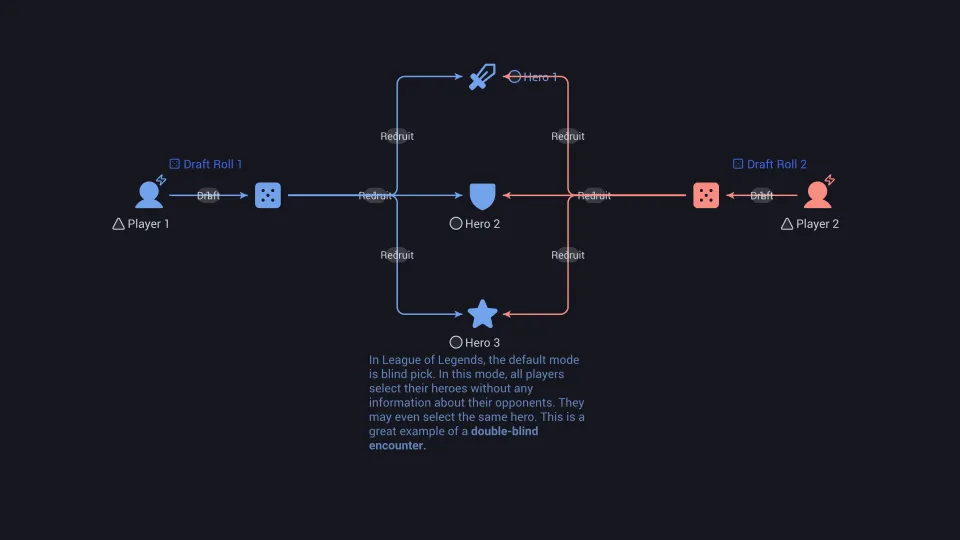
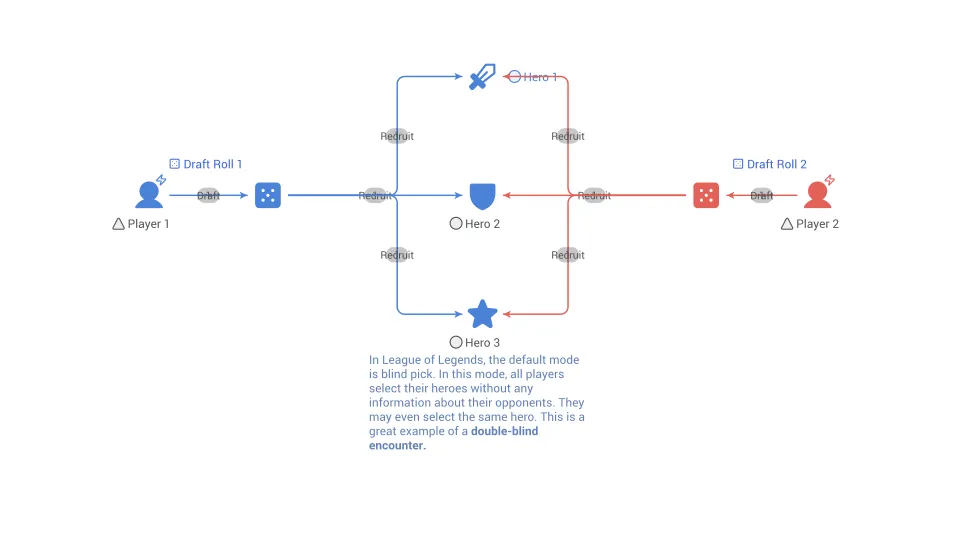
Double blind encounters
Double Blind Encounters are gameplay situations where neither the player nor the opponent has complete knowledge of each other's actions or intentions.
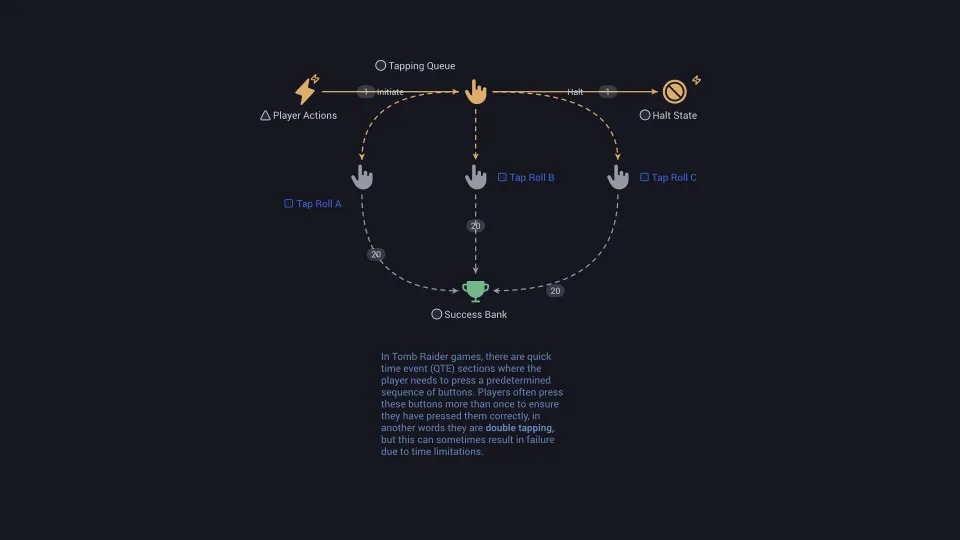
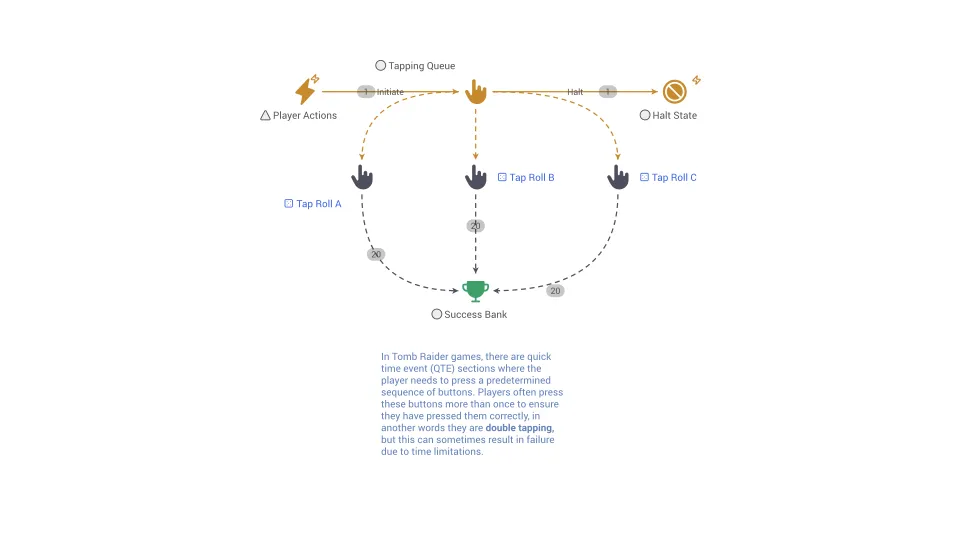
Double-Tapping
Double-tapping refers to the action of tapping a control or input twice in quick succession to ensure the system registers the command.
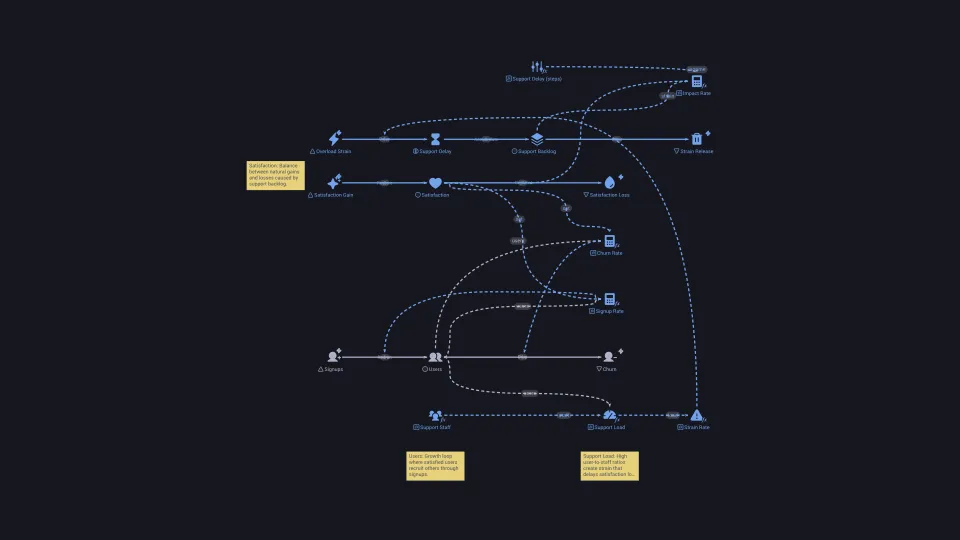
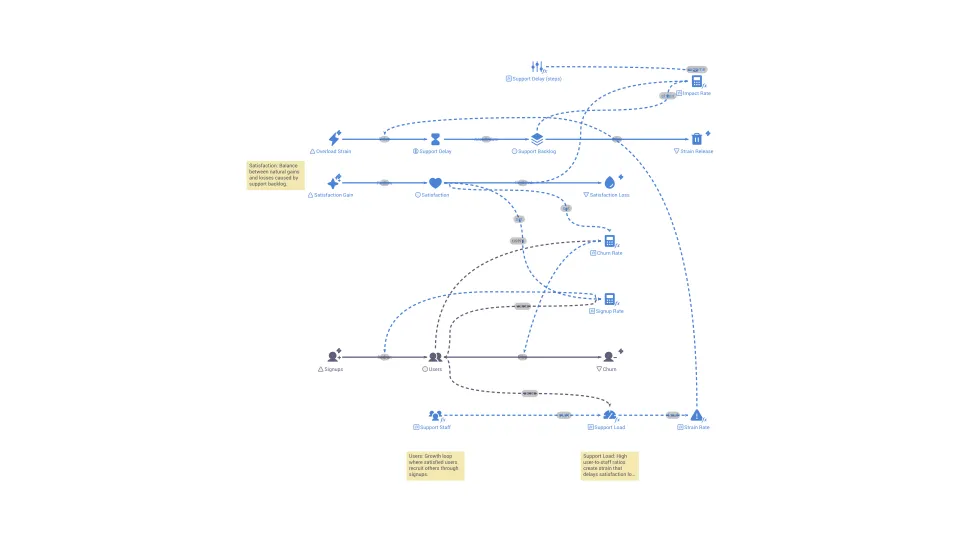
Dynamic hypothesis
A proposed explanation of how the feedback structure of a system produces the pattern of behavior over time that you are trying to understand.
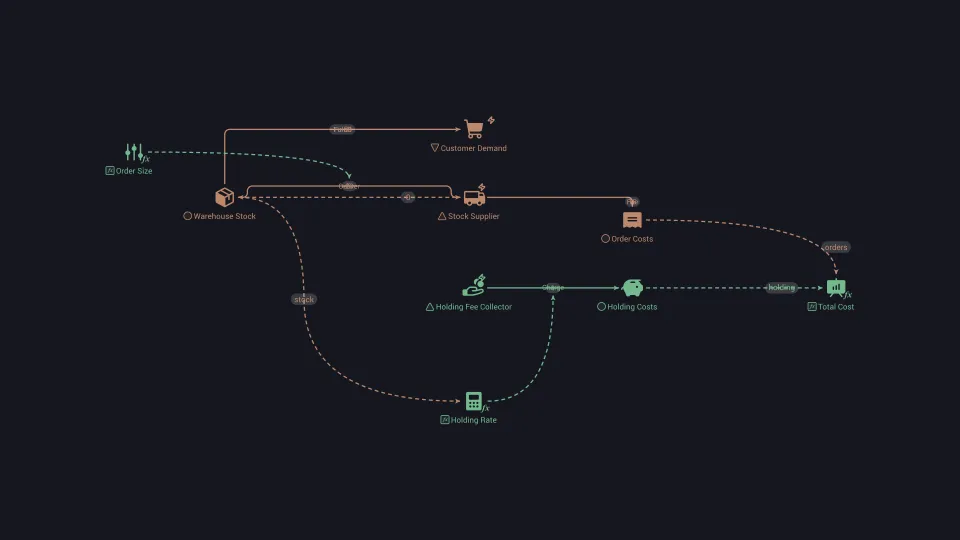
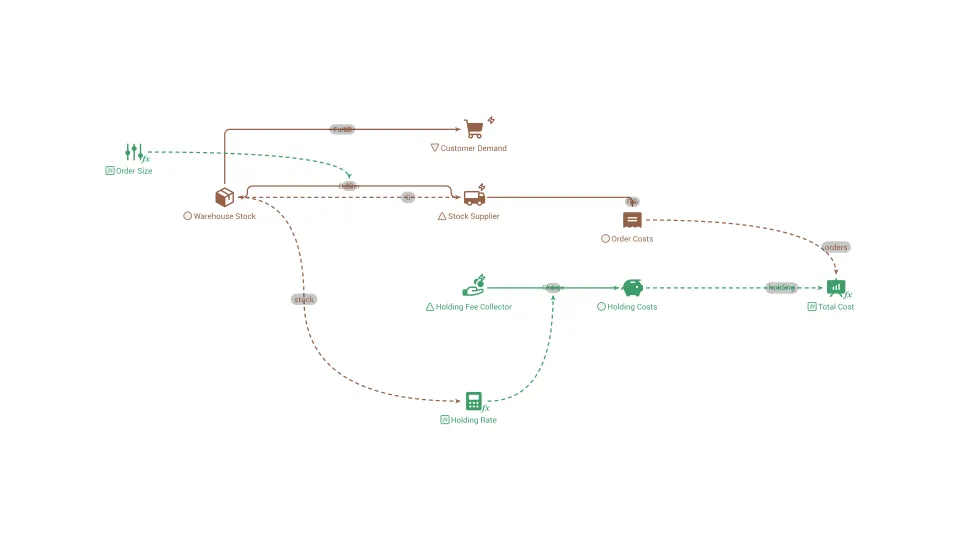
Economic order quantity
The order size that minimizes the combined yearly cost of placing orders and holding stock.
Economies of scale
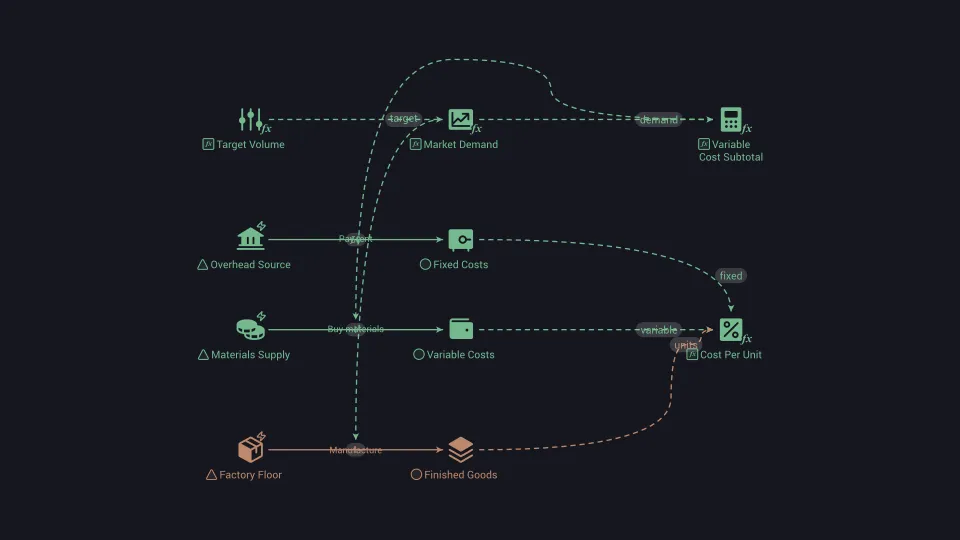
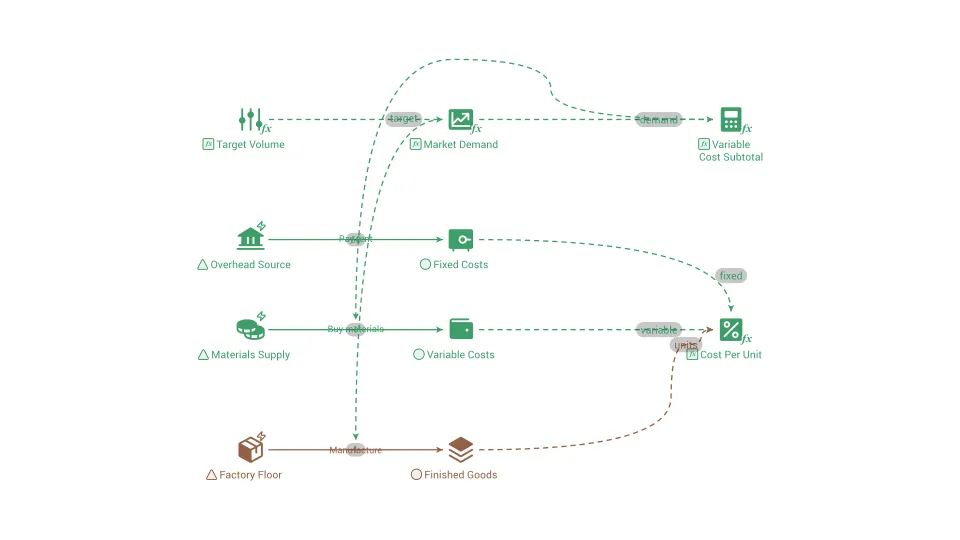
The drop in cost per unit that comes from producing more, because fixed costs are spread over a larger output.
Effort
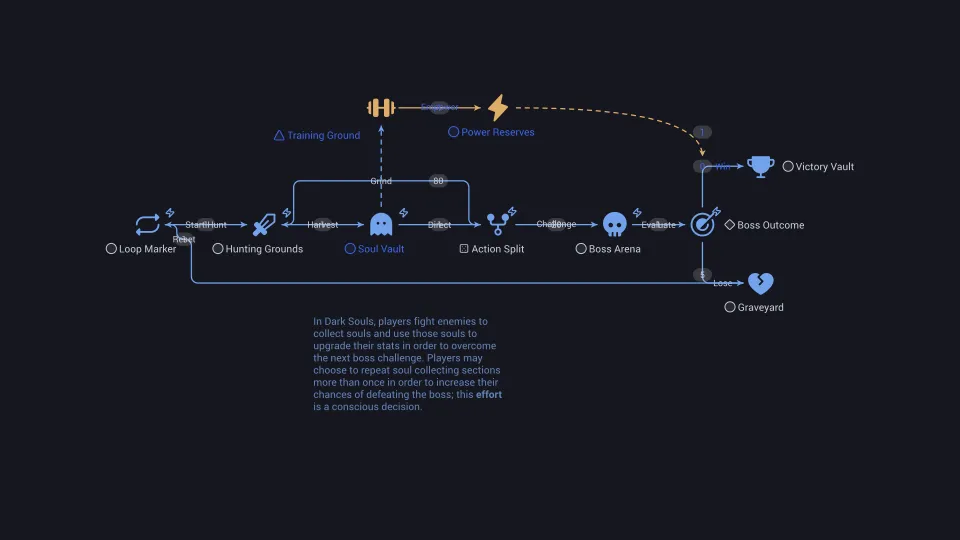
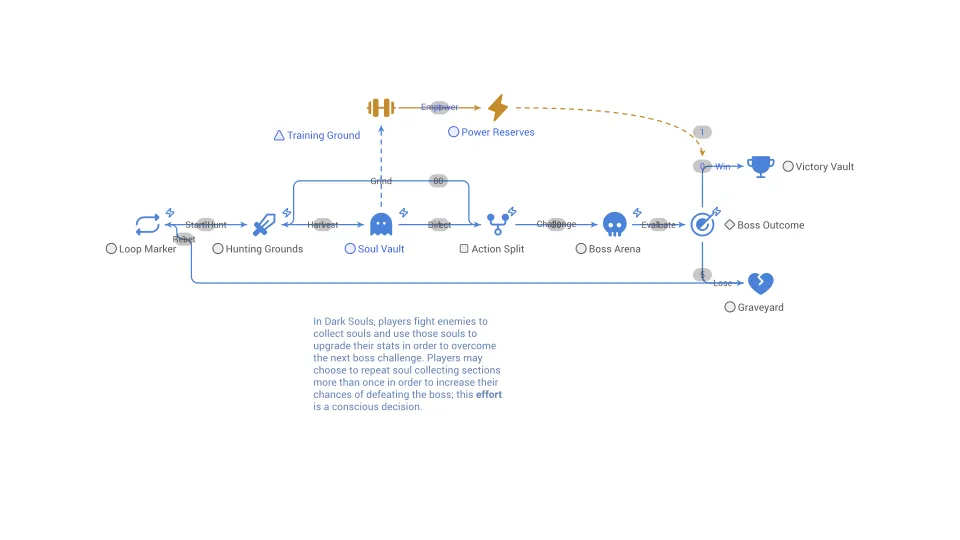
Effort in game design refers to the level of exertion, skill, or mental investment required from players to achieve specific goals, or progress in the game.
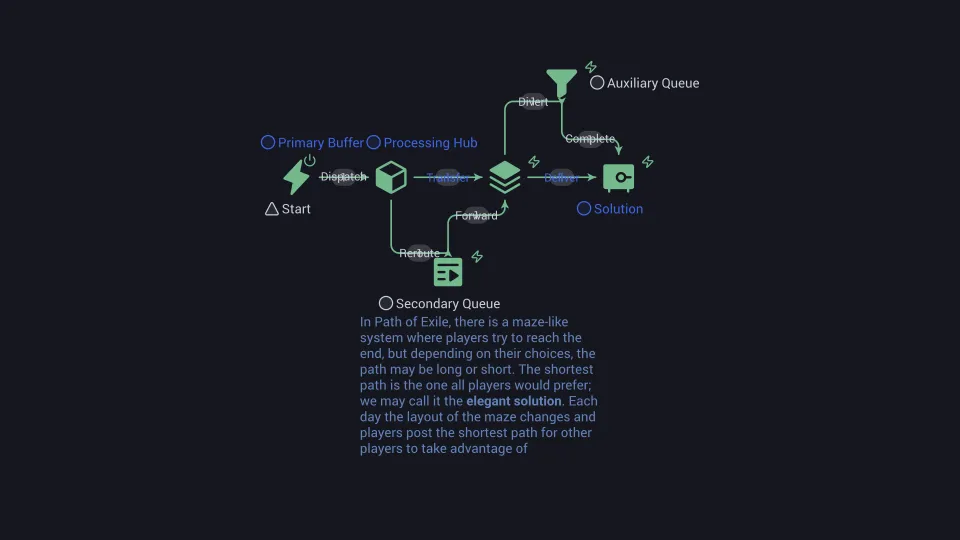
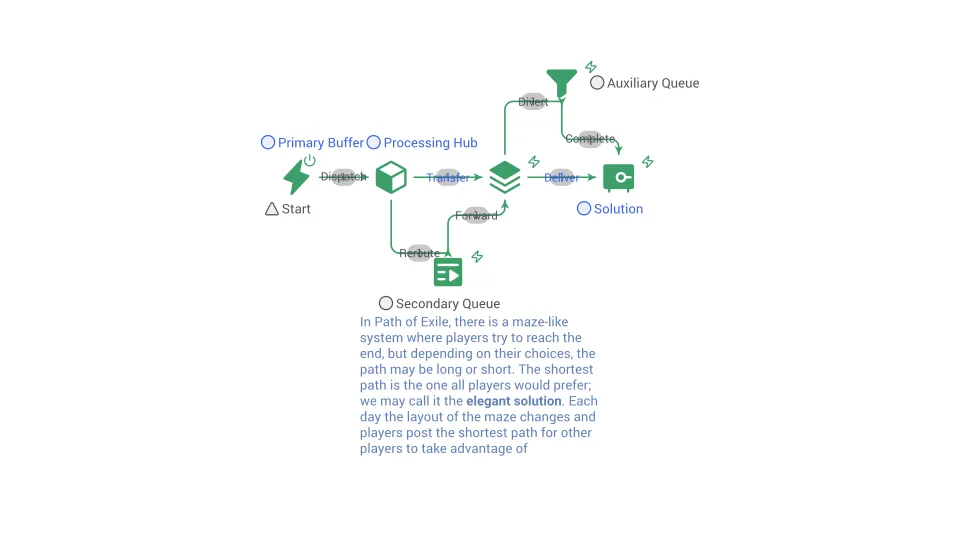
Elegant solution
An Elegant Solution in game design refers to a well-crafted, efficient, and streamlined approach to solving.
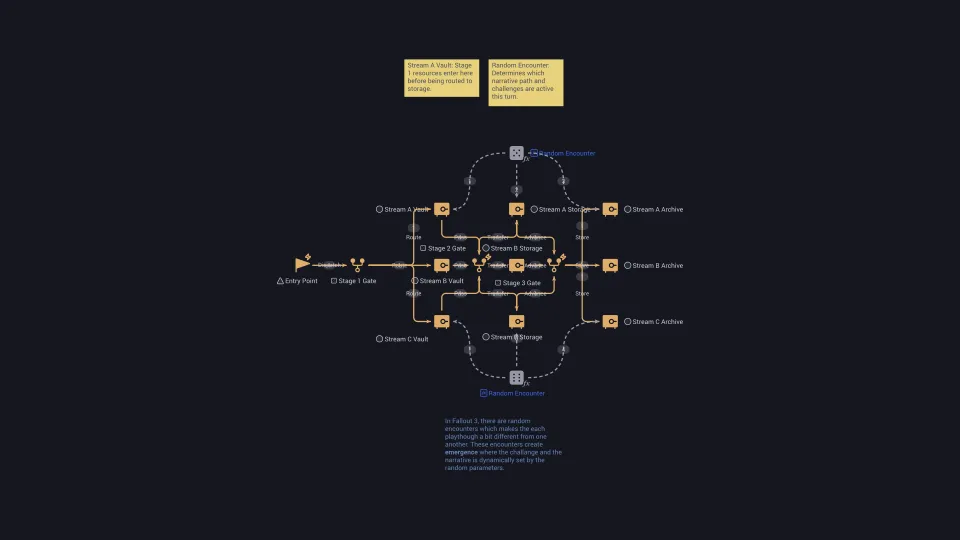
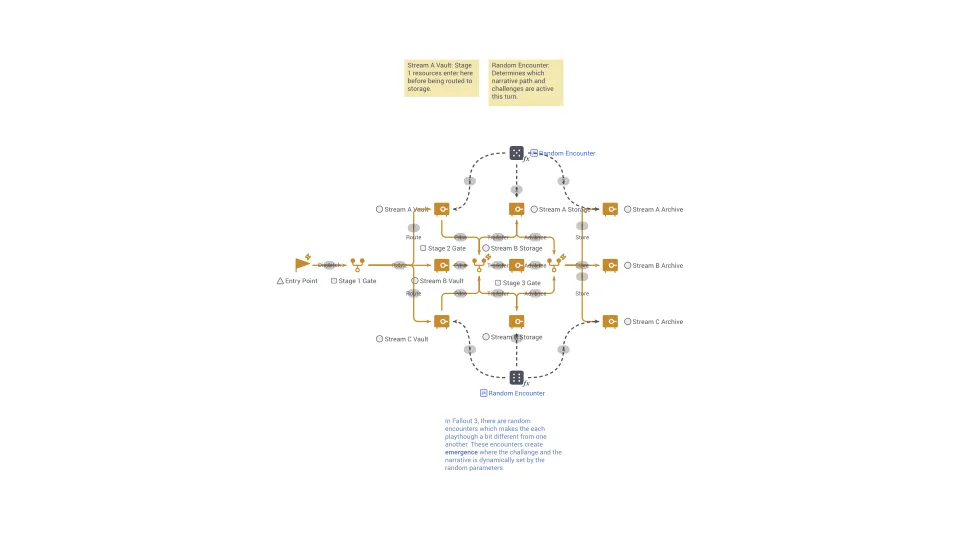
Emergence (gameplay)
Gameplay emergence refers to the dynamic and unpredictable interactions which lead to unique and unscripted experiences for players.
Energy storage
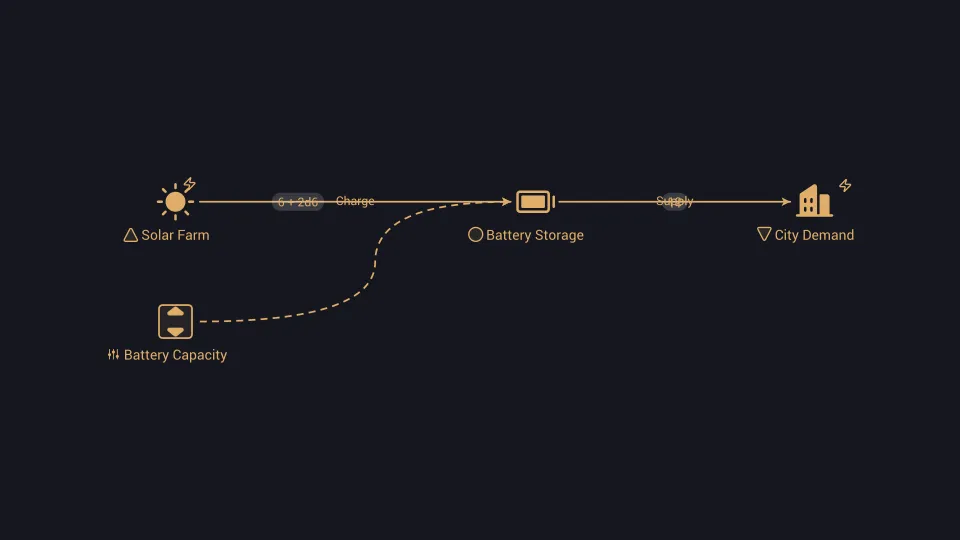
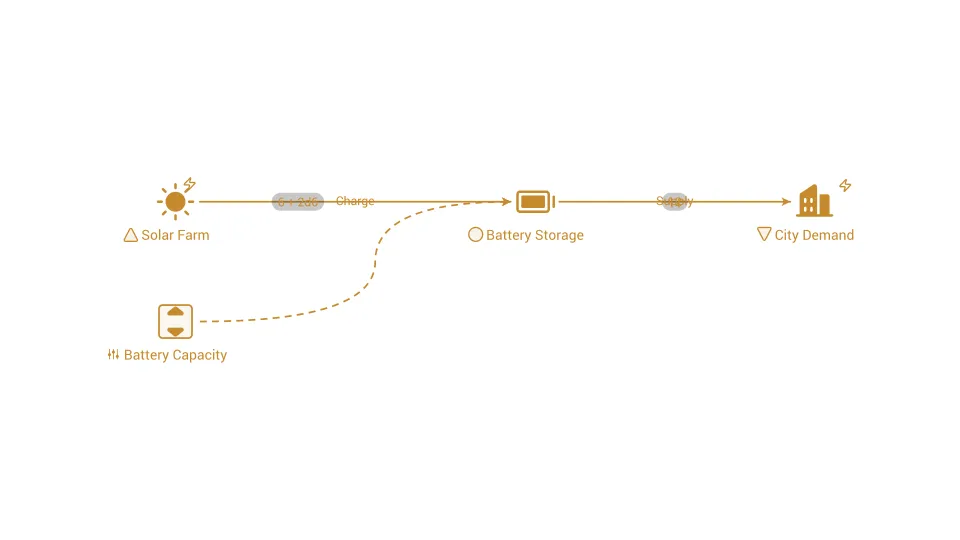
The holding of energy produced at one time so that it can be used at another, for example in batteries or pumped water.
Equilibrium
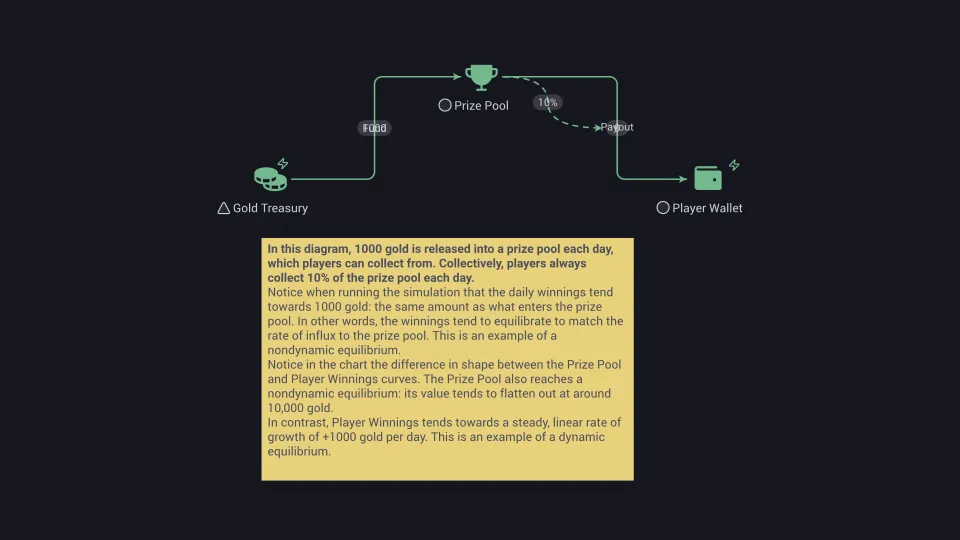
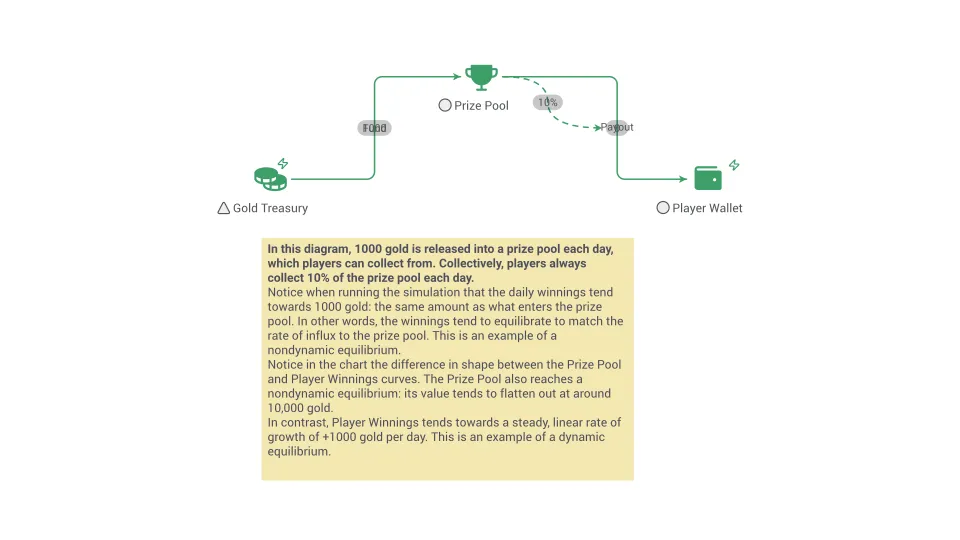
A state in which opposing forces balance, so a system stays steady until something outside disturbs it.
Escalation archetype
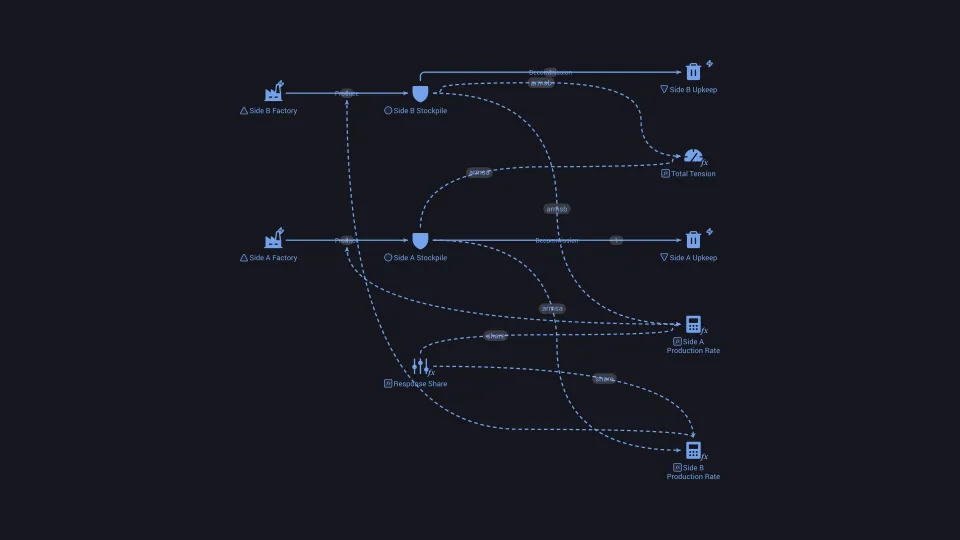
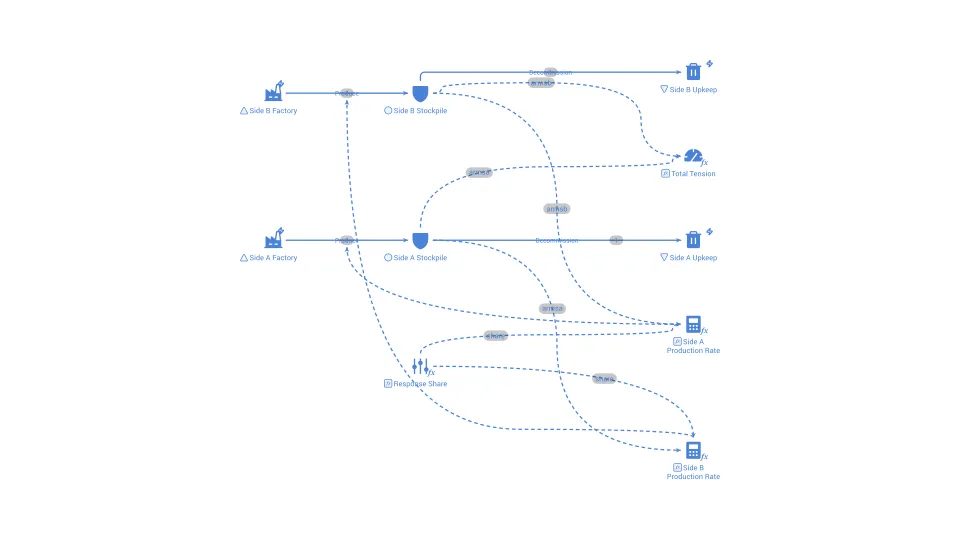
A pattern in which two parties each respond to the other's moves with a stronger move, so both keep raising their effort and both lose.
Euler integration
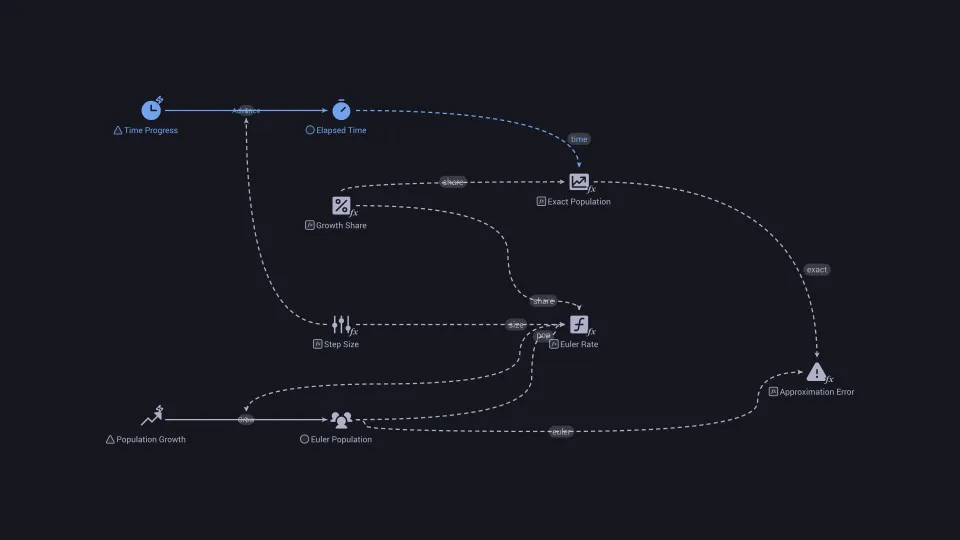
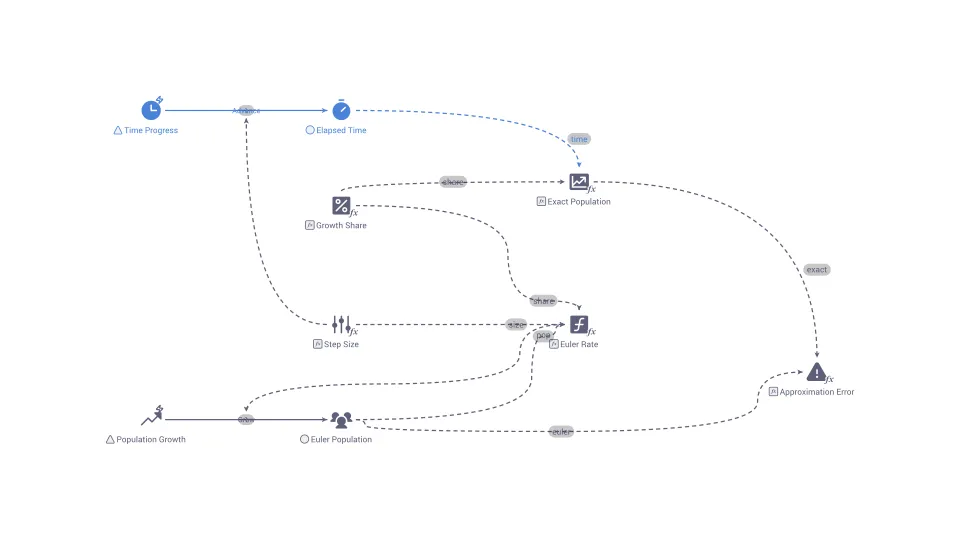
The simplest numerical method for stepping a simulation forward: the next value equals the current value plus the time step times the current rate.
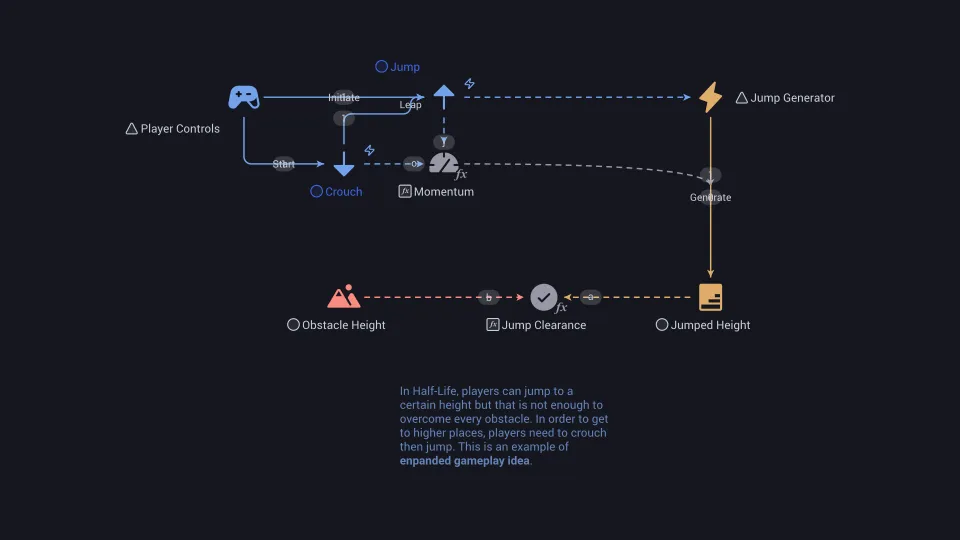
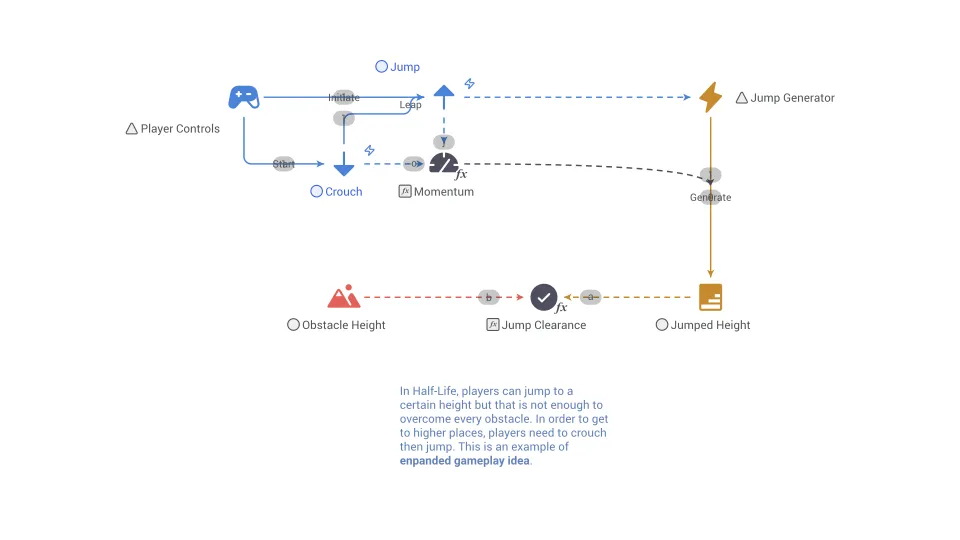
Expanded gameplay idea (maybe crouch jump)
Expanded gameplay ideas introduce new mechanics, broadening players' actions and possibilities in the game.
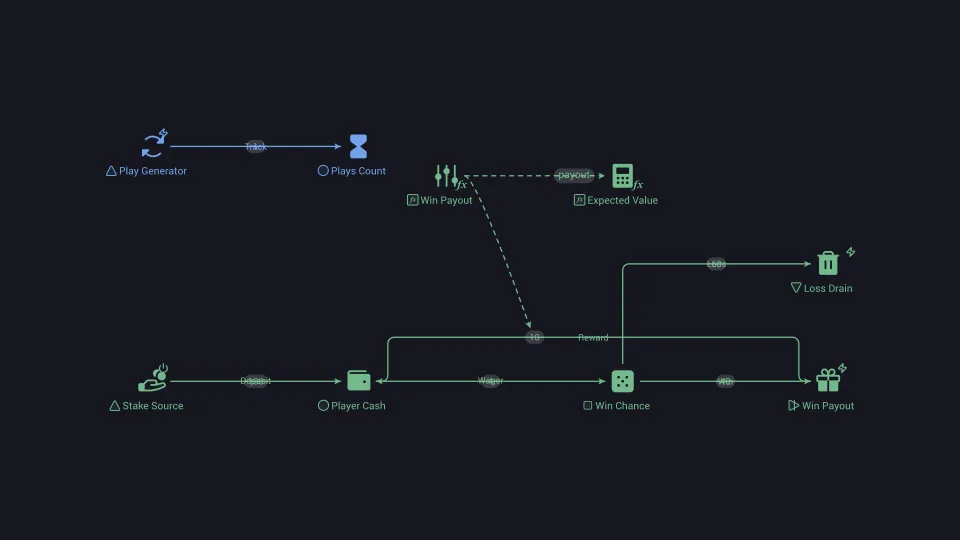
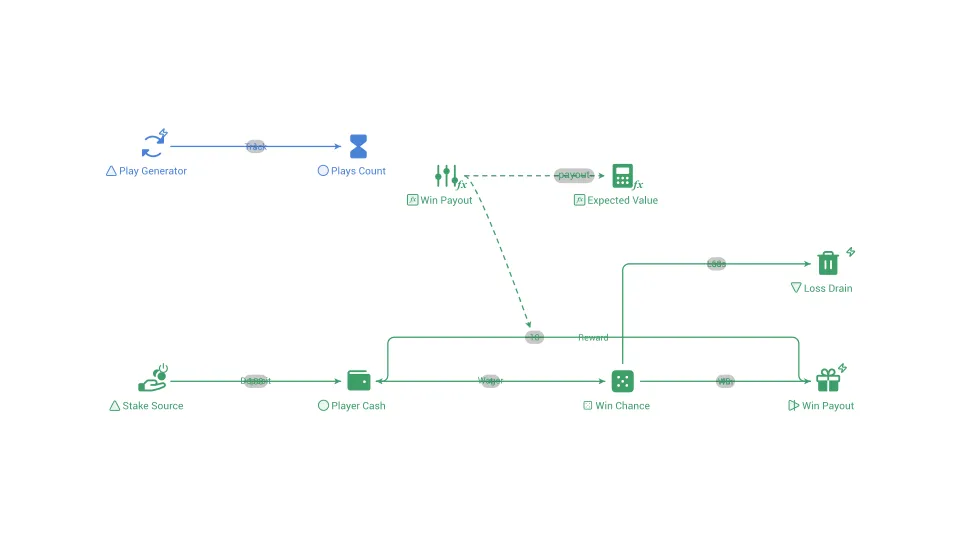
Expected value
The probability-weighted average of all possible outcomes, showing what a risky choice yields on average over many repetitions.
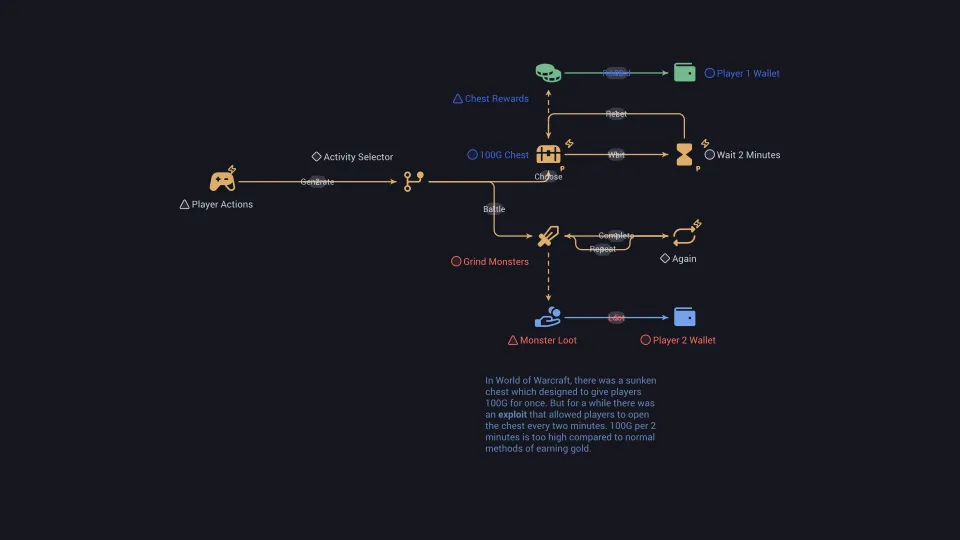
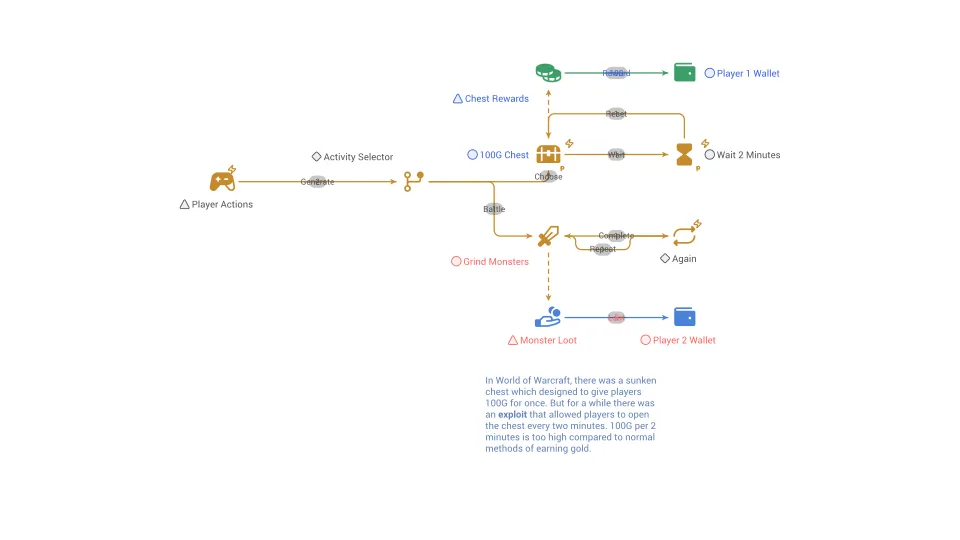
Exploit
In game design, an exploit is the unintended use of mechanics, features, or glitches to gain an unfair advantage or bypass intended limitations.
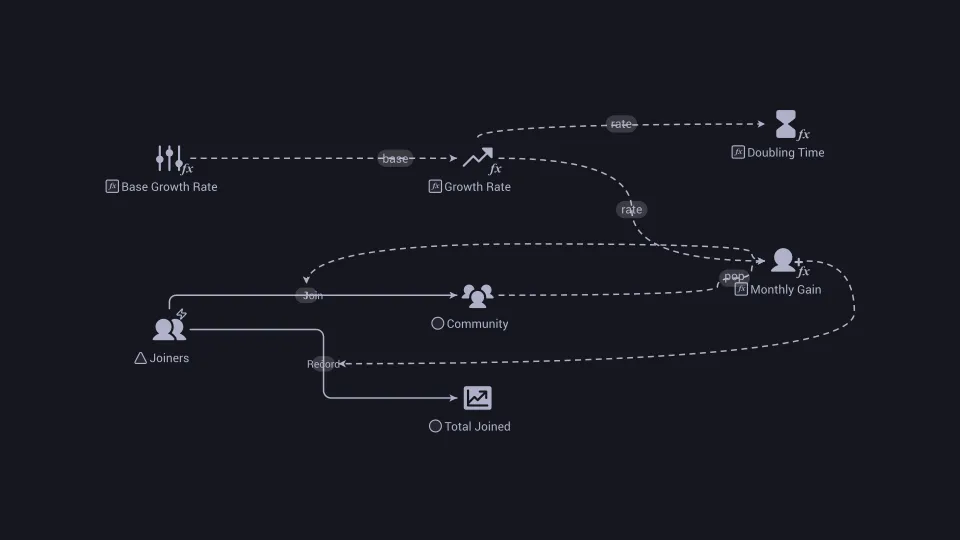
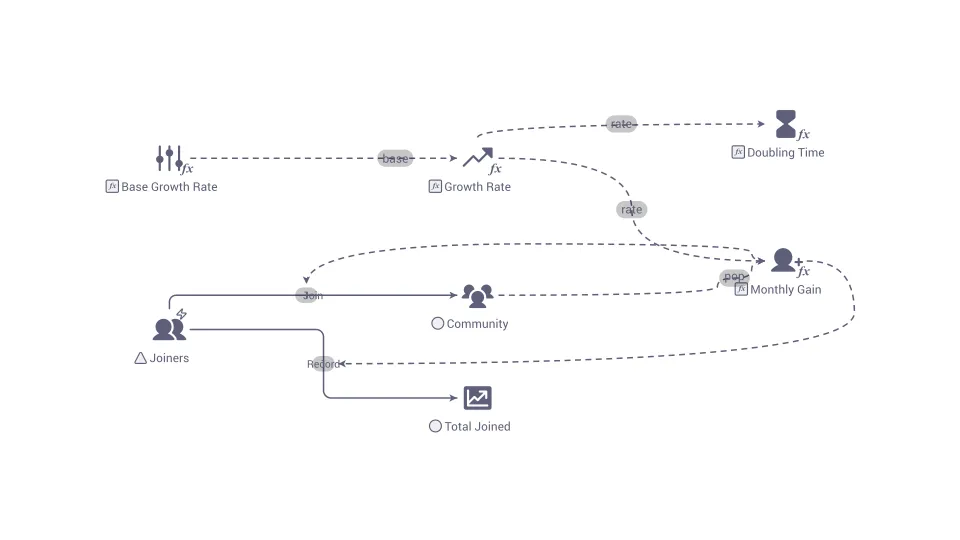
Exponential growth
Growth in which a quantity increases by a fixed percentage each period, so the amount added gets larger the bigger the quantity becomes.
Externality
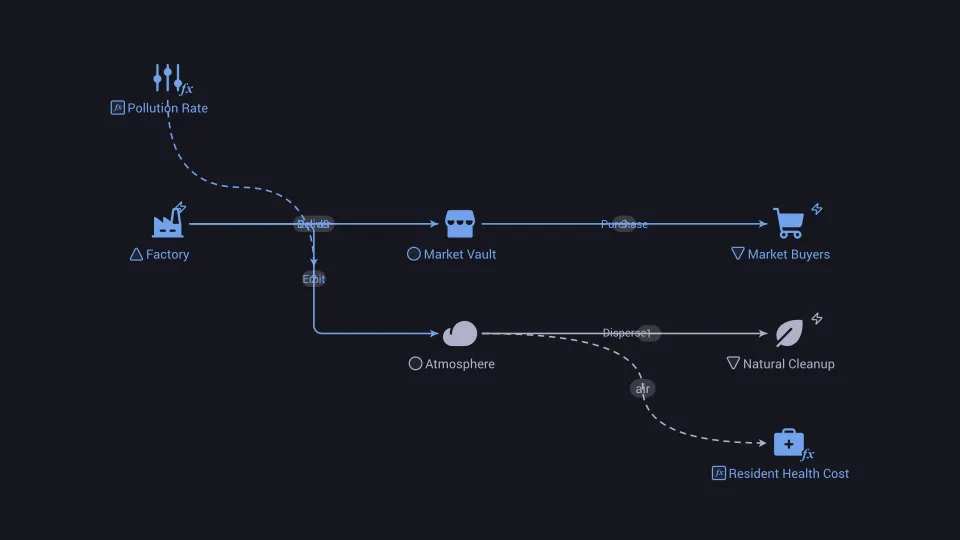
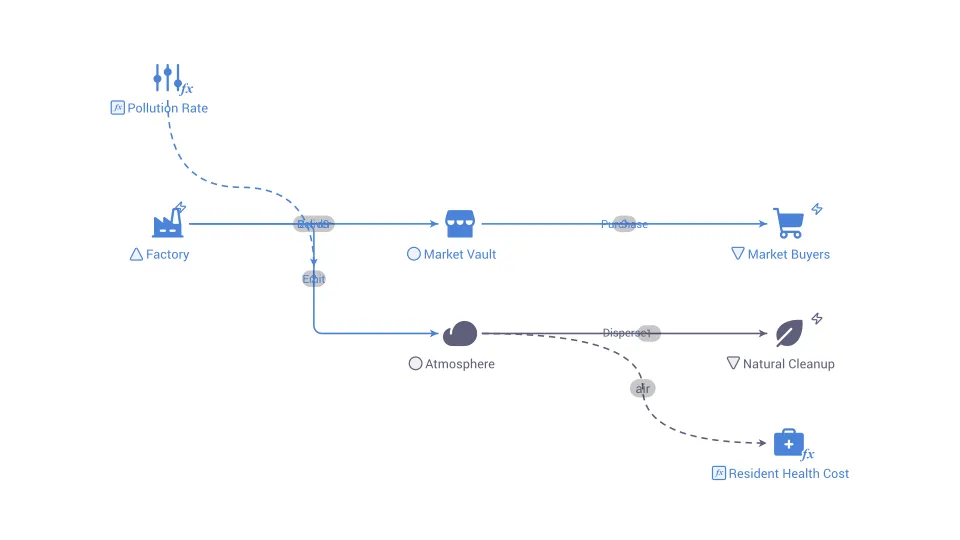
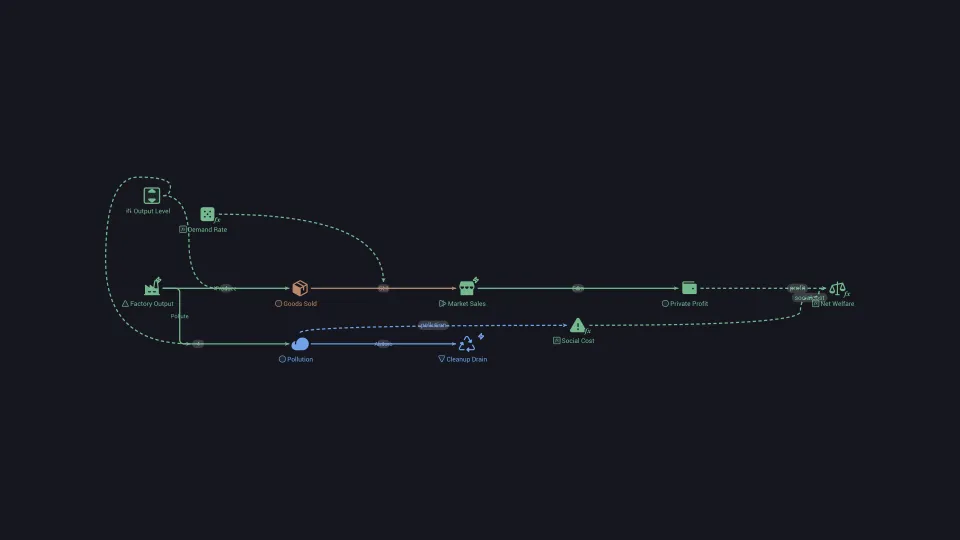
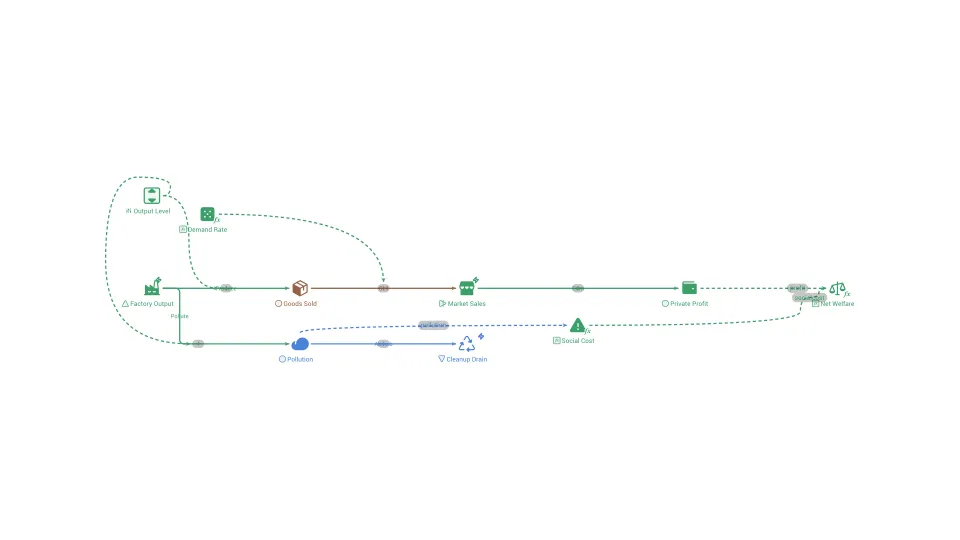
A cost or benefit that lands on people who had no part in the decision that caused it, and so is left out of the price.
Extrinsic motivation
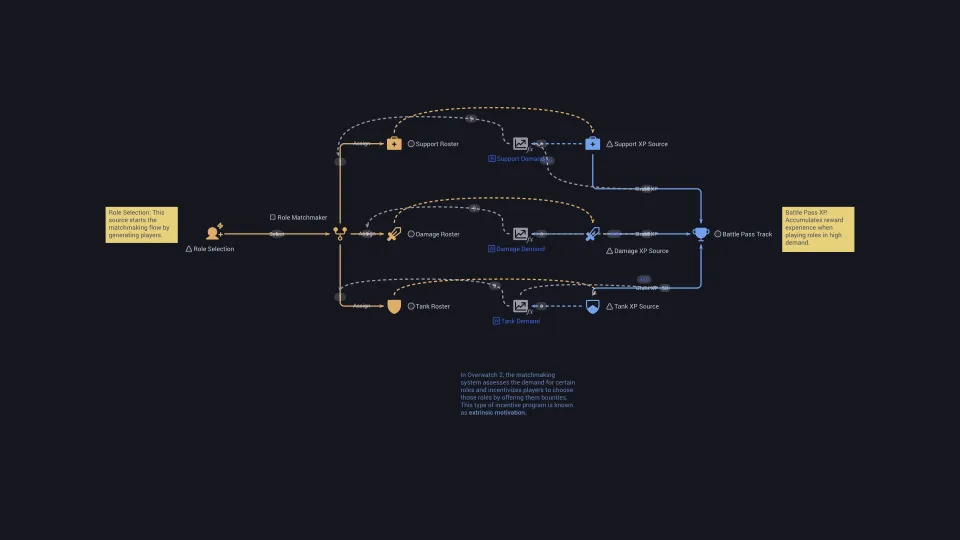
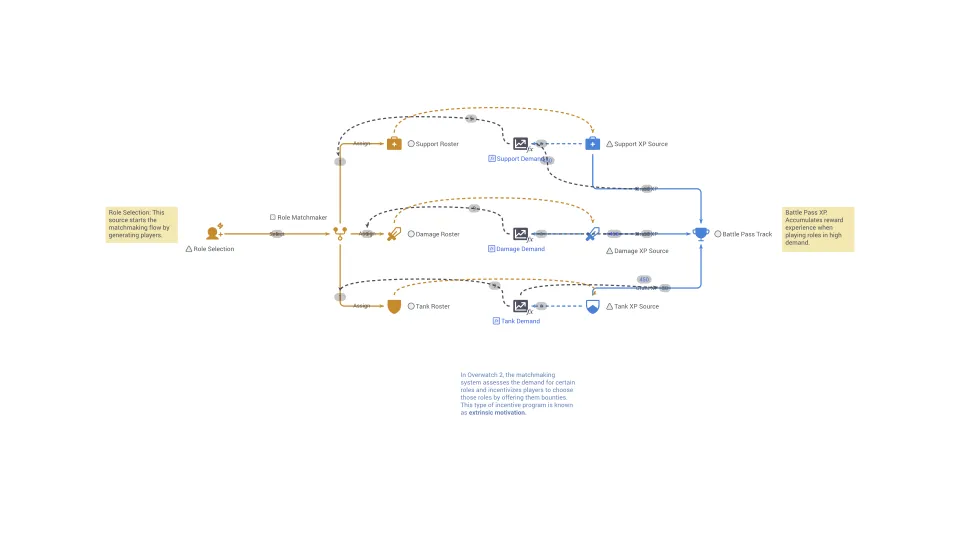
Motivation that comes from outside rewards or pressures, such as pay, praise or penalties, rather than from interest in the task itself.
Fairness
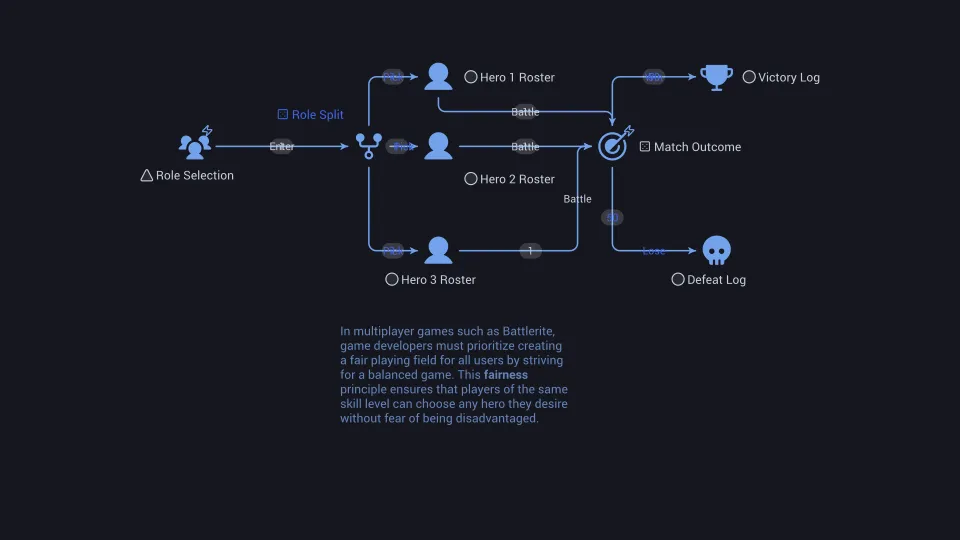
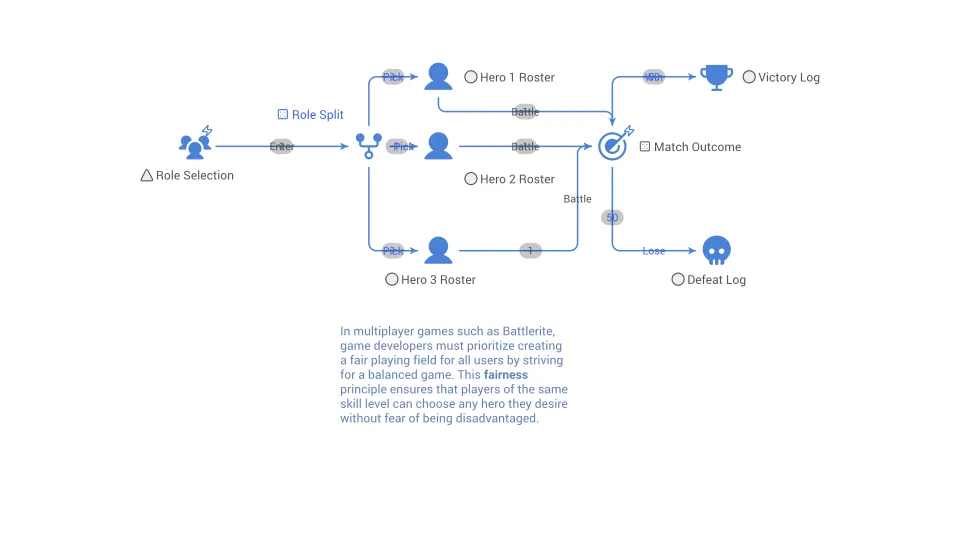
Fairness in game design refers to the principle of ensuring that all players have equal opportunities, access to resources, and chances of success.
Fixes that fail
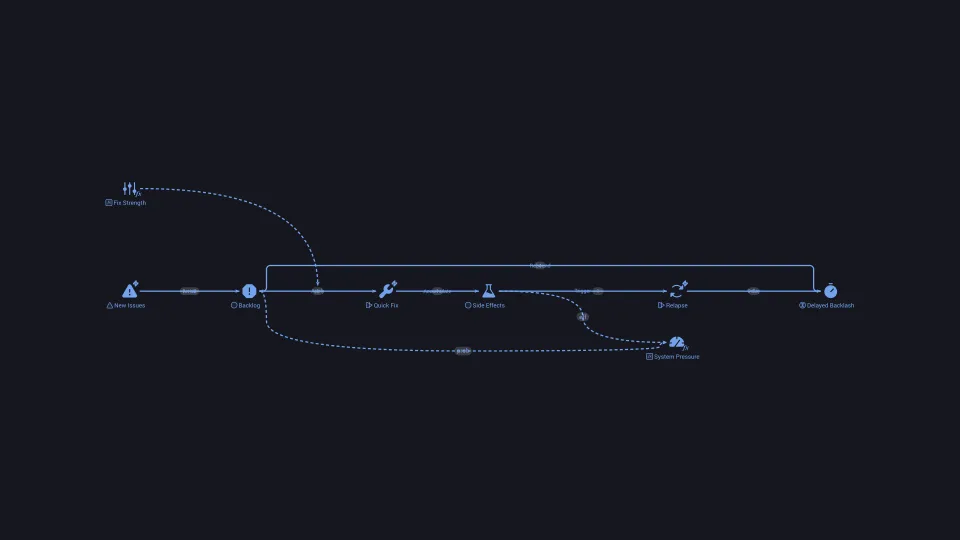
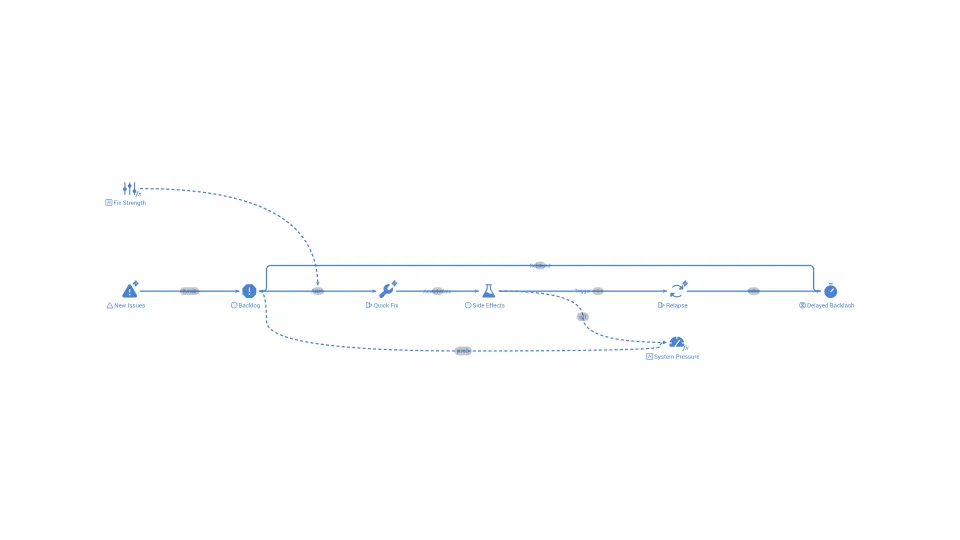
A pattern in which a quick fix solves a problem in the short term but causes side effects that bring the problem back, often worse.
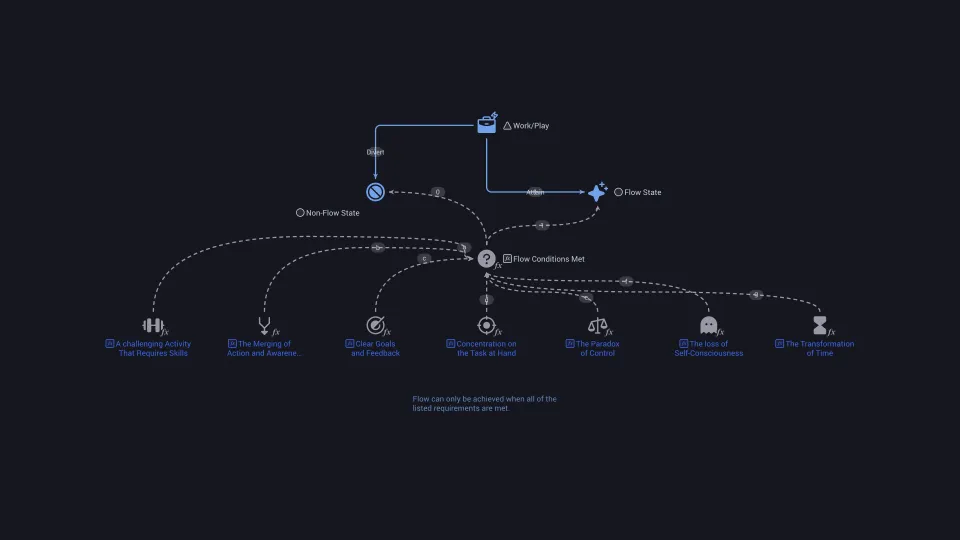
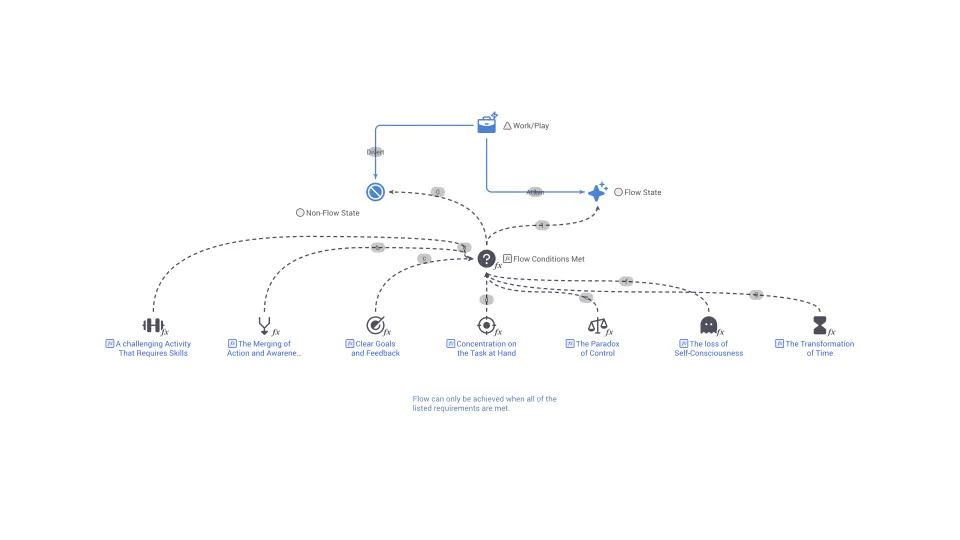
Flow
Flow refers to a state of optimal engagement and immersion experienced by players during gameplay.
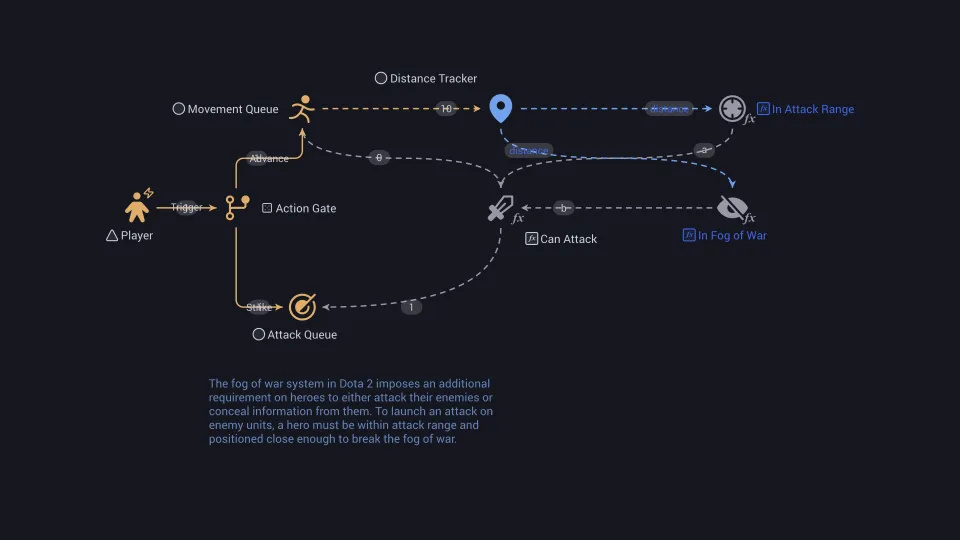
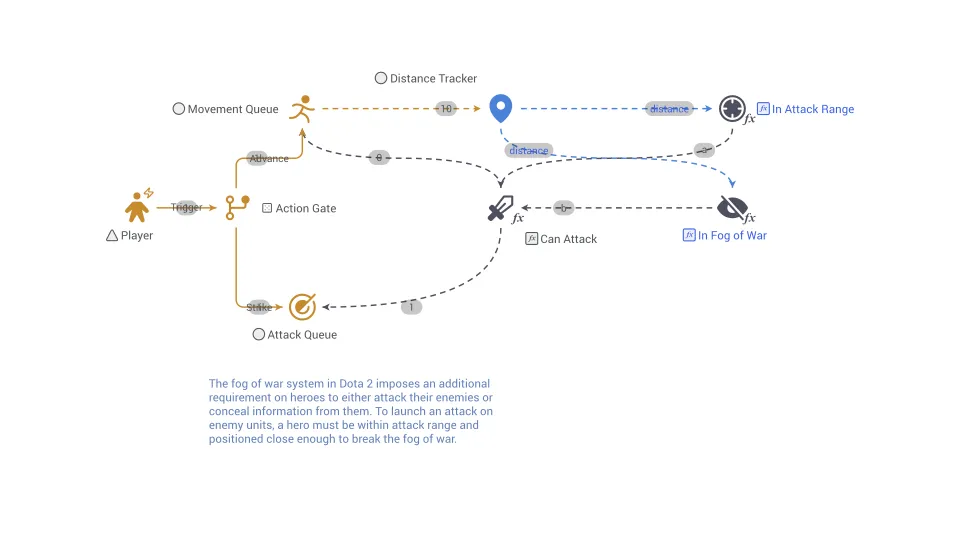
Fog of war
Fog of War is a gameplay mechanic commonly used in strategy or real-time strategy games to simulate limited knowledge or visibility of the game world.
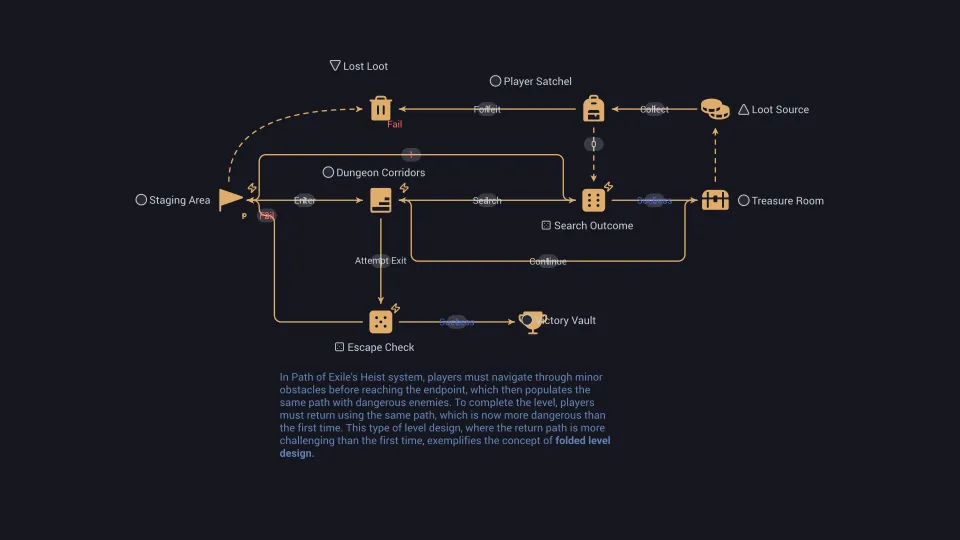
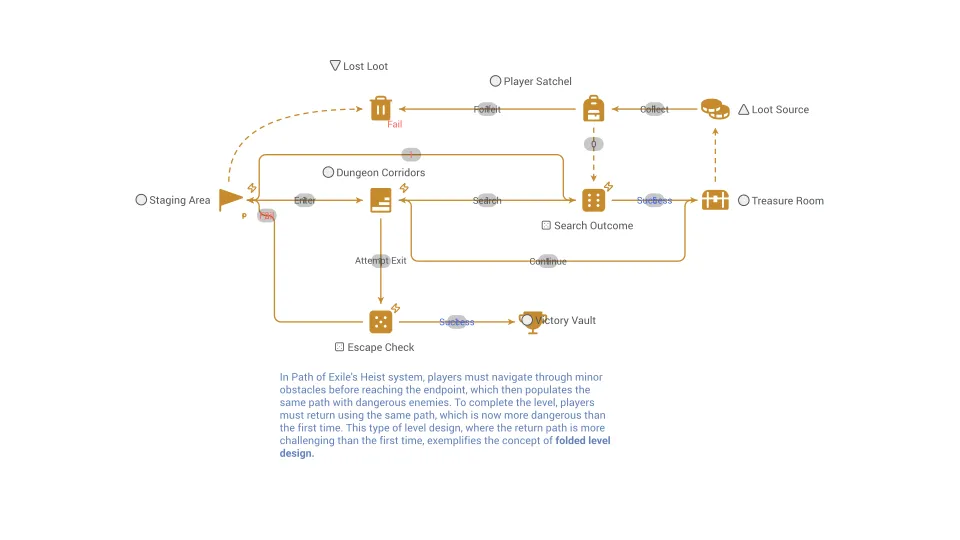
Folded level design
Folded level design interconnects game levels, creating shortcuts, hidden passages, and complex spatial configurations.
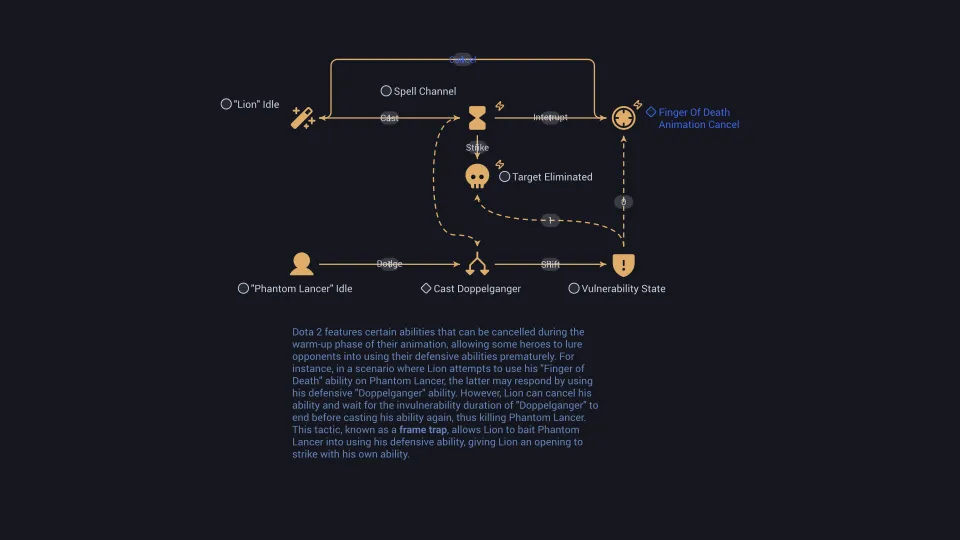
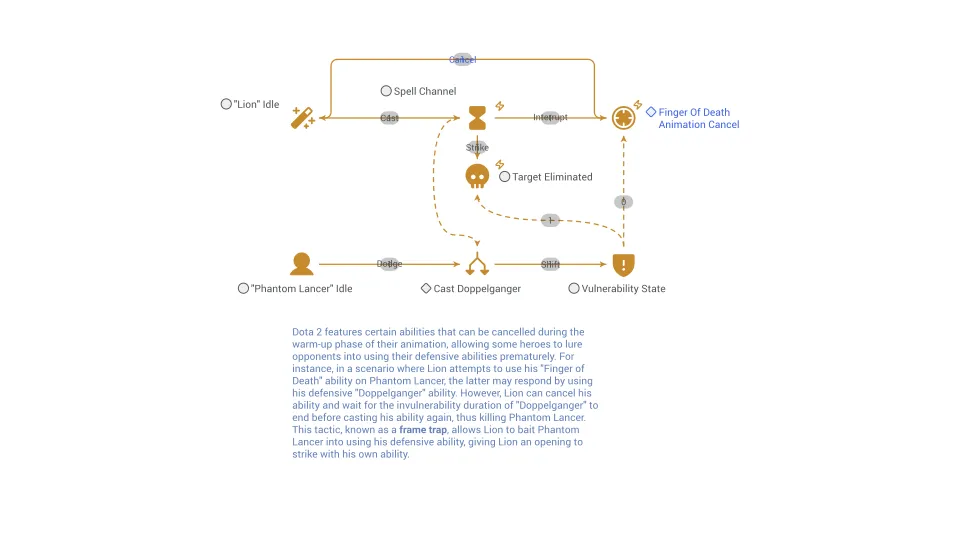
Frame trap
A Frame Trap in fighting games strategically limits opponent options through a deliberate sequence of attacks.
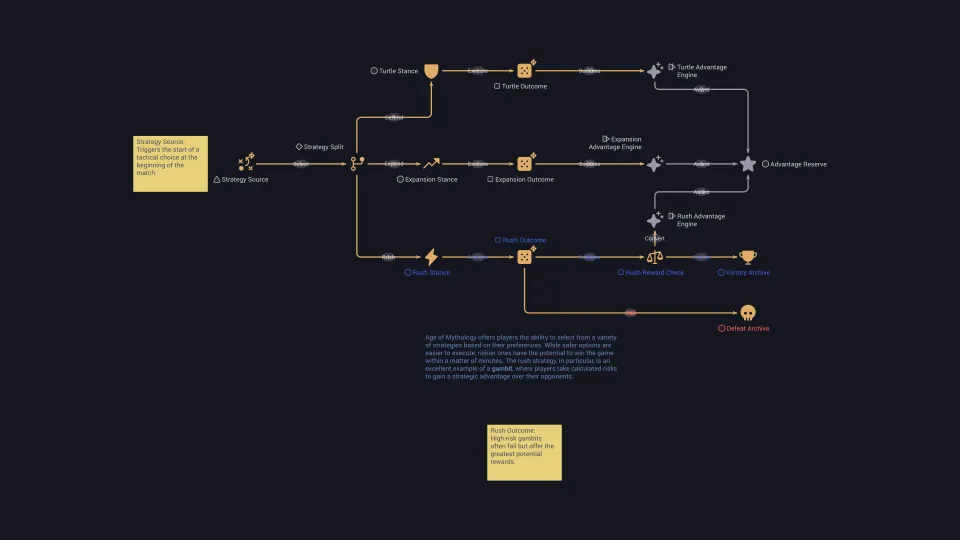
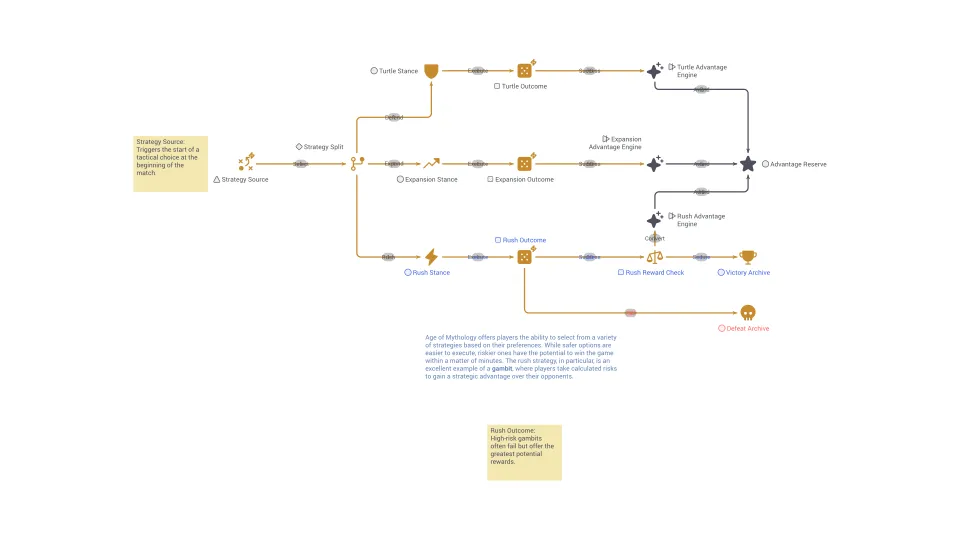
Gambit
A Gambit in game design refers to a strategic move or decision made by a player that involves a calculated risk in exchange for potential advantages.
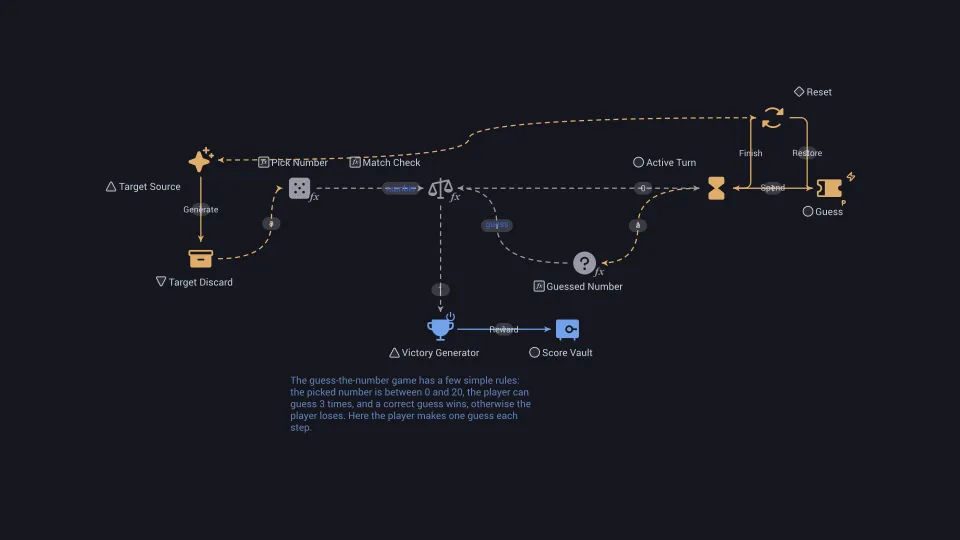
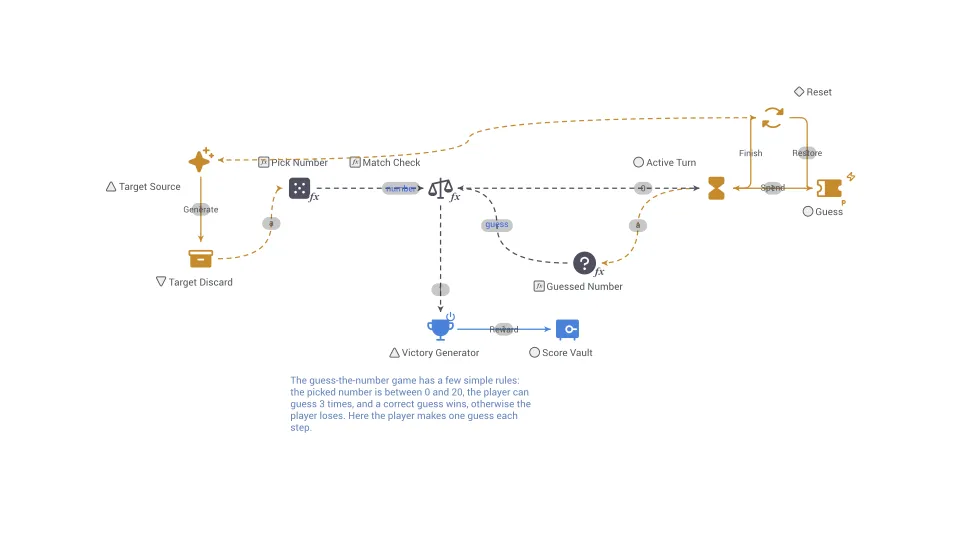
Game
A game is a ludic construct characterized by structured rules, objectives, and challenges, designed to facilitate interactive engagement and recreation.
Game theory
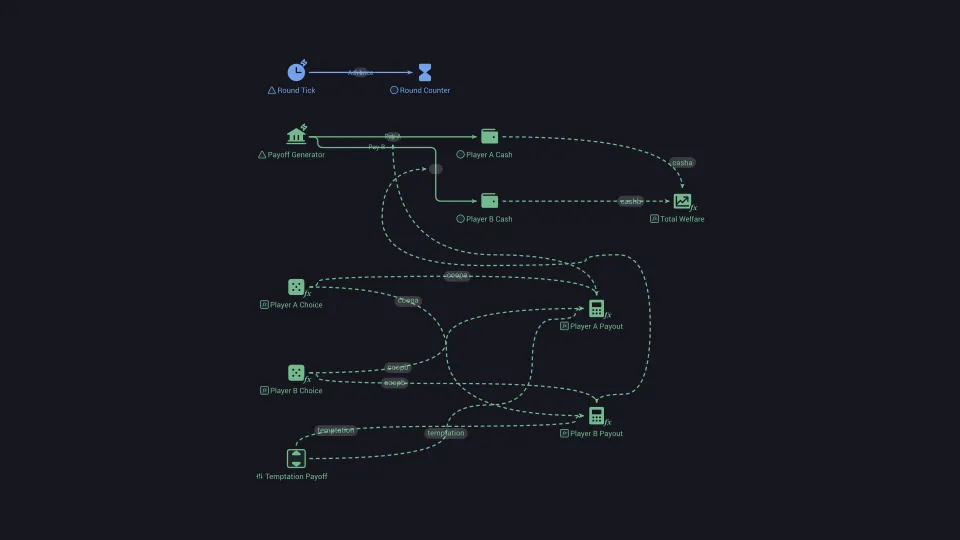
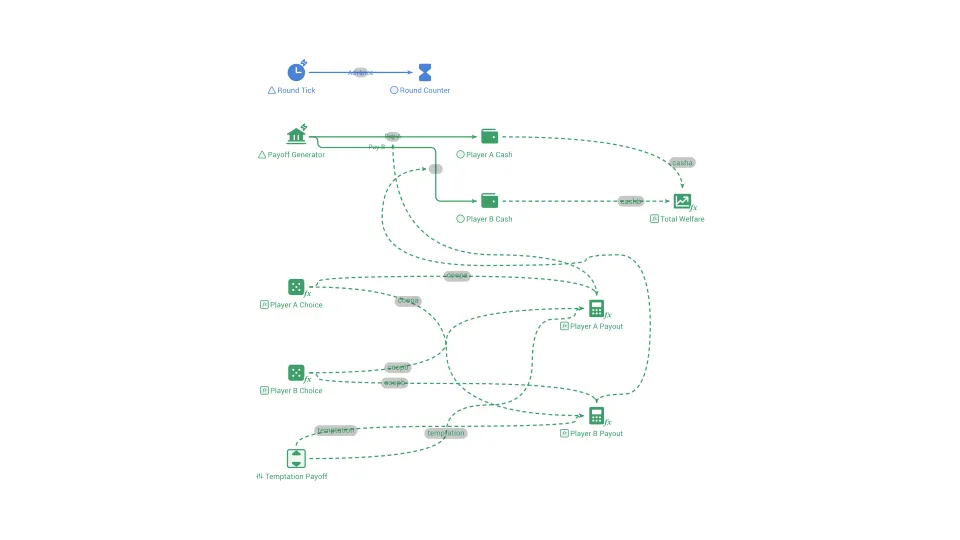
The study of how people or organizations choose when each one's best choice depends on what the others choose.
Goal
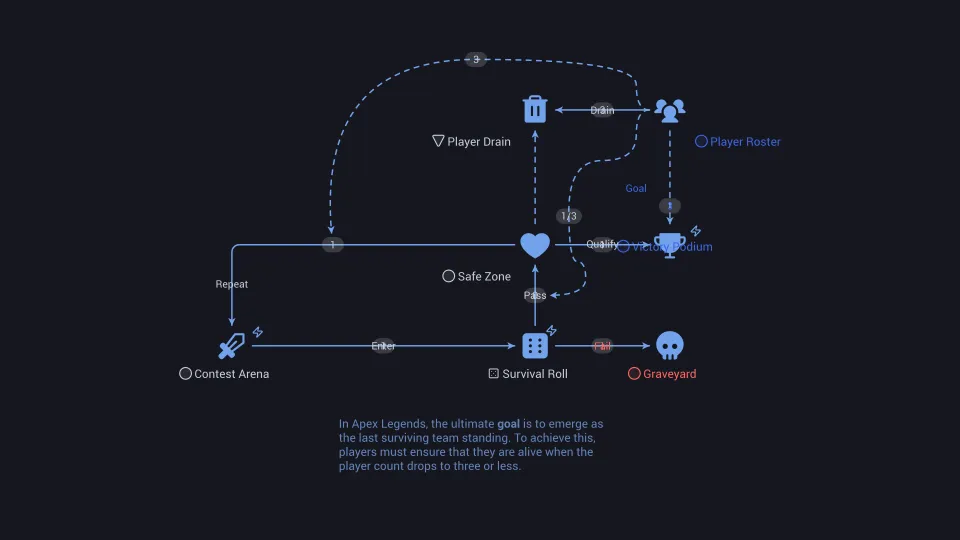
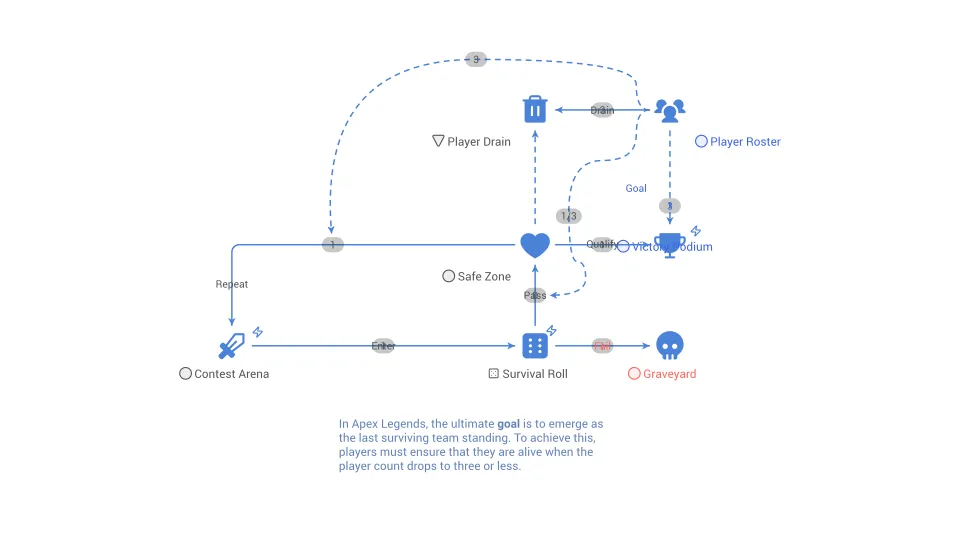
In game design, a goal refers to an objective or target that players strive to achieve within a game.
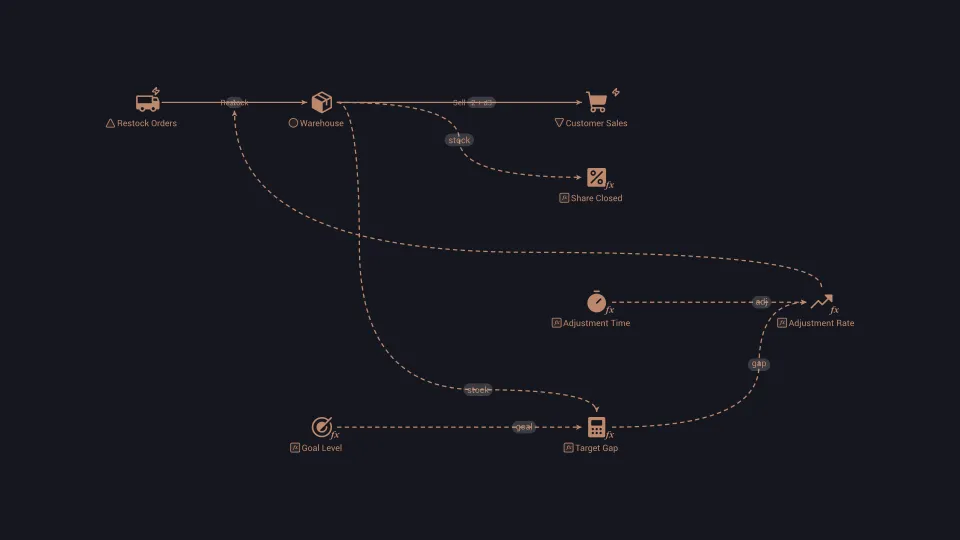
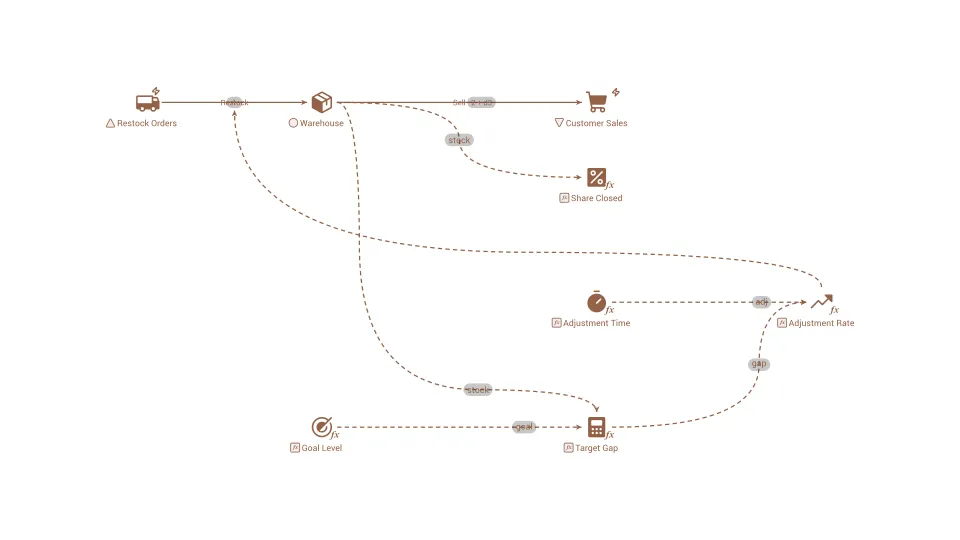
Goal-seeking behavior
Behavior in which a quantity moves toward a target and slows as it gets close, driven by a loop that works to close the gap.
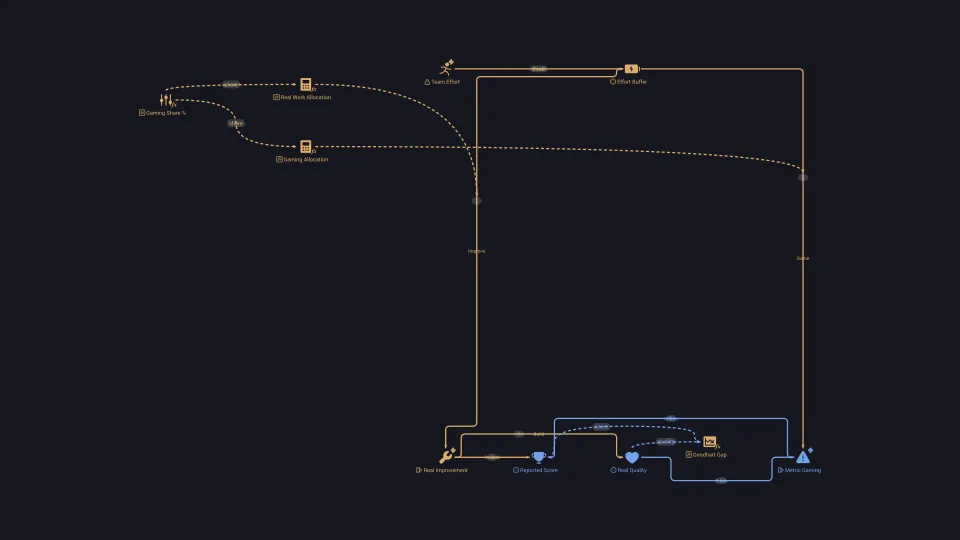
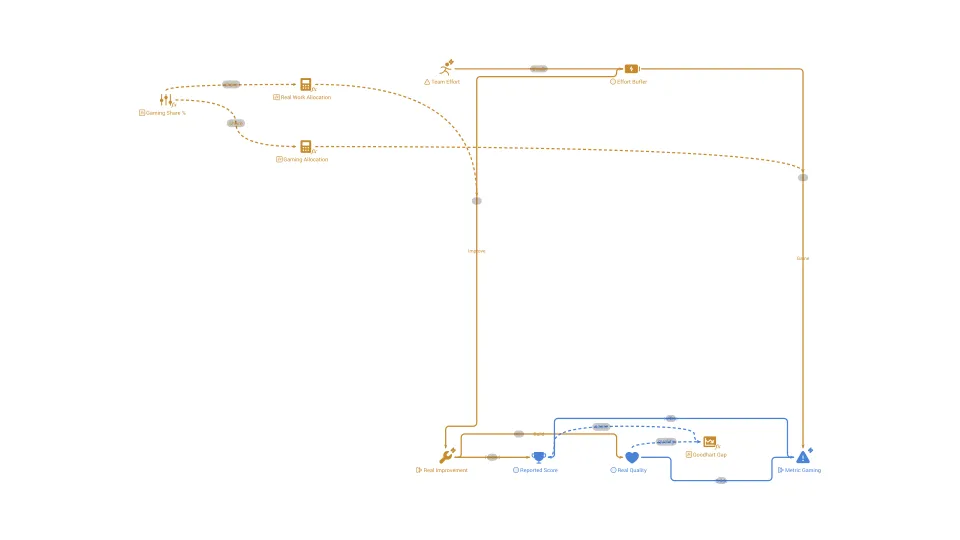
Goodhart's law
The warning that once a measure is turned into a target that people are judged on, it stops being a reliable measure.
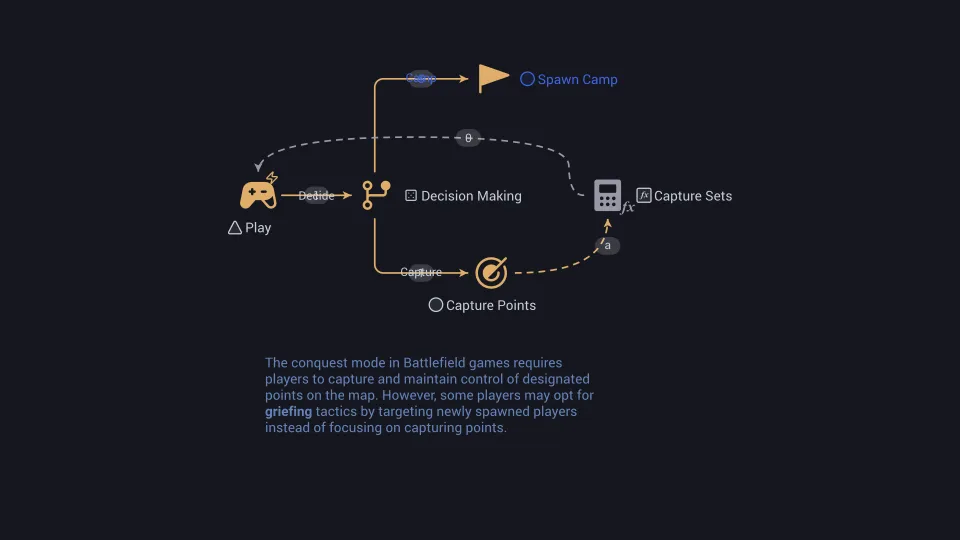
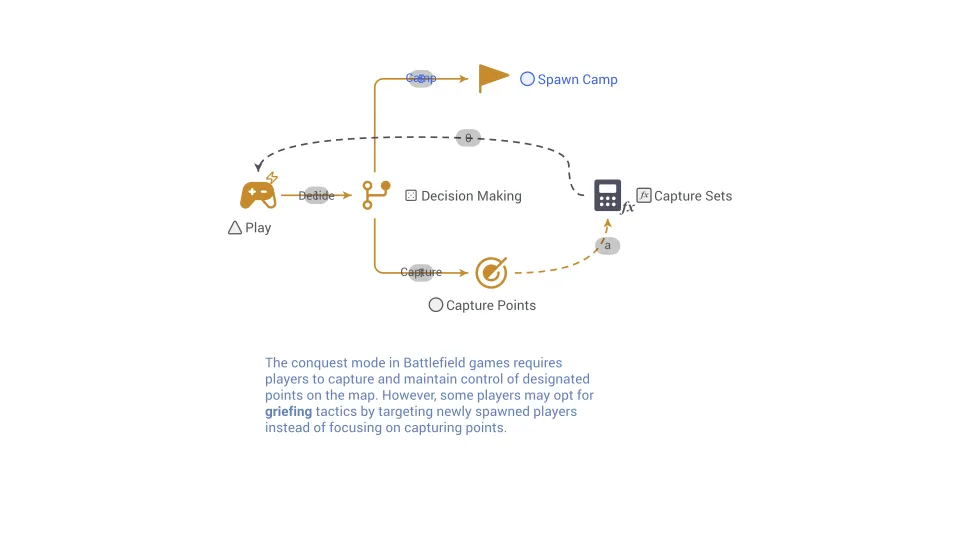
Griefing
In multiplayer games, griefing is disruptive or malicious behavior by one player, often for amusement or to intentionally disrupt the gameplay.
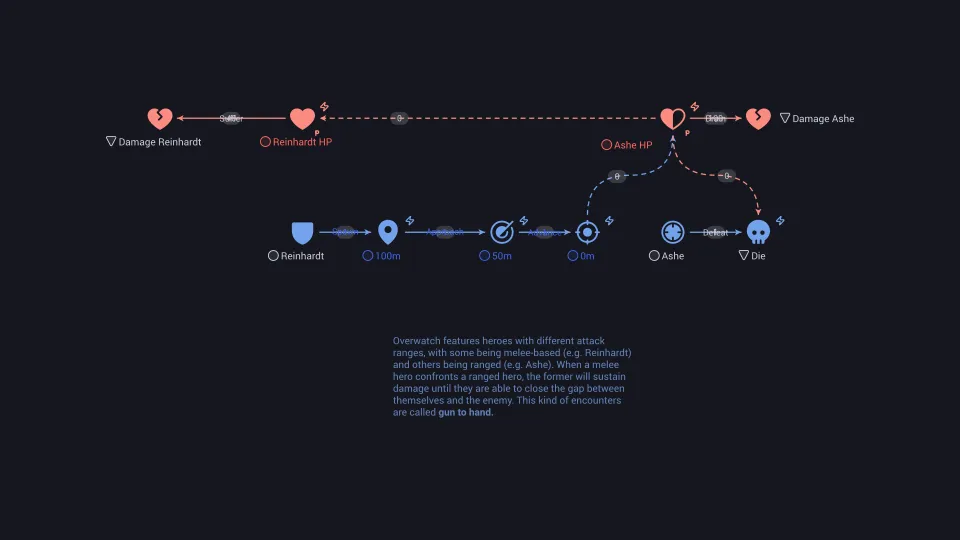
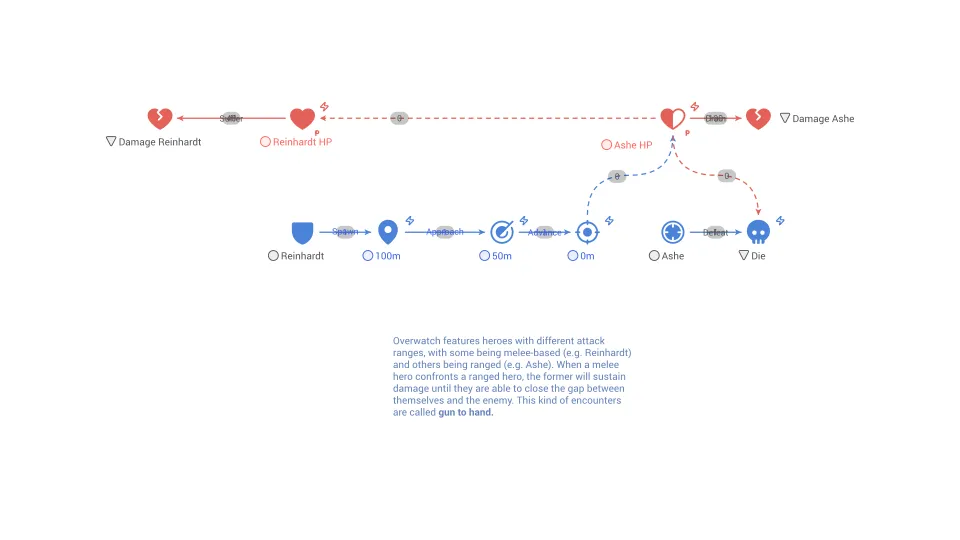
Gun-To-Hand
Gun-to-Hand refers to a dynamic where a player equipped with ranged weaponry holds a distinct advantage over a player relying on melee combat.
Hand-To-Hand (combat)
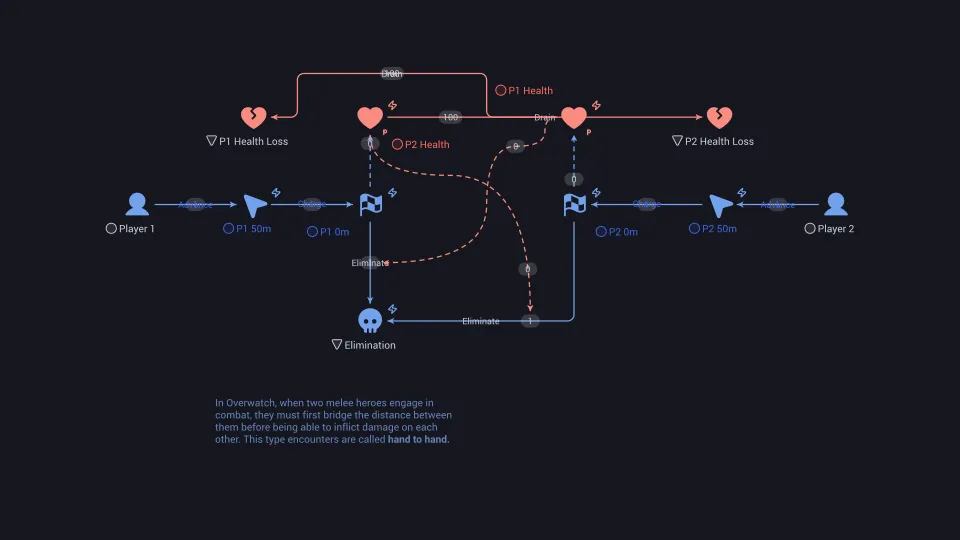
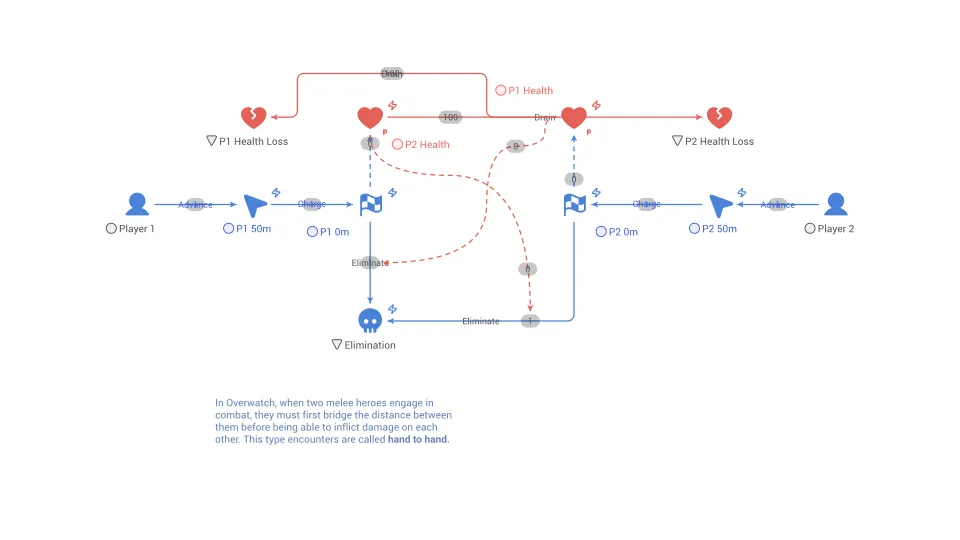
Hand-To-Hand combat refers to a combat or fighting within a game where players engage in physical combat.without the use of ranged weapons or firearms.
House edge
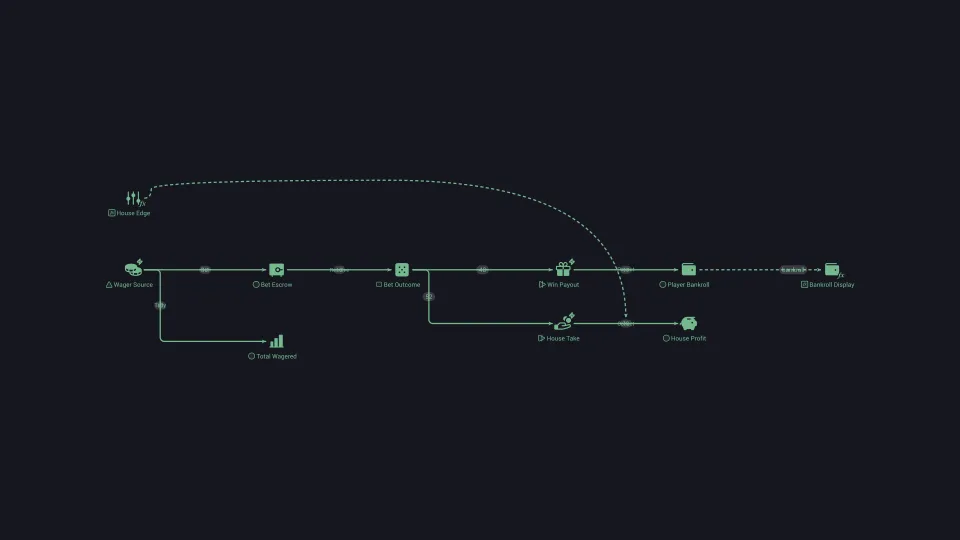
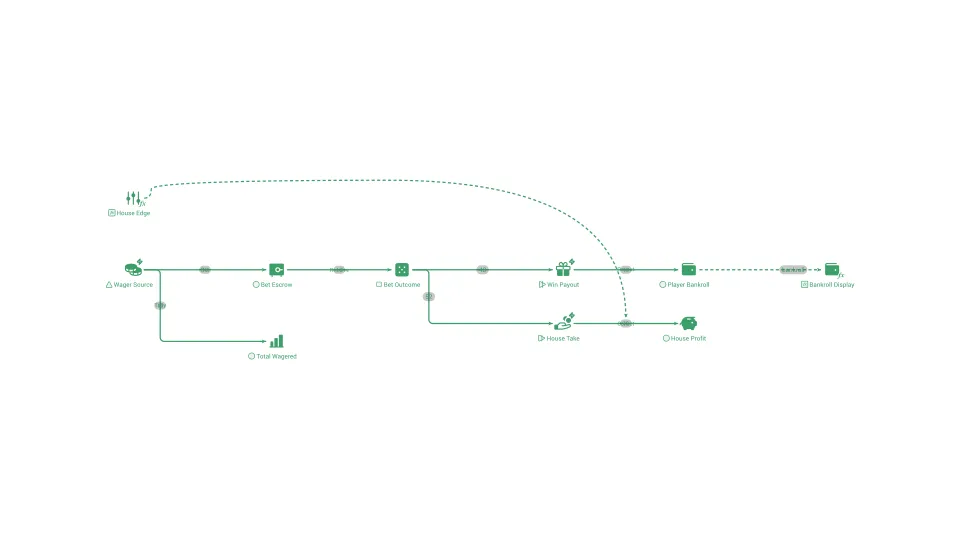
The built-in percentage of each wager that the operator expects to keep over the long run, set by the odds of the game.
Incentive
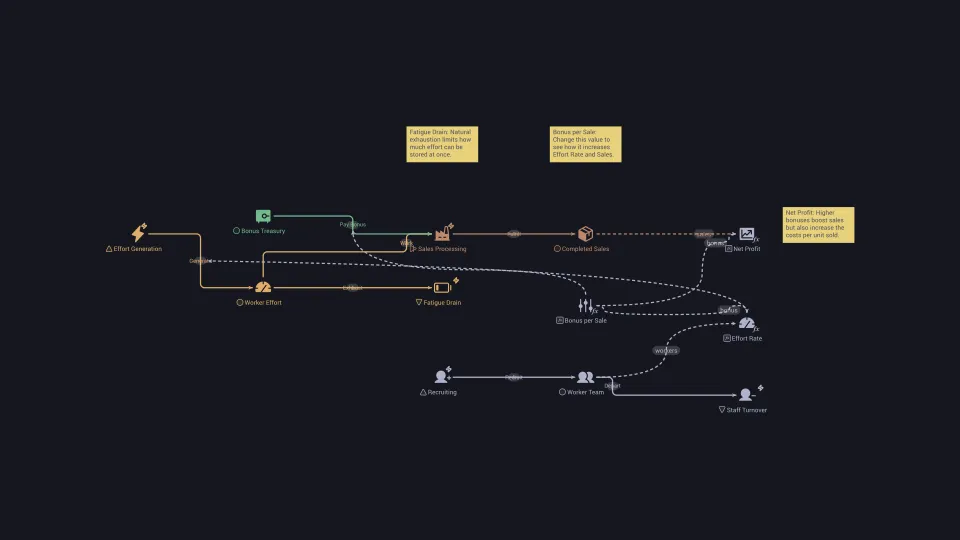
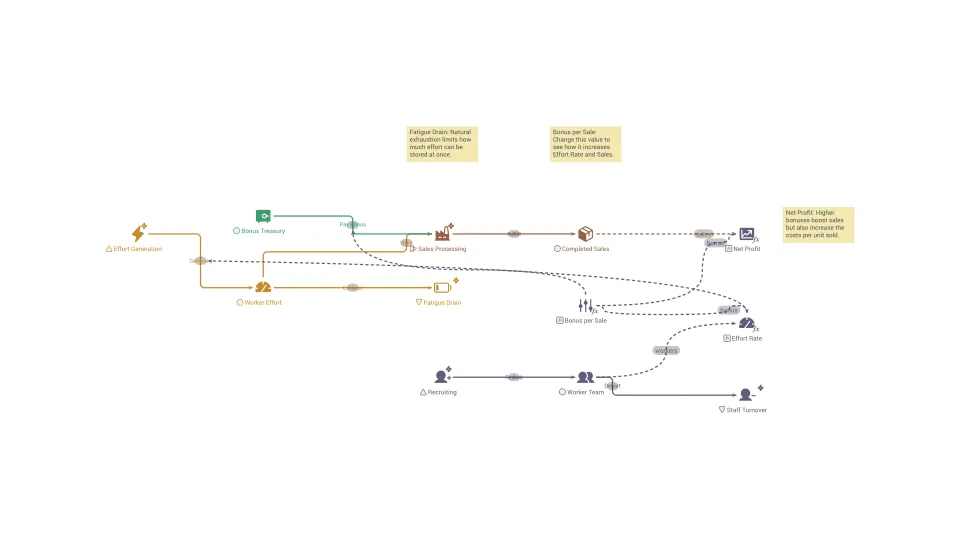
A reward or penalty that makes one choice more attractive than another and so shapes what people do.
Income elasticity of demand
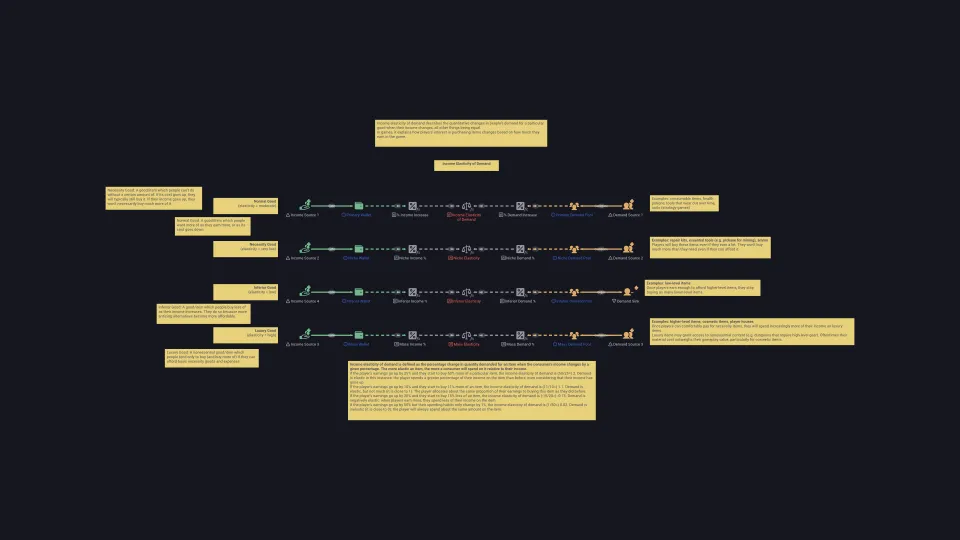
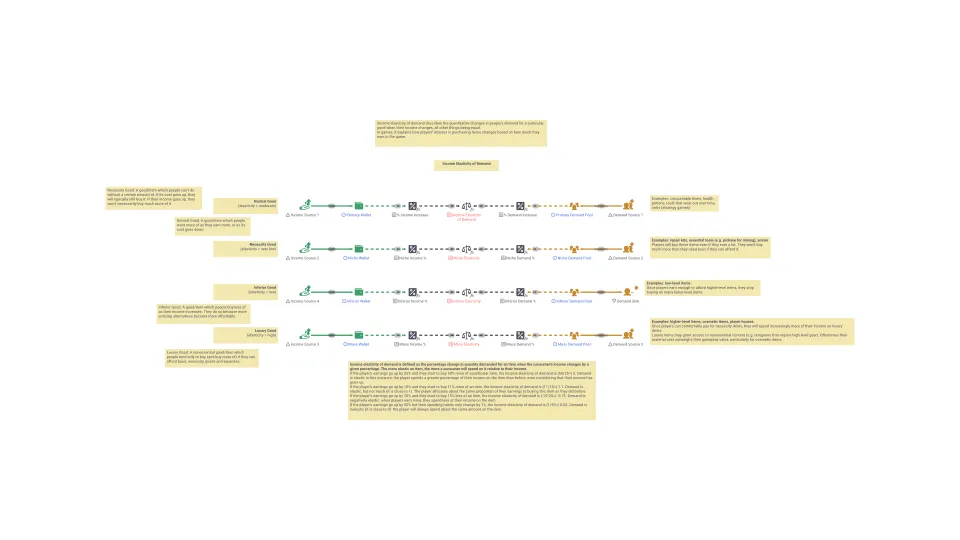
A measure of how much the quantity demanded of a good changes when consumer income changes by one percent.
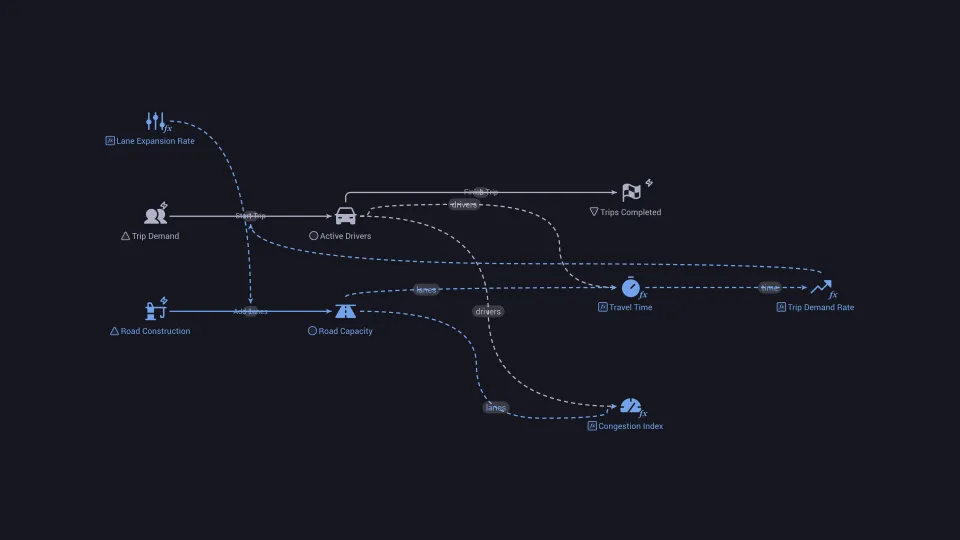
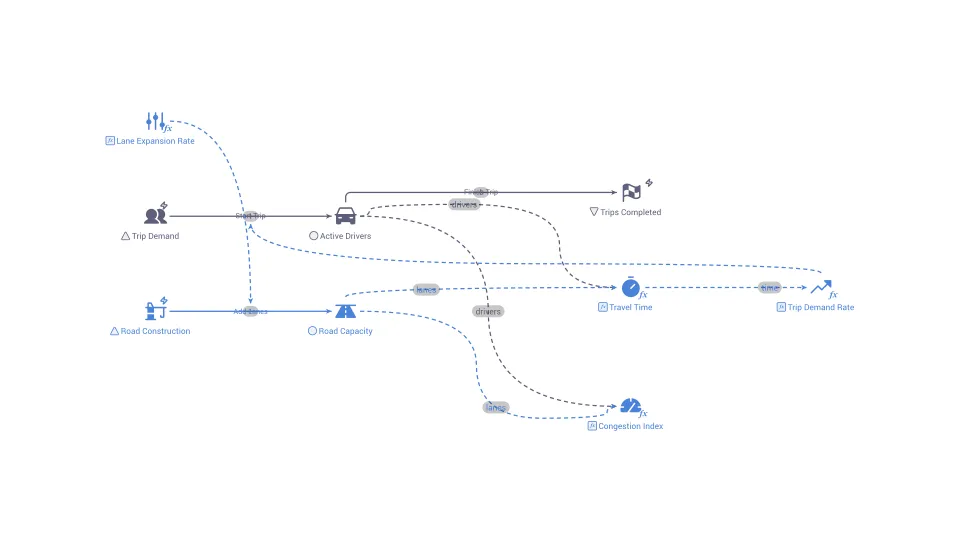
Induced demand
The increase in use that follows when more capacity is added to a service, so that the new capacity fills up.
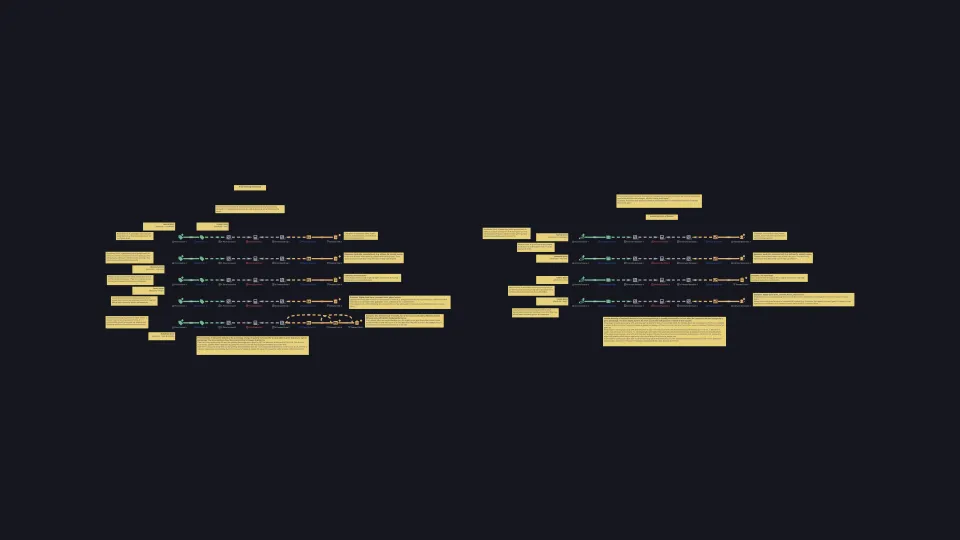
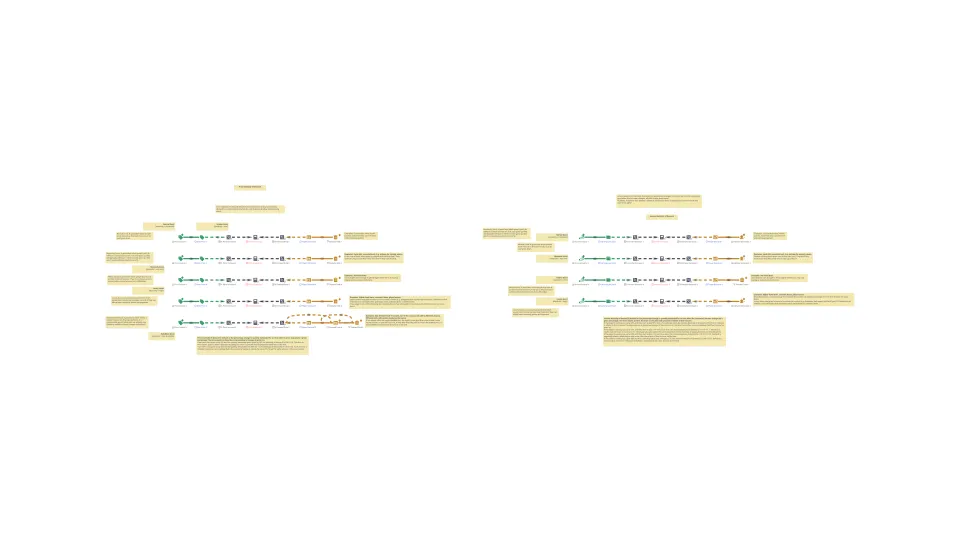
Inferior good
A good whose demand falls when consumer income rises, because buyers switch to a better alternative once they can afford it.
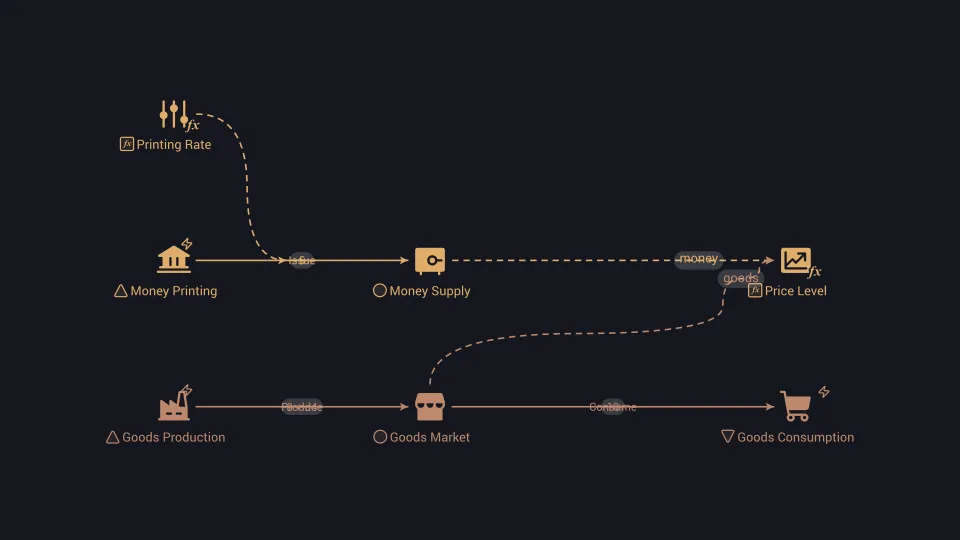
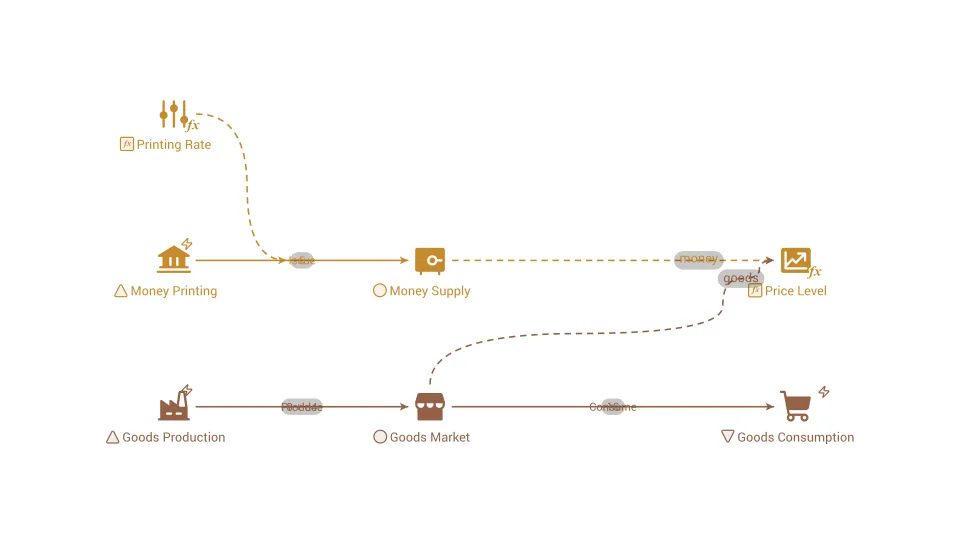
Inflation
A general, sustained rise in prices over time, which means each unit of money buys less than it did before.
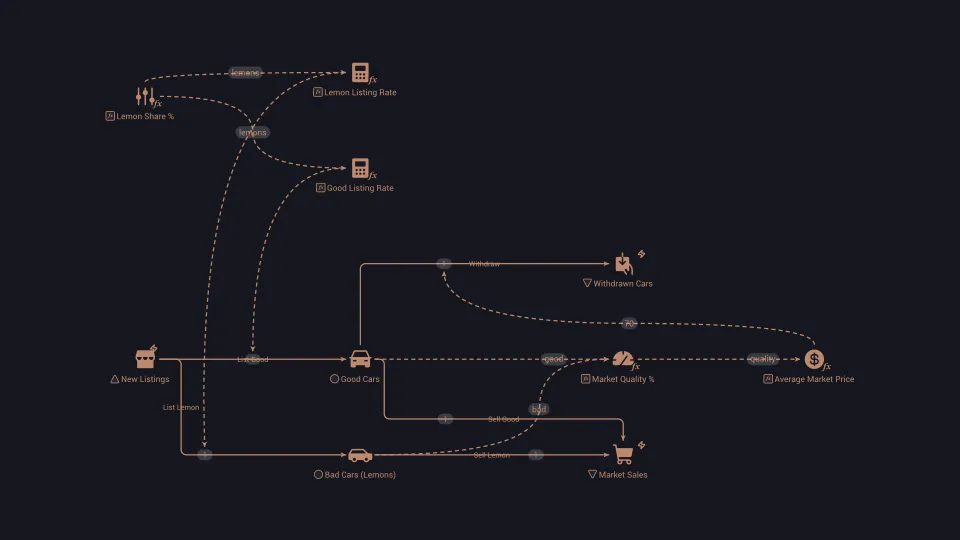
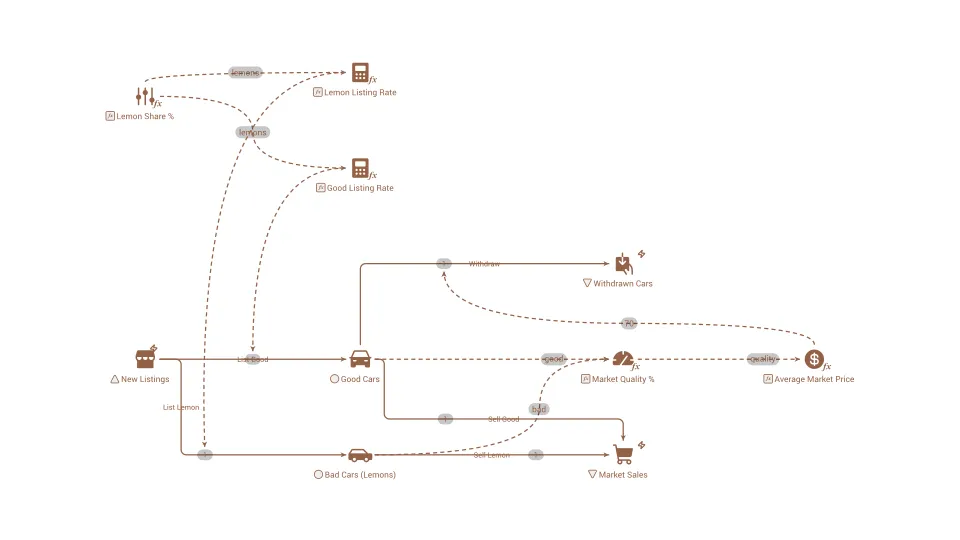
Information asymmetry
A situation where one side of a deal knows more than the other, which can lead to worse choices and missing trades.
Information delay
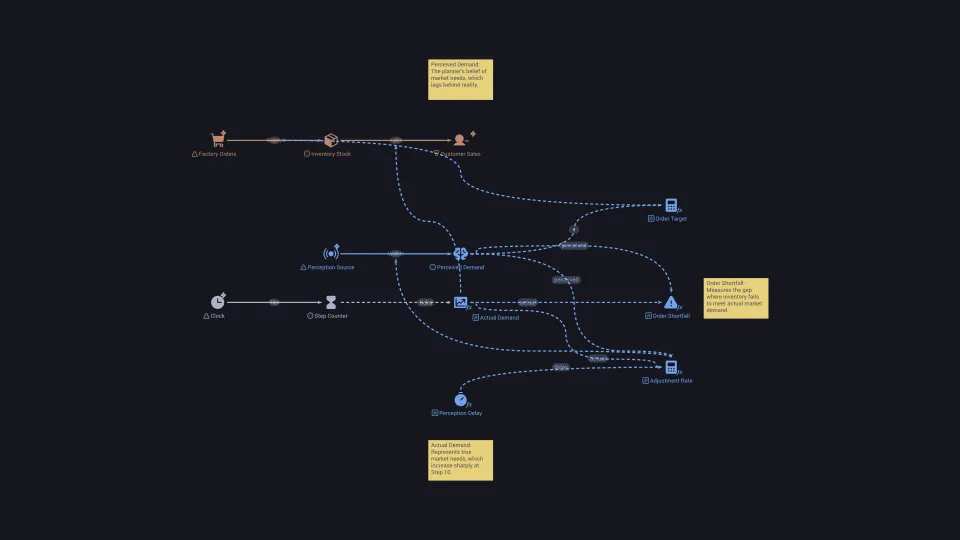
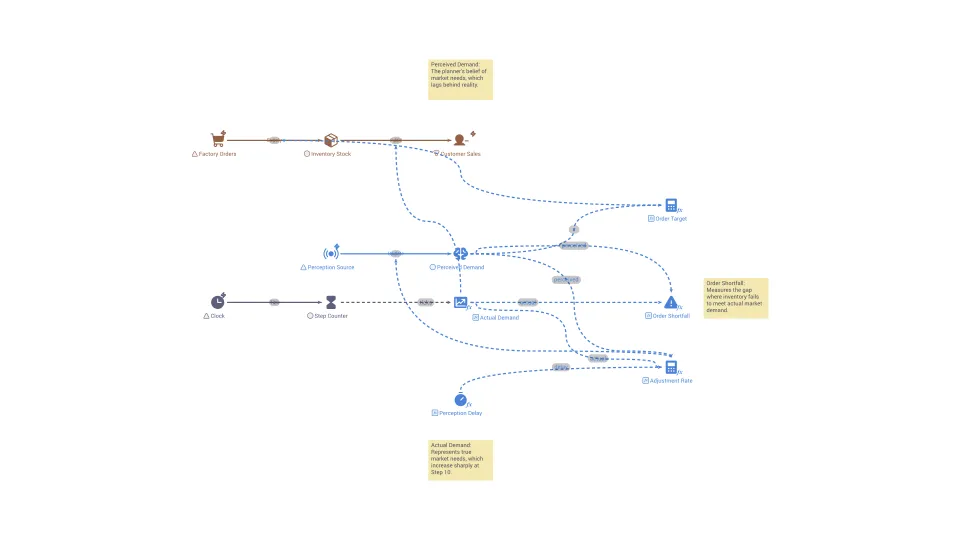
The time it takes for a change in the real situation to be measured, reported, and believed by the people who make decisions.
Interesting choices
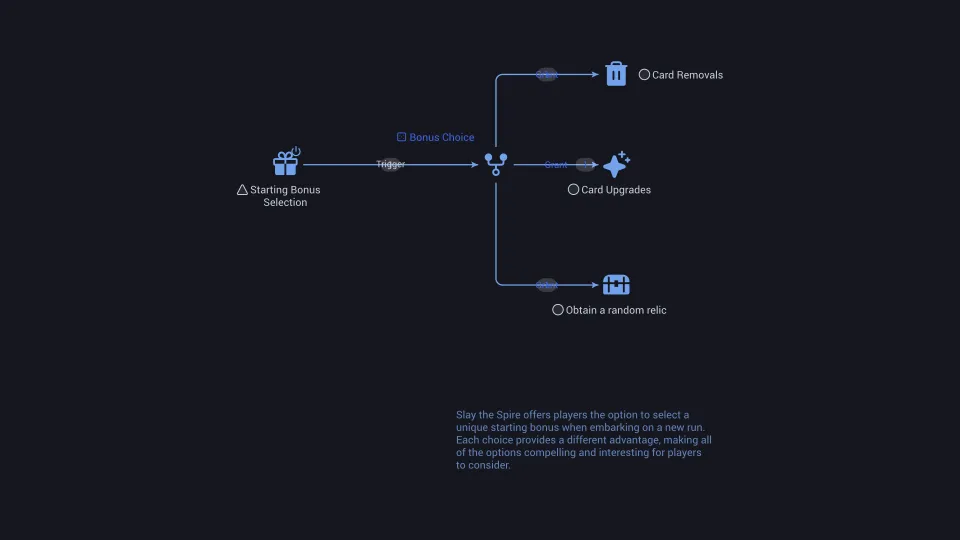
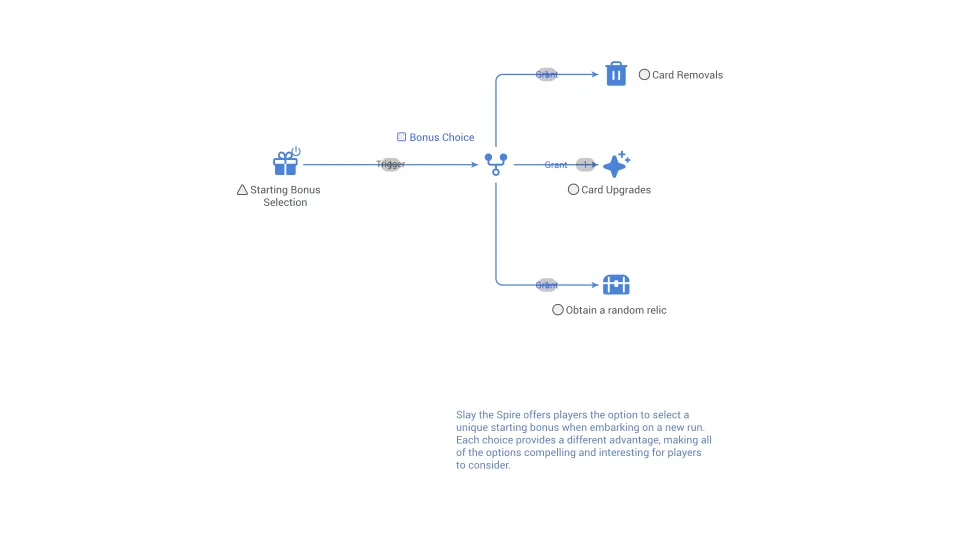
In game design, interesting choices refer to the options presented to players that have meaningful and consequential outcomes within the game.
Intermittency
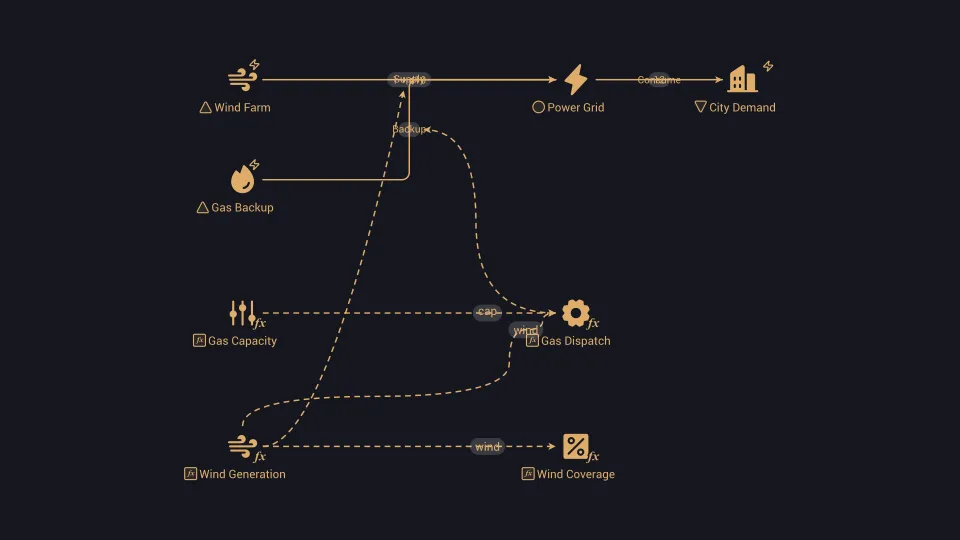
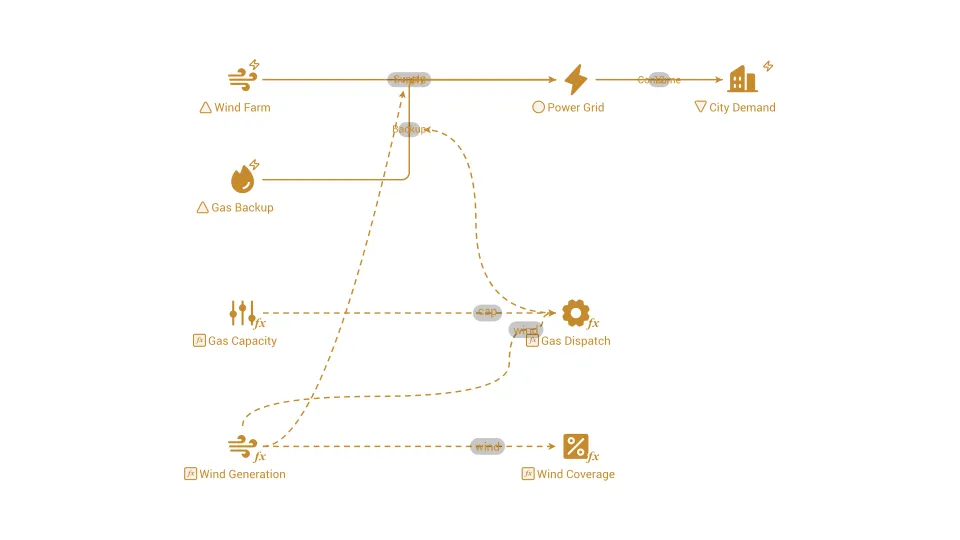
The tendency of a power source, such as wind or solar, to vary its output with the weather and the time of day.
Interplay
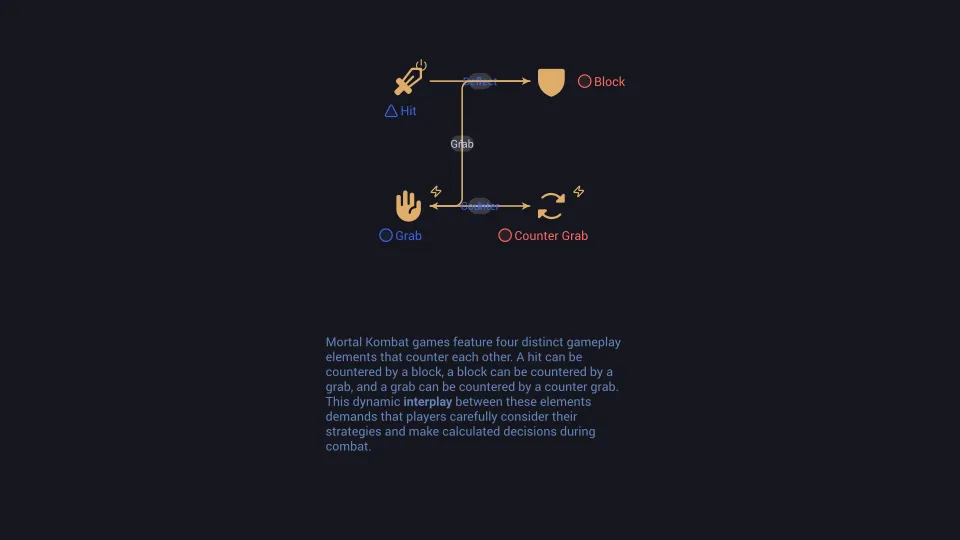
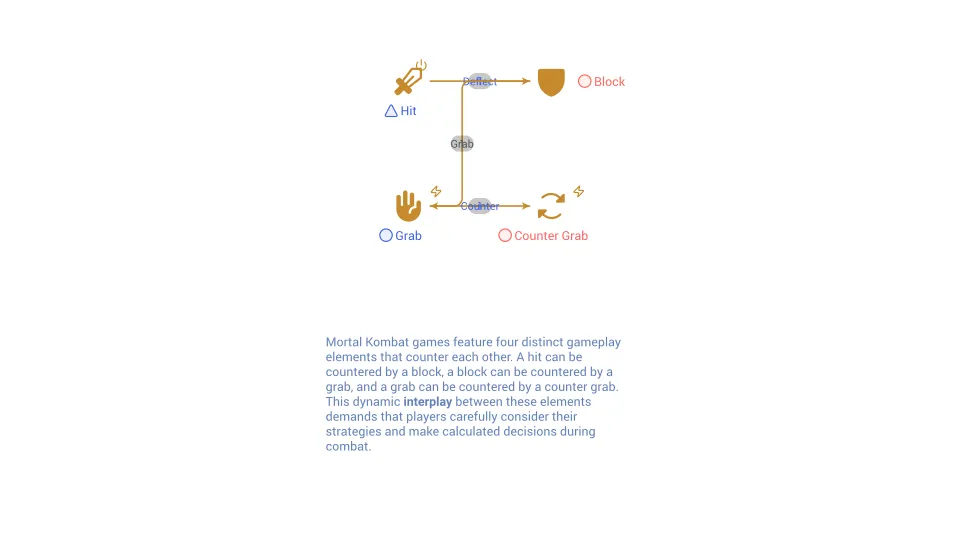
Interplay in game design refers to the dynamic interaction and relationship between gameplay elements, mechanics, systems, or components within a game.
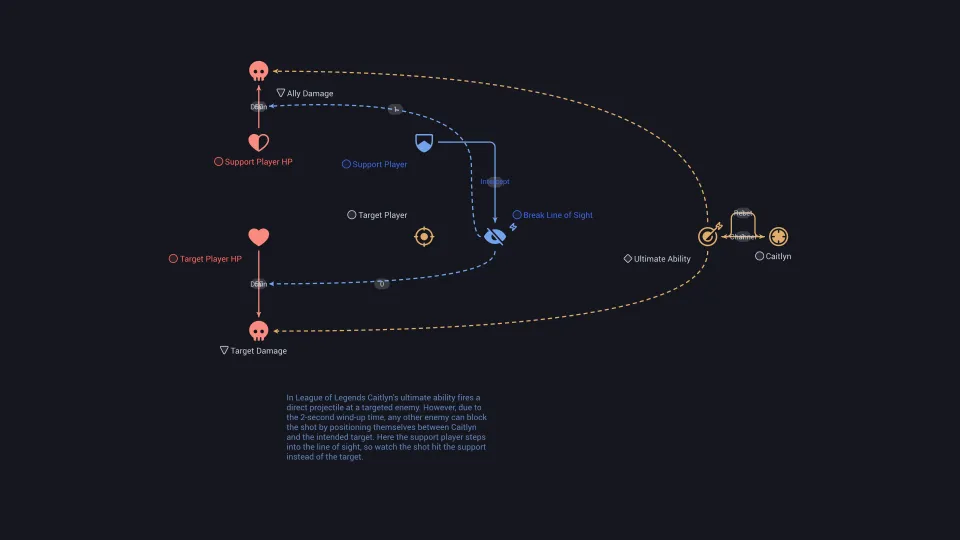
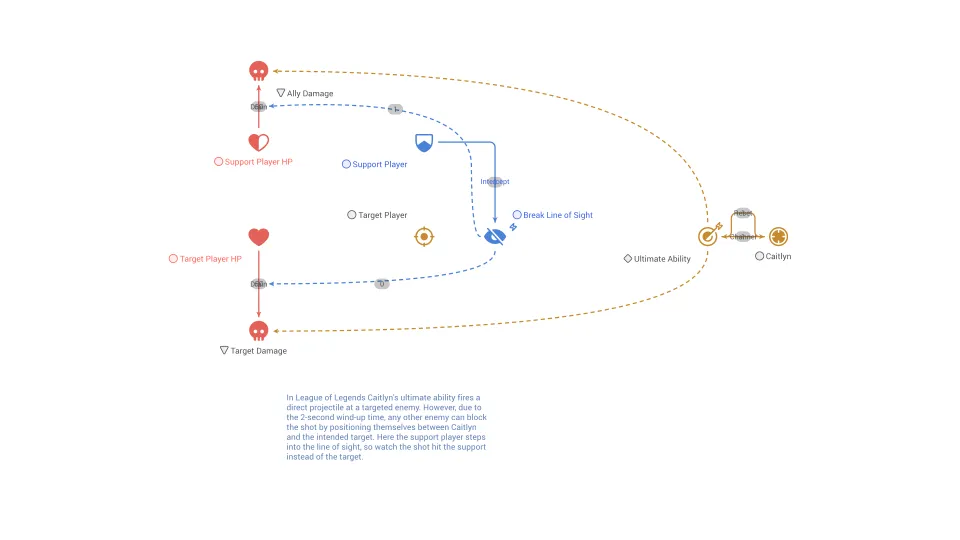
Interposition
Interposition is a game design term that refers to the placement or positioning of game elements, objects, or characters in relation to each other.
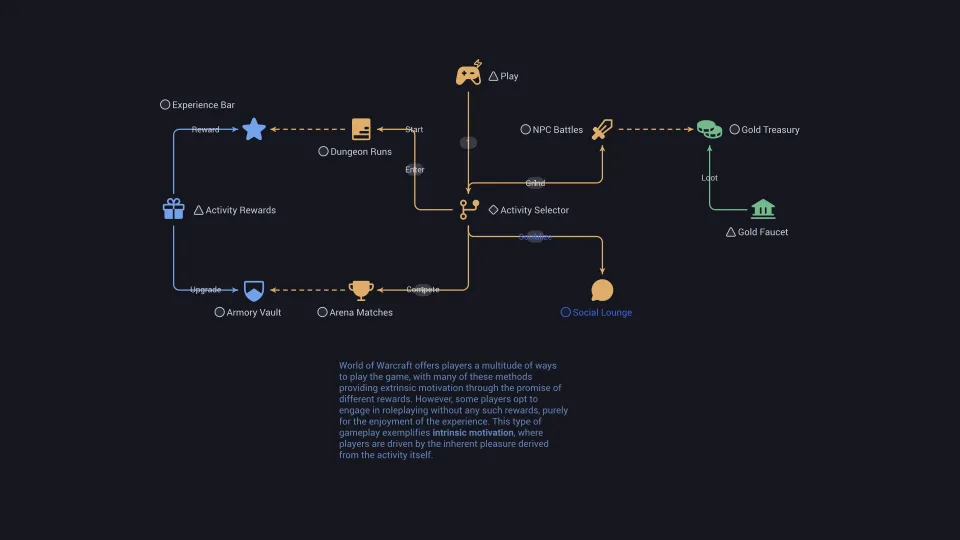
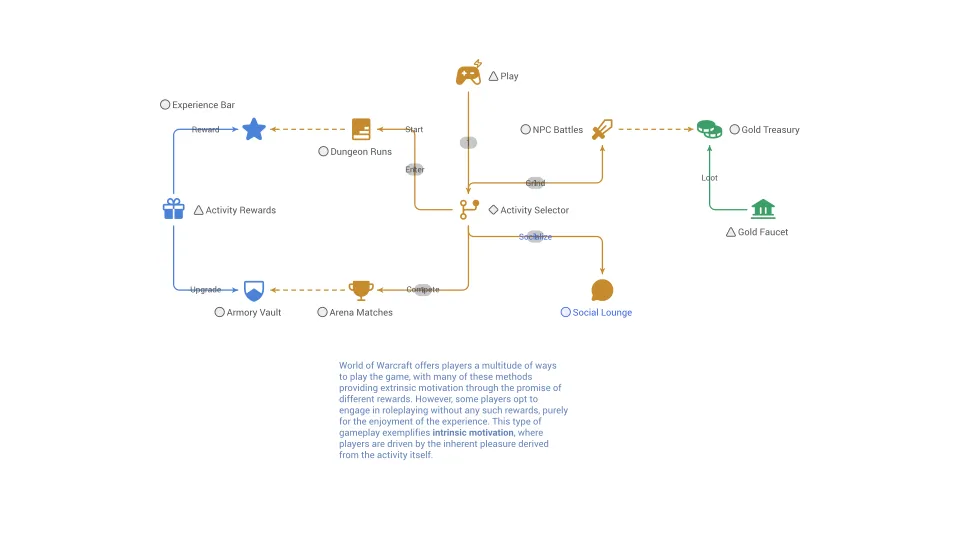
Intrinsic motivation
Motivation that comes from interest, enjoyment or a sense of purpose in the activity itself, not from outside rewards.
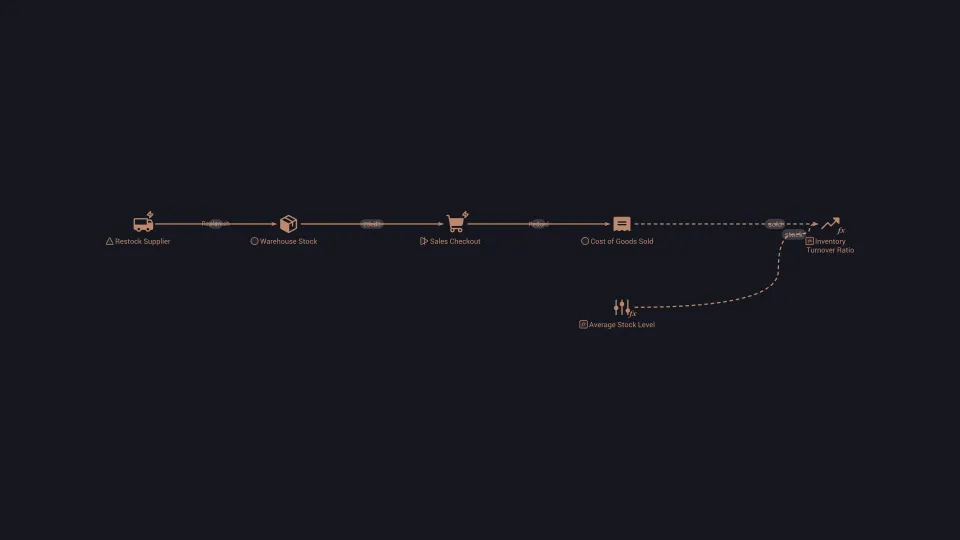
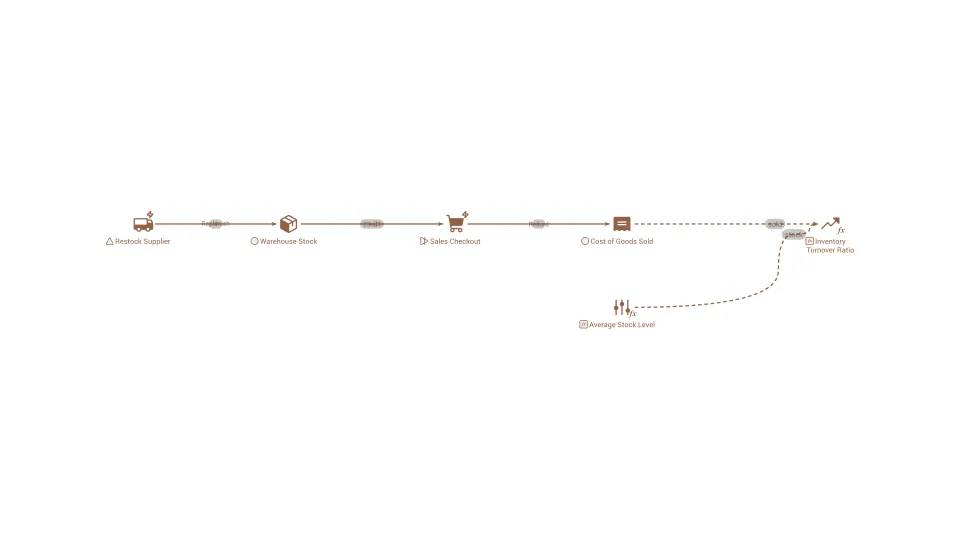
Inventory turnover
How many times a business sells and replaces its average stock in a year, showing how efficiently inventory is used.
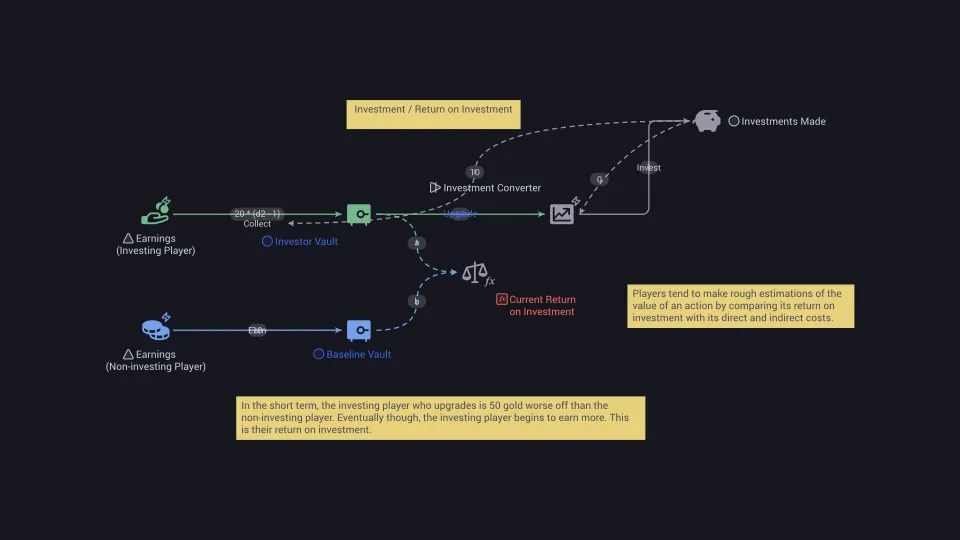
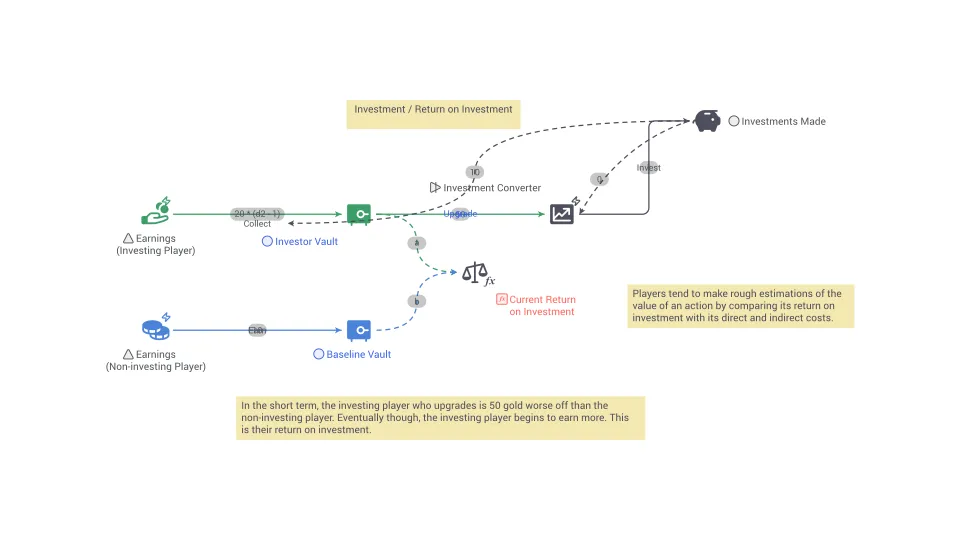
Investment
Putting resources into something today in the expectation of a larger return in the future, accepting risk and giving up present use.
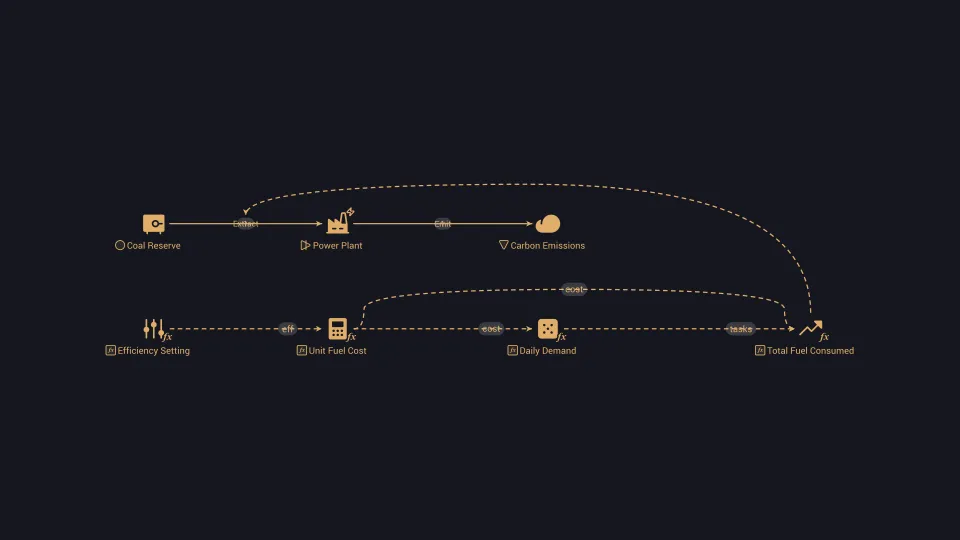
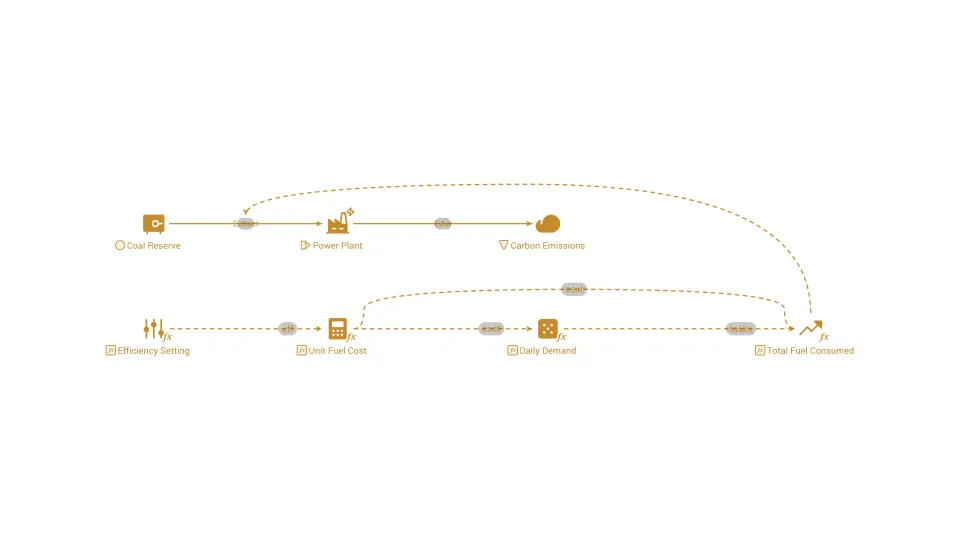
Jevons paradox
The finding that making a resource cheaper to use can lead people to use more of it in total.
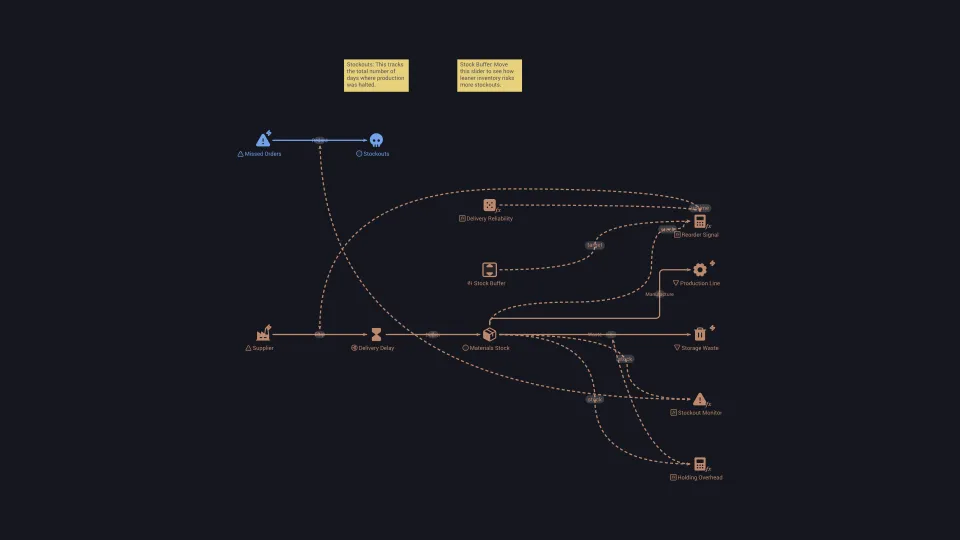
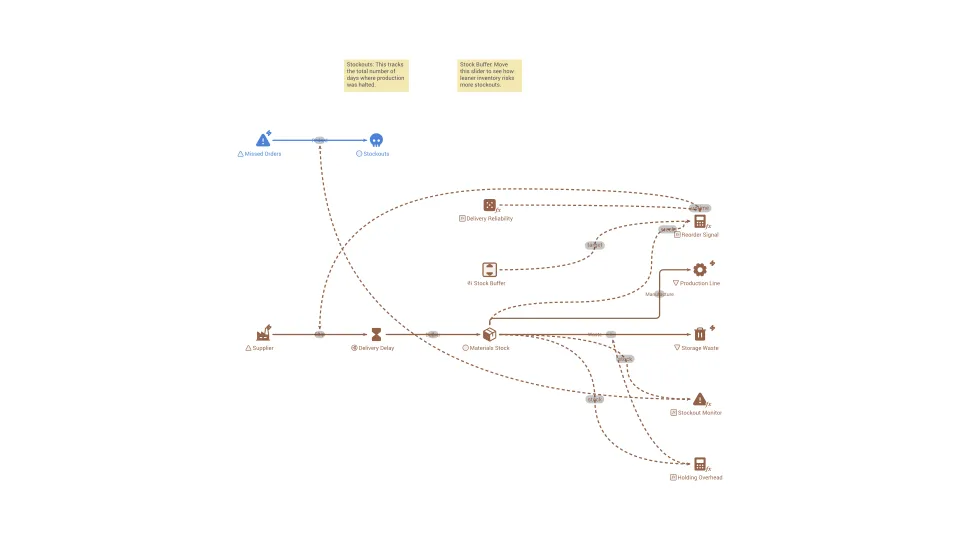
Just-in-time
A way of working in which materials arrive only when they are needed, keeping inventory and waste to a minimum.
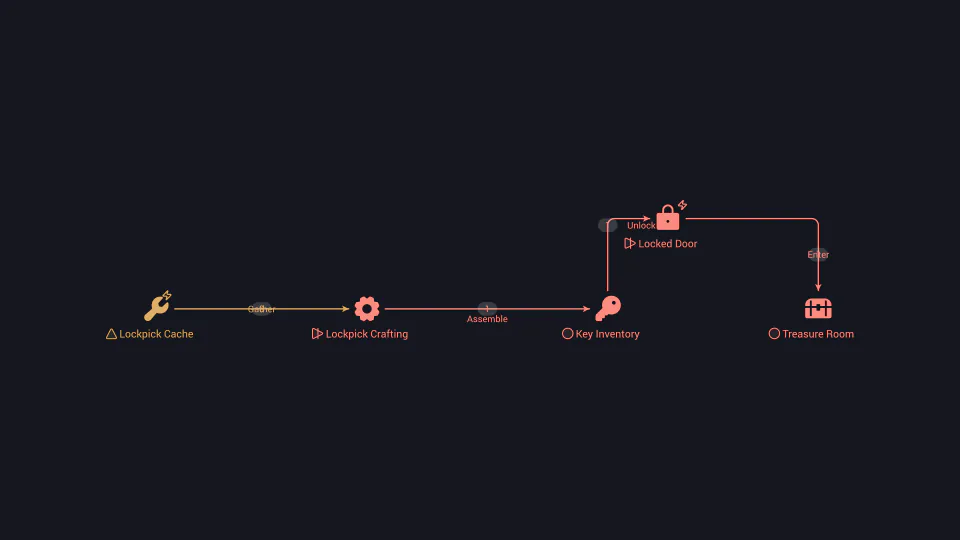
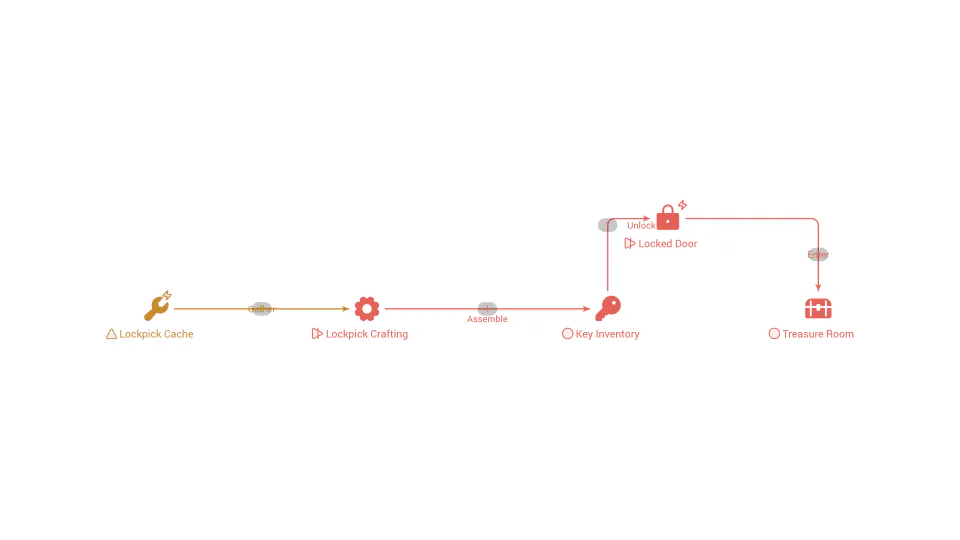
Key
Keys are pivotal gameplay features, narrative components, or design principles essential for progression and engagement.
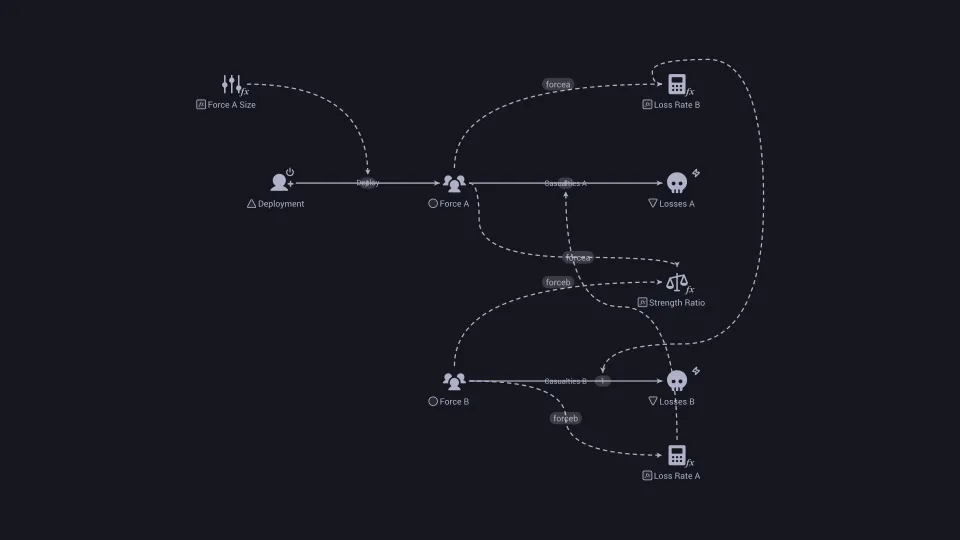
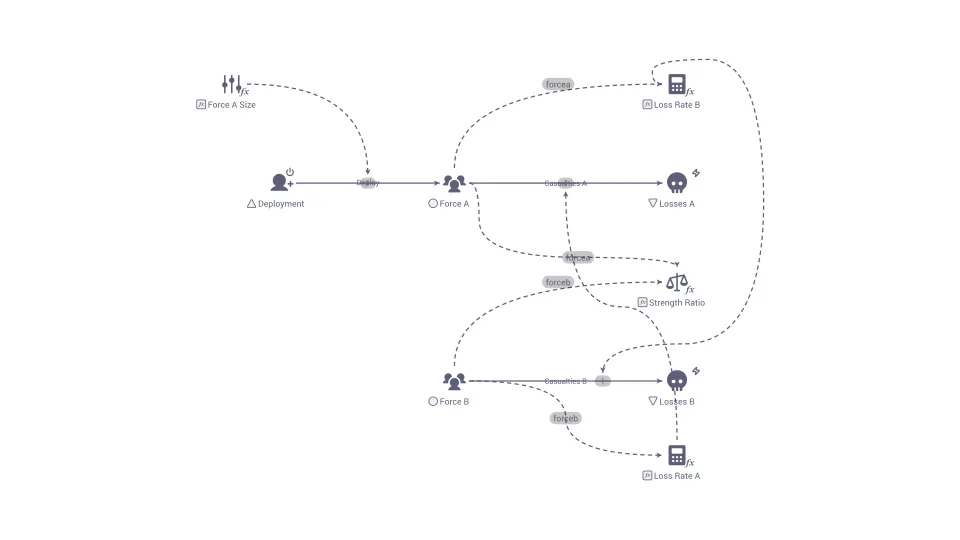
Lanchester's laws
Equations from operations research that describe how the sizes of two opposing forces change over time through attrition.
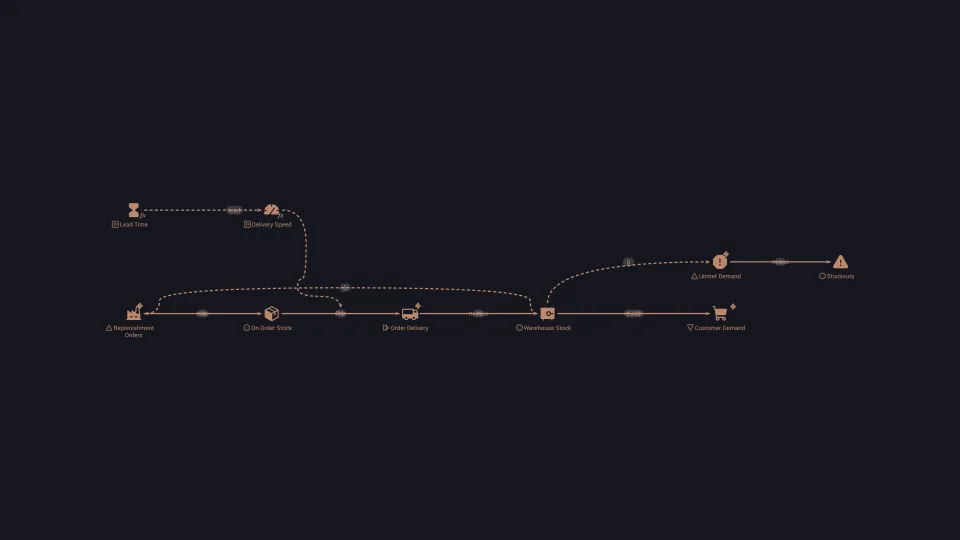
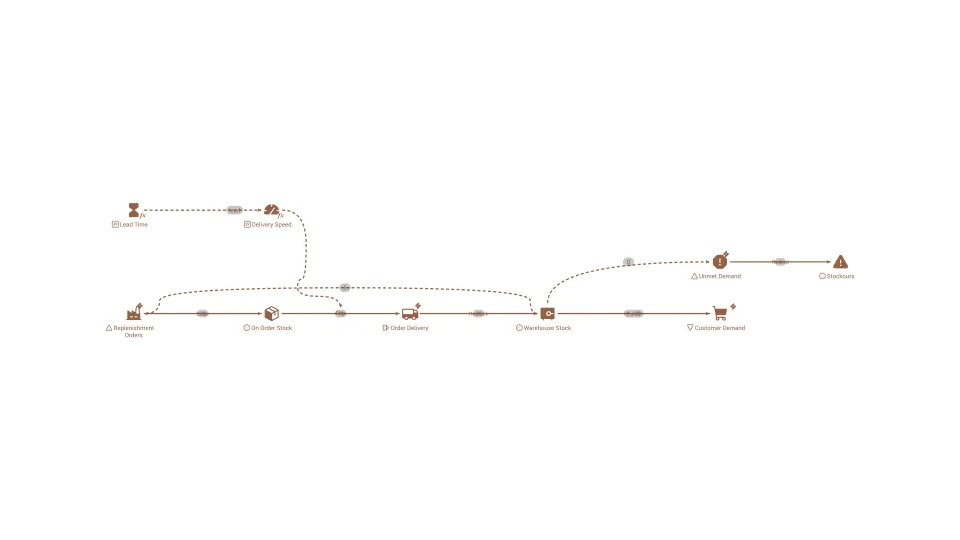
Lead time
The time that passes between placing an order, or starting a job, and receiving the finished result.
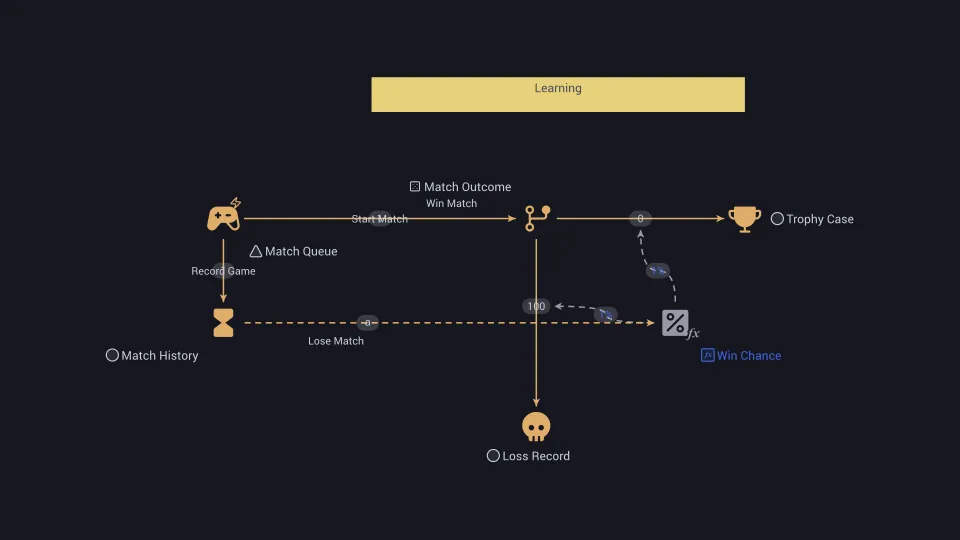
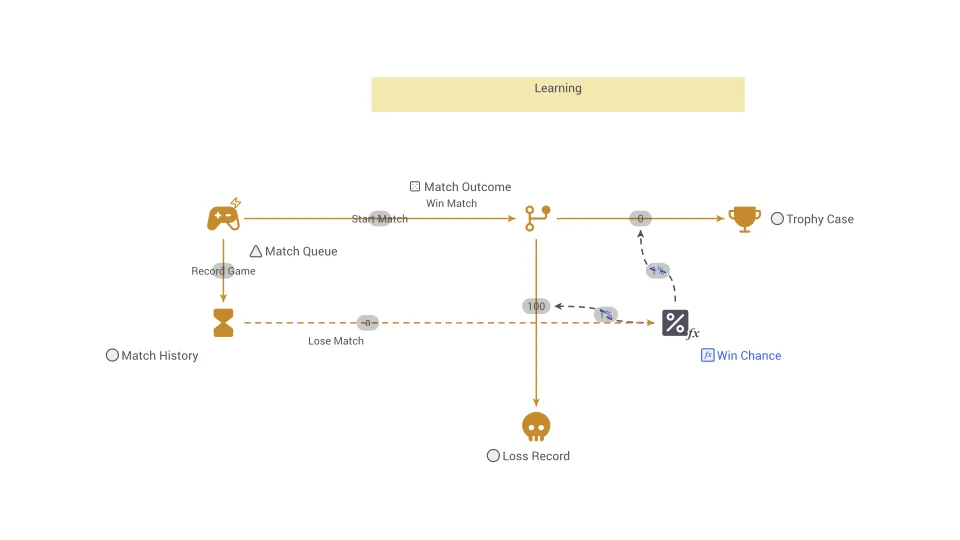
Learning
As the player plays more, their knowledge of the game improves and their chance of winning increases.
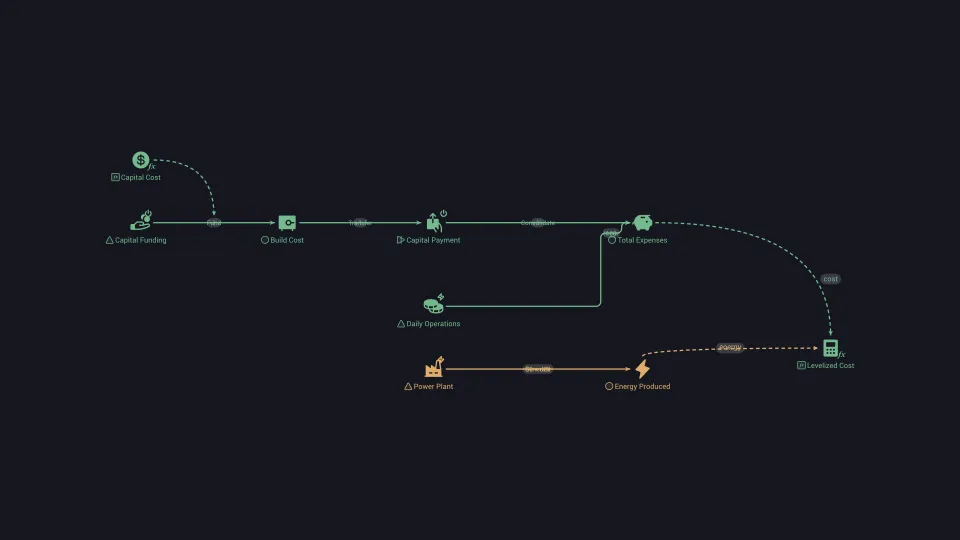
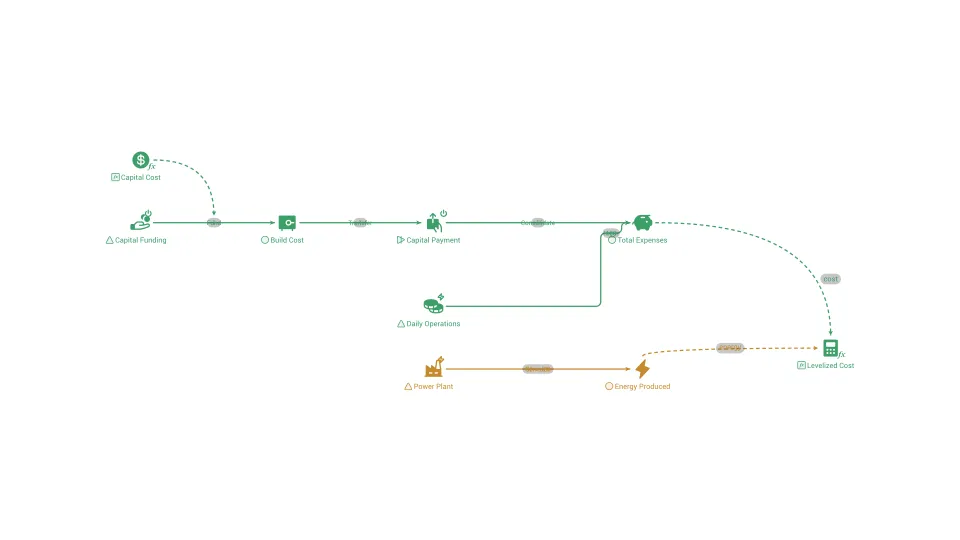
Levelized cost of energy
The average cost of each unit of energy a plant produces over its life, with all costs and output reduced to today's value.
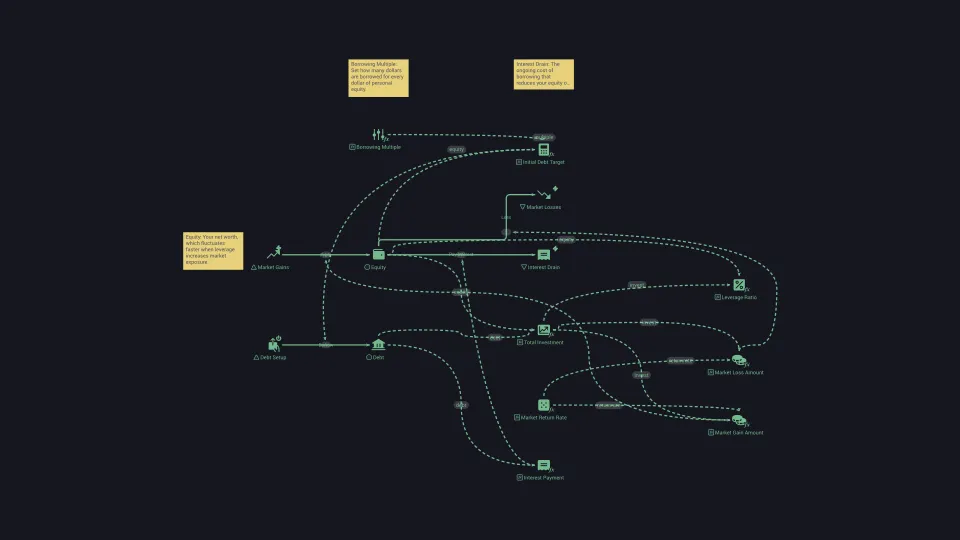
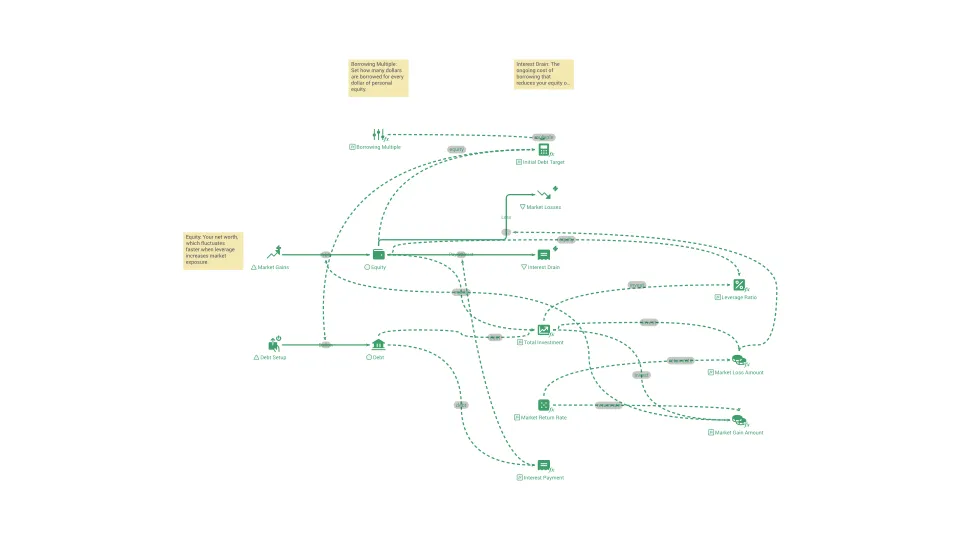
Leverage
Using borrowed money to increase the size of an investment, which magnifies both gains and losses relative to your own capital.
Leverage point
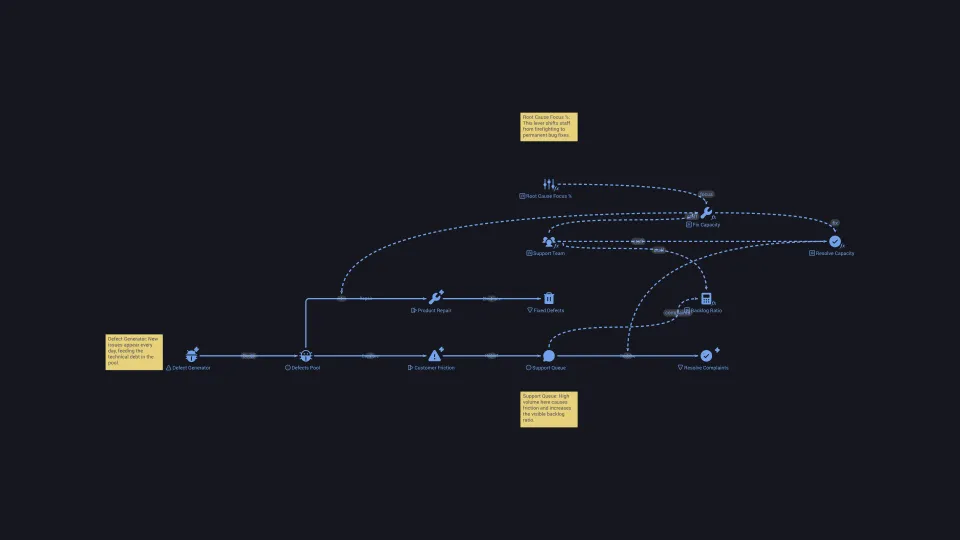
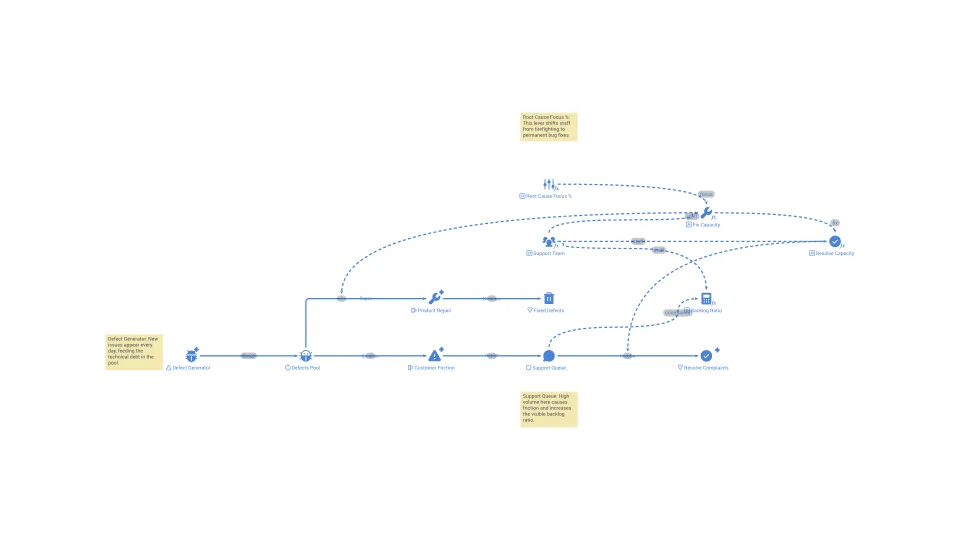
A place in a system where a small, well-aimed change produces a large and lasting shift in behavior.
Limits to growth
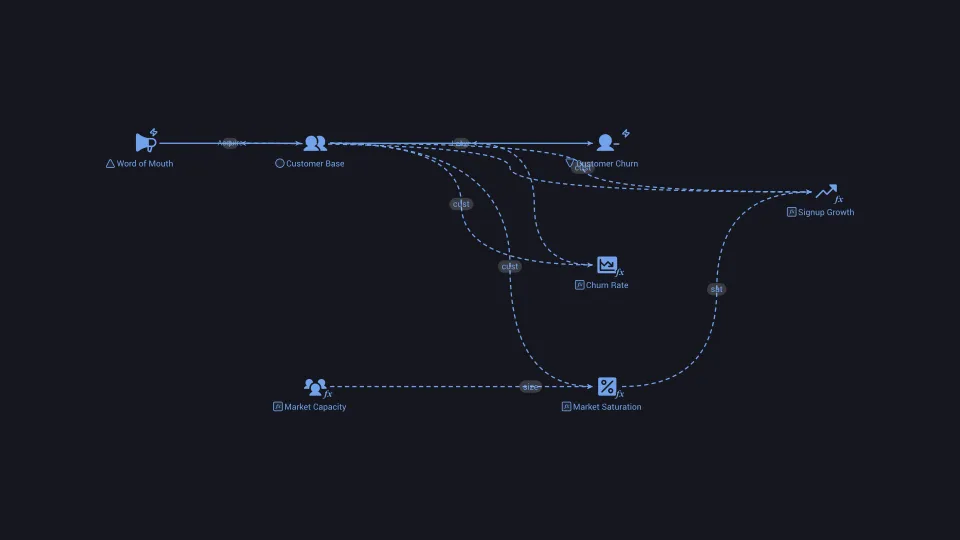
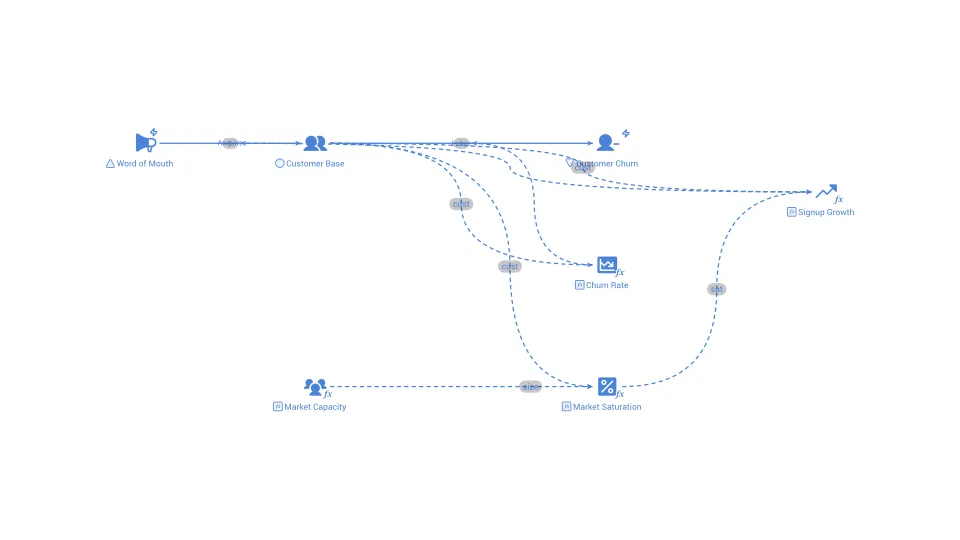
A pattern in which a reinforcing loop drives growth until it meets a limiting factor that slows it, flattens it, or turns it downward.
Linear lock
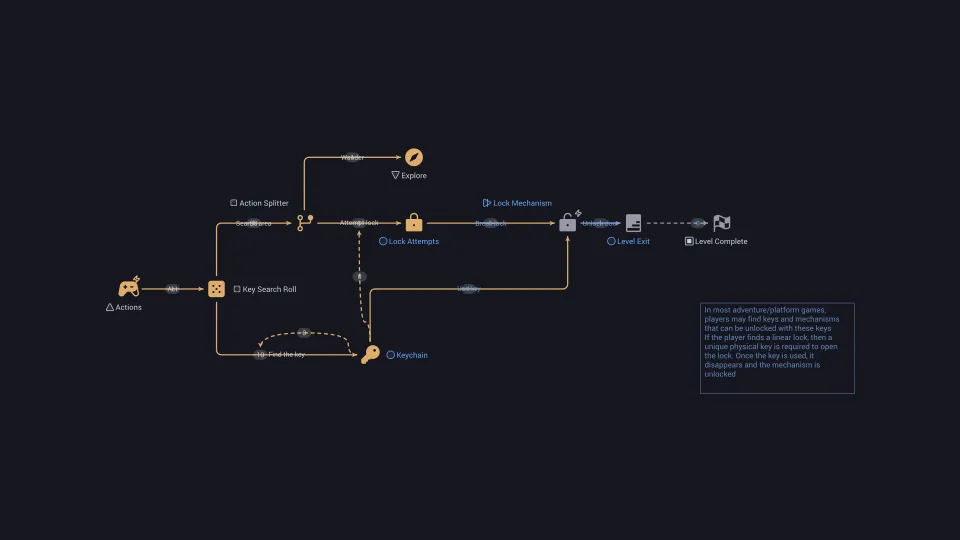
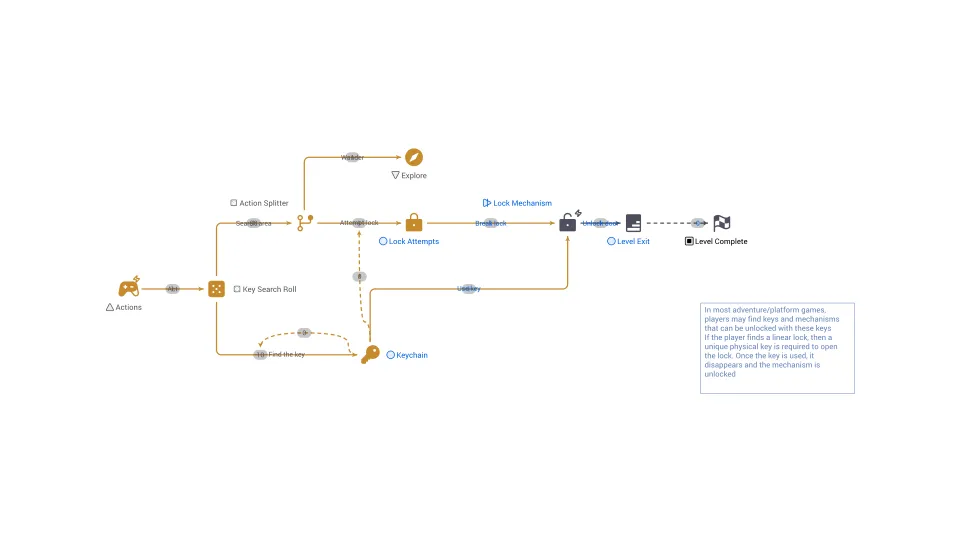
A linear lock refers to a game mechanic or progression system that restricts player advancement or access to content in a linear and sequential manner.
Linear variation
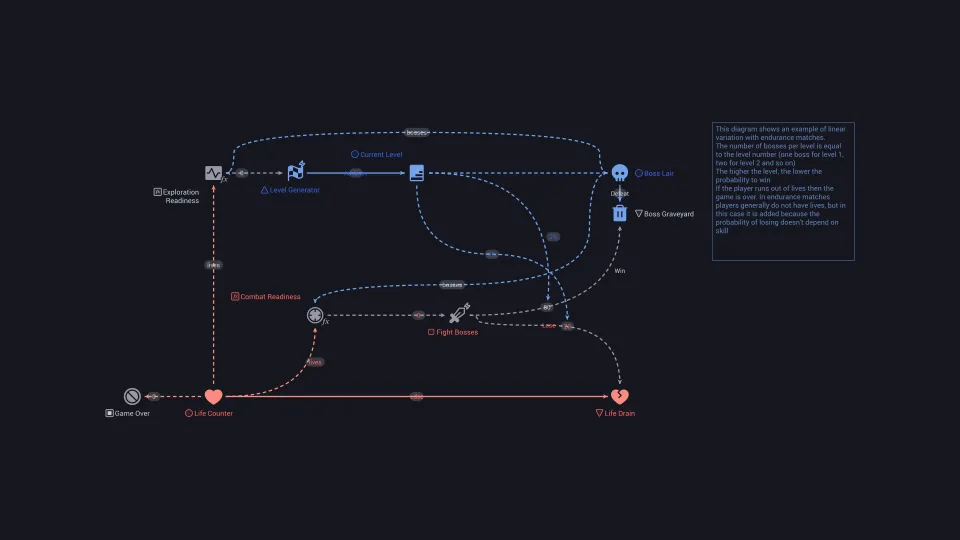
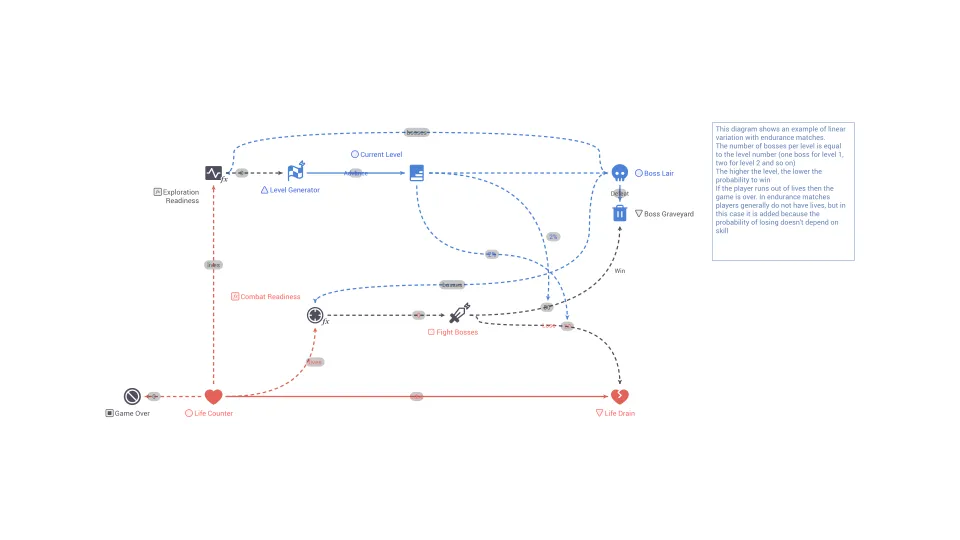
Linear variation in game design refers to the introduction of gradual and incremental changes to gameplay elements in a linear or sequential manner.
Liquidity
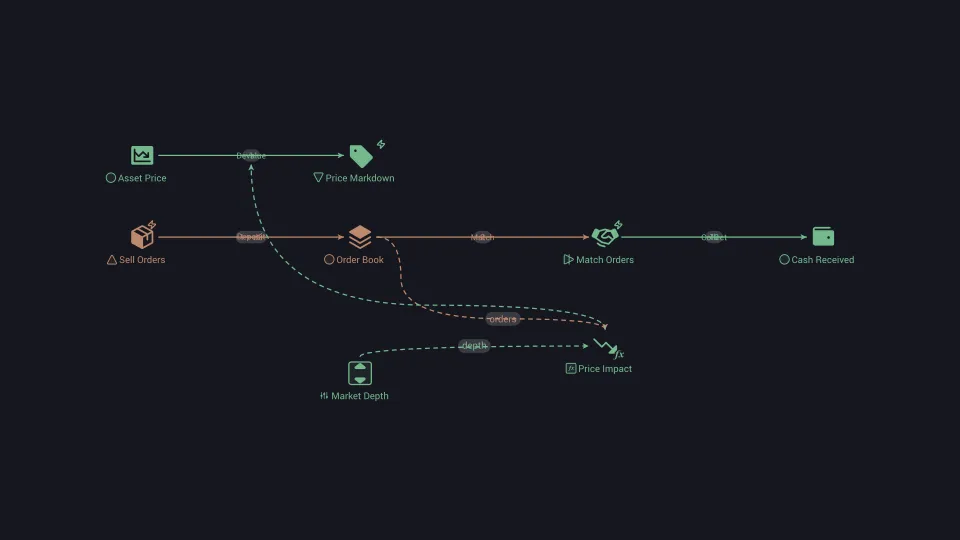
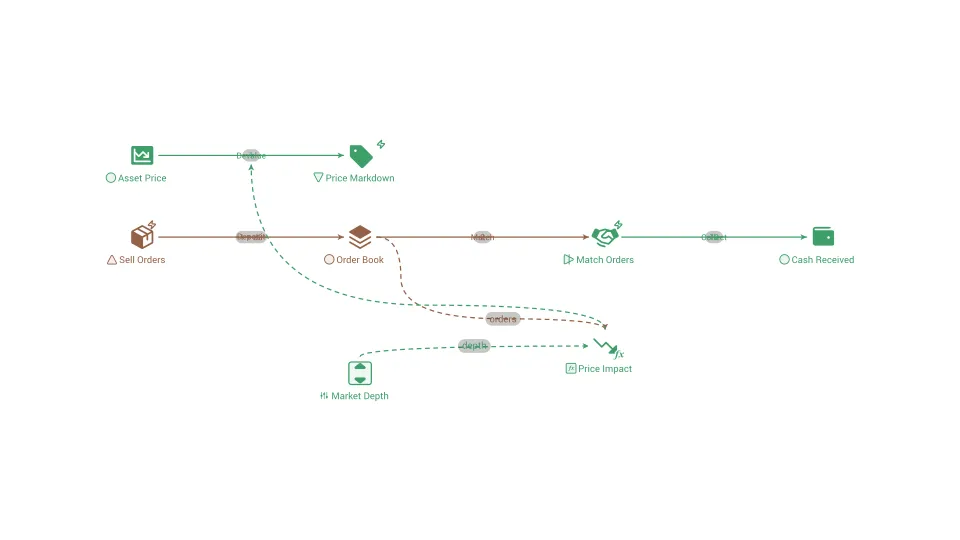
How quickly and cheaply an asset can be turned into cash without moving its price, or how much cash a business can reach.
Liquidity pool
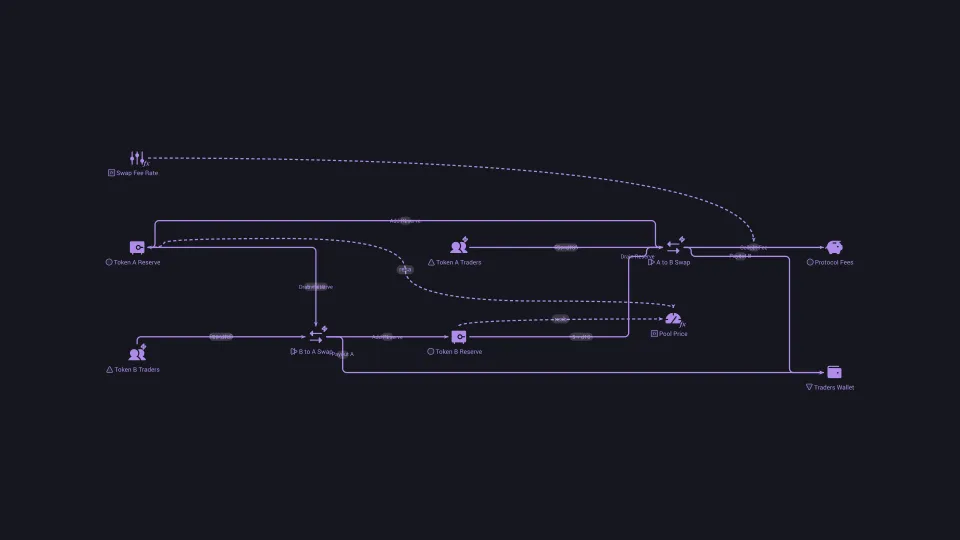
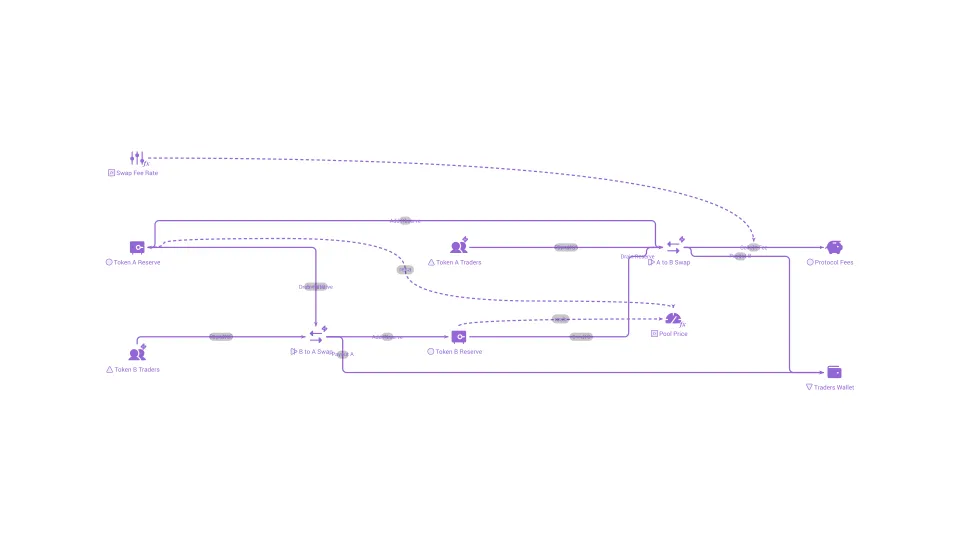
A pot of two or more tokens locked in a smart contract that lets people trade against it, instead of against another trader.
Little's law
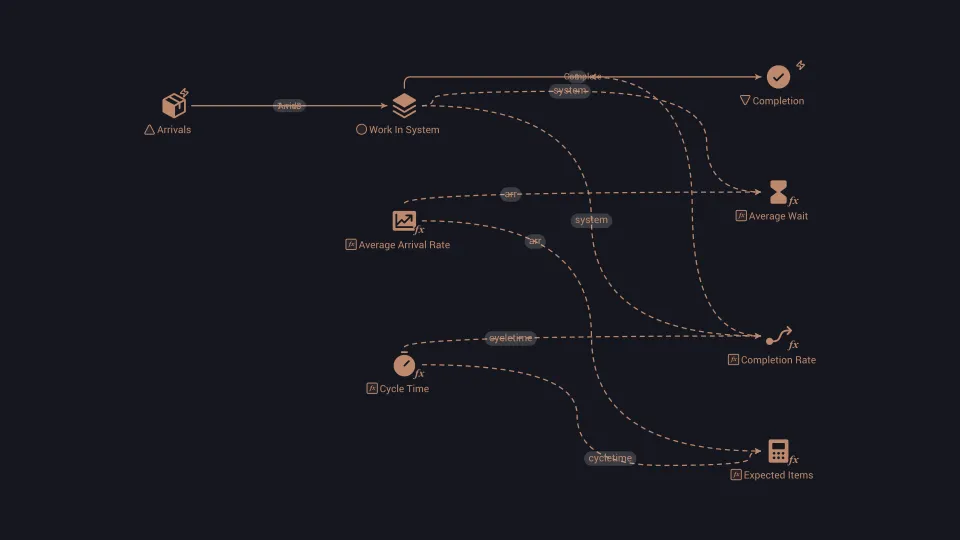
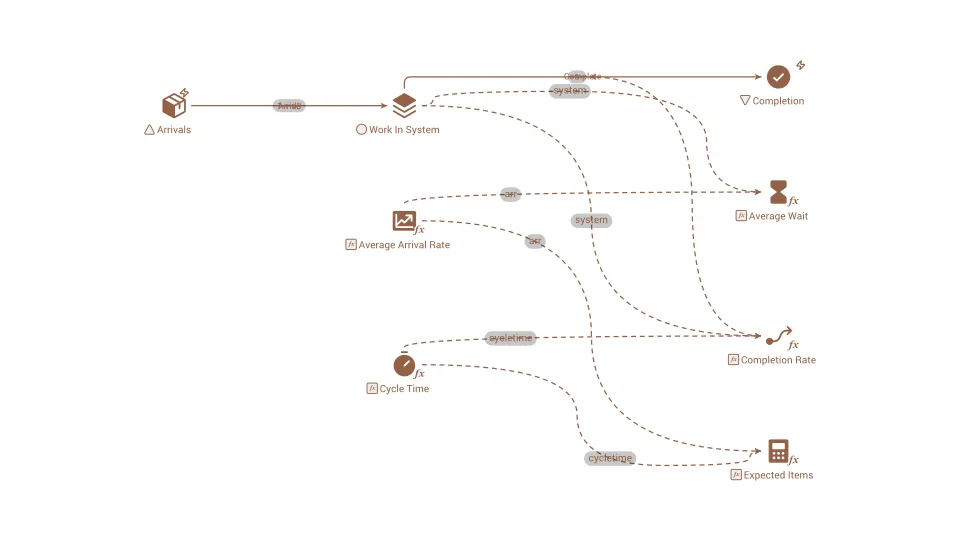
A rule stating that the average number of items in a system equals their arrival rate times the average time each stays.
Lock
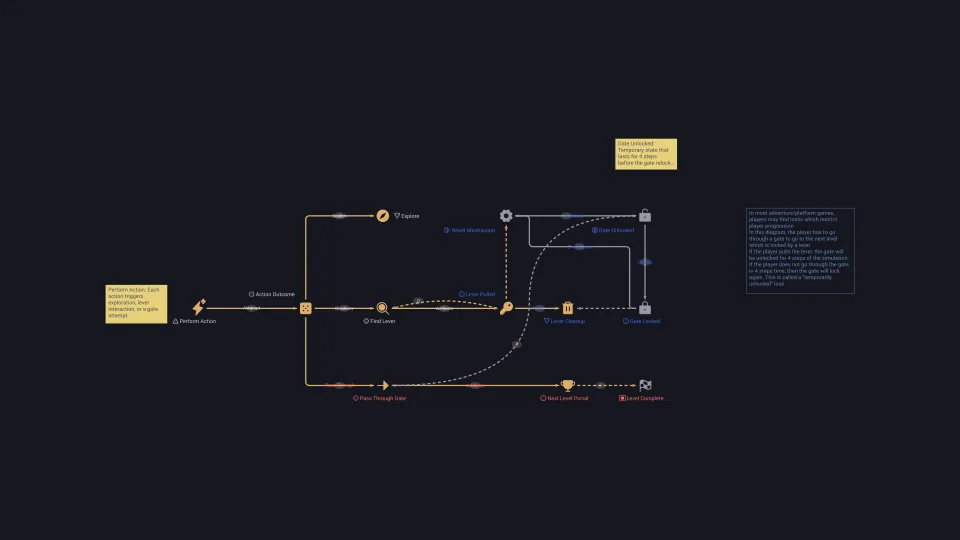
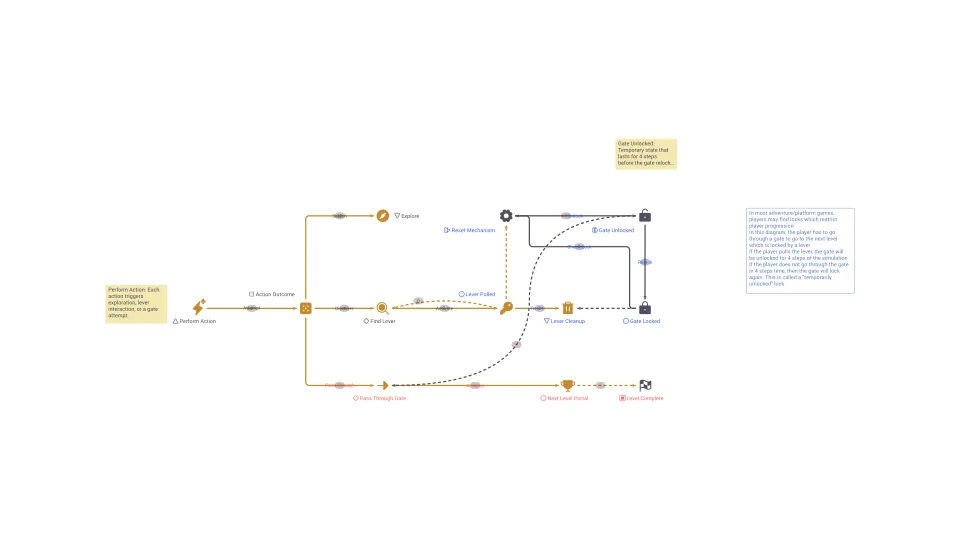
A lock refers to a game mechanic or condition that prevents players from accessing or progressing further until certain criteria are met.
Loyalty program
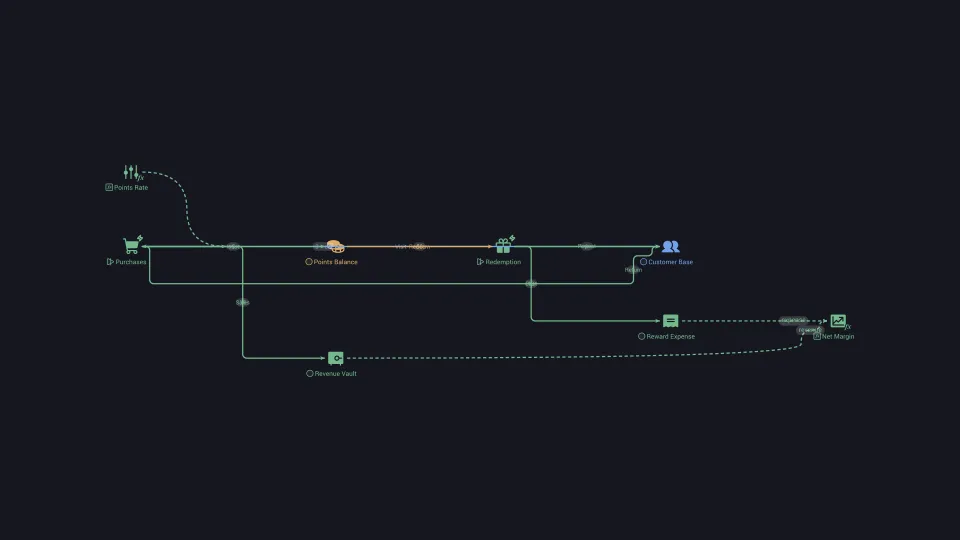
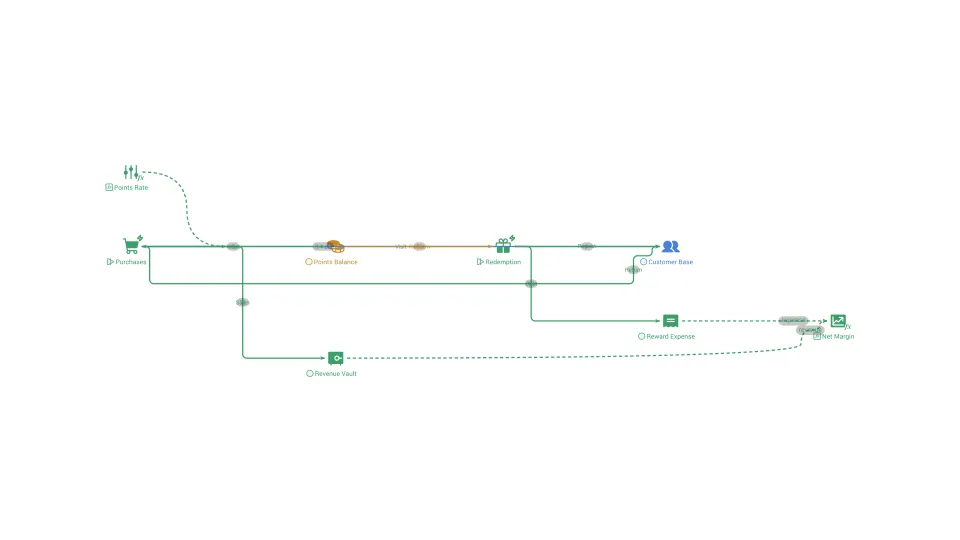
A scheme that rewards repeat customers with points or perks, aiming to raise how often and how long they buy.
Luxury good
A good for which demand rises faster than income, so buyers spend a larger share of their budget on it as they get richer.
Marginal cost
The extra cost of producing one more unit of something, which guides how much to make and what to charge.
Marginal utility
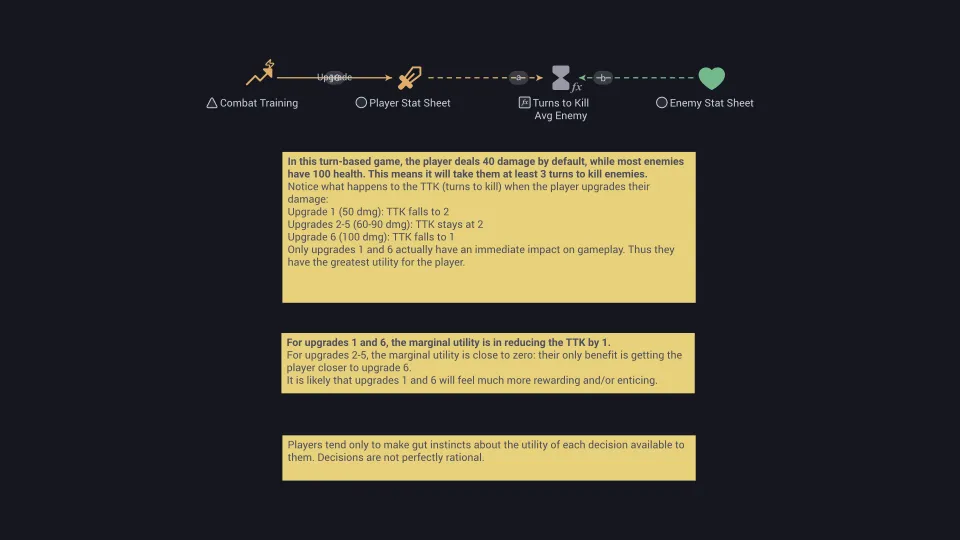
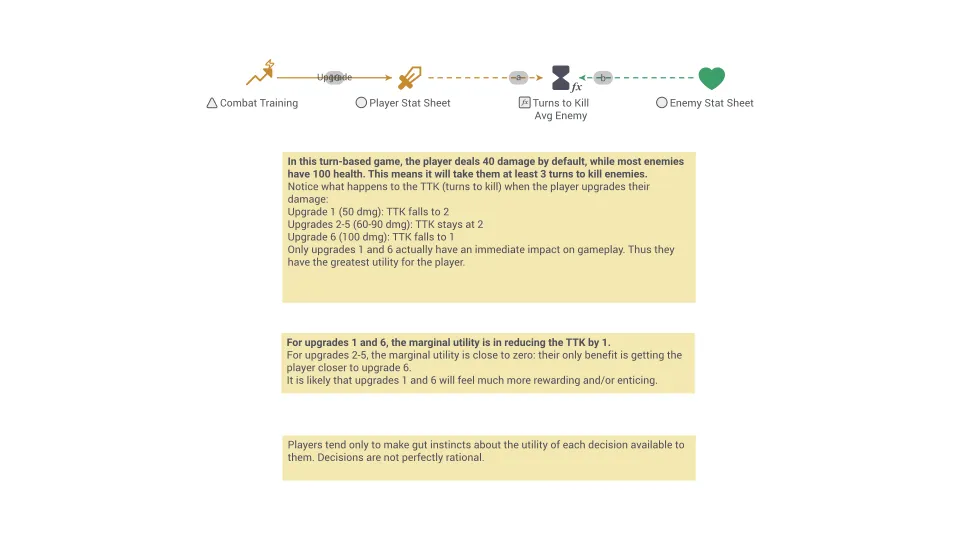
The extra satisfaction or benefit gained from one more unit of something, which typically shrinks as you already have more of it.
Market failure
A situation where a free market on its own does not lead to the best outcome for society as a whole.
Mechanic (gameplay)
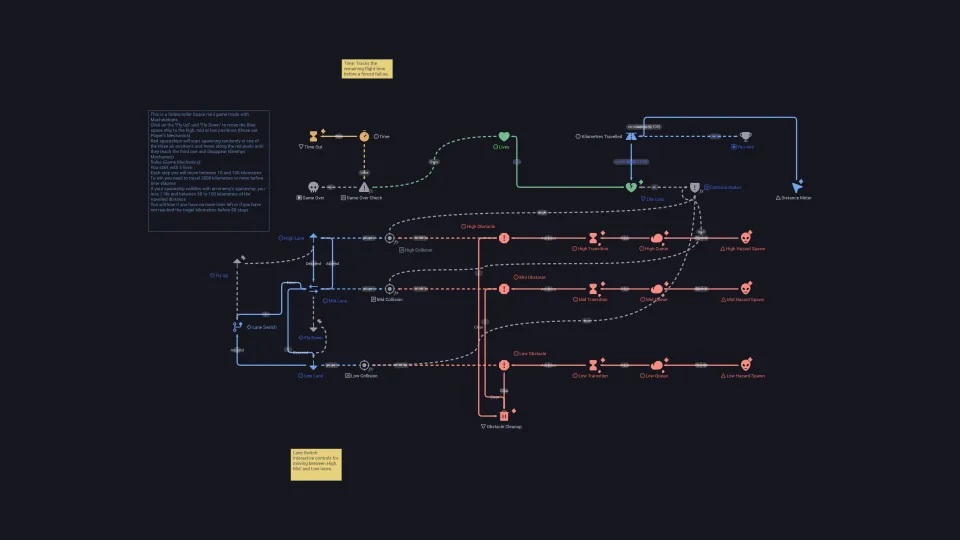
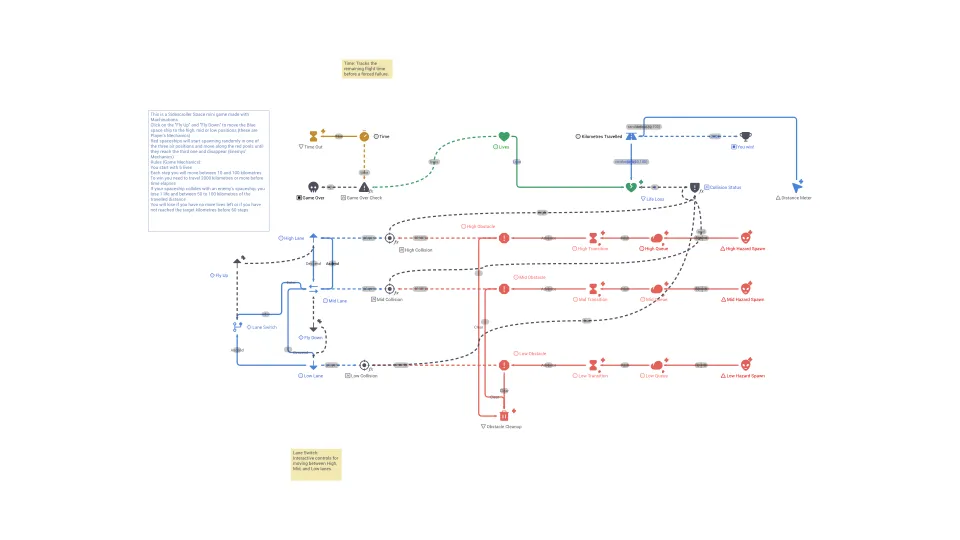
In game design, a mechanic refers to a specific interactive element or rule within a game that governs gameplay behavior, actions, or systems.
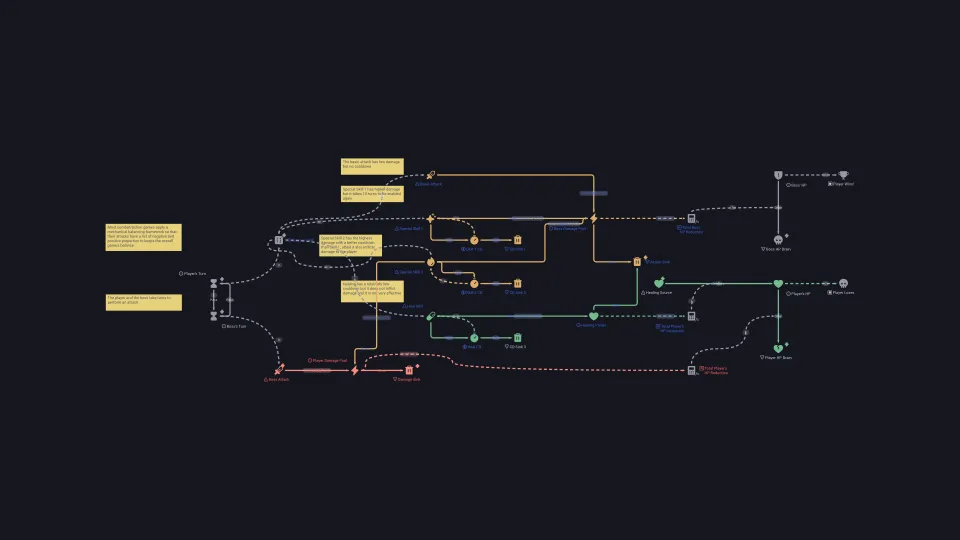
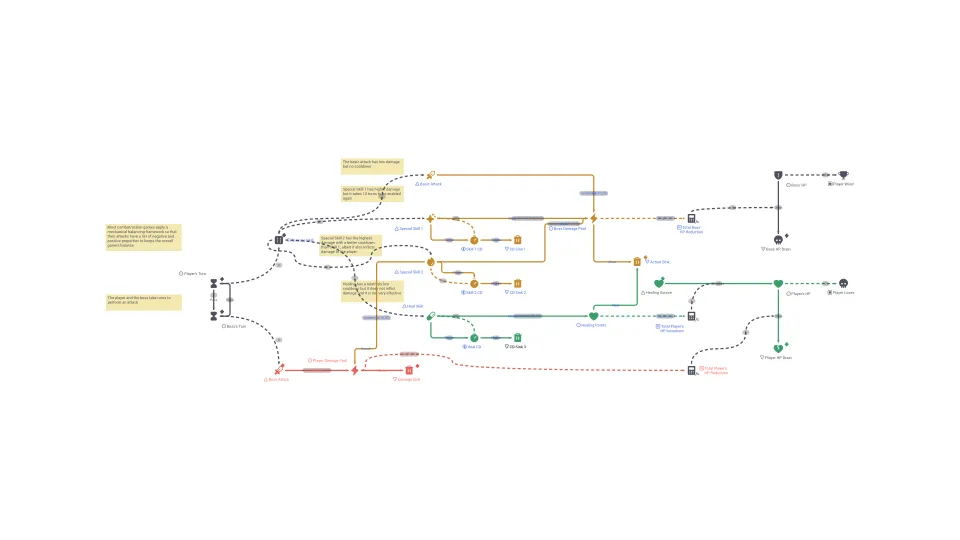
Mechanical balancing framework
A mechanical balancing framework is used to ensure that various gameplay mechanics, or elements within a game are fair, and well-balanced.
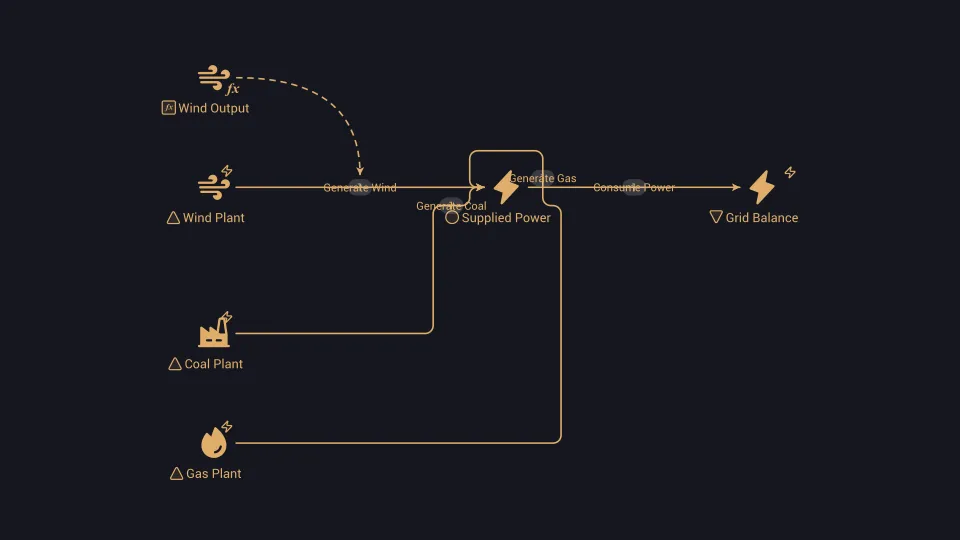
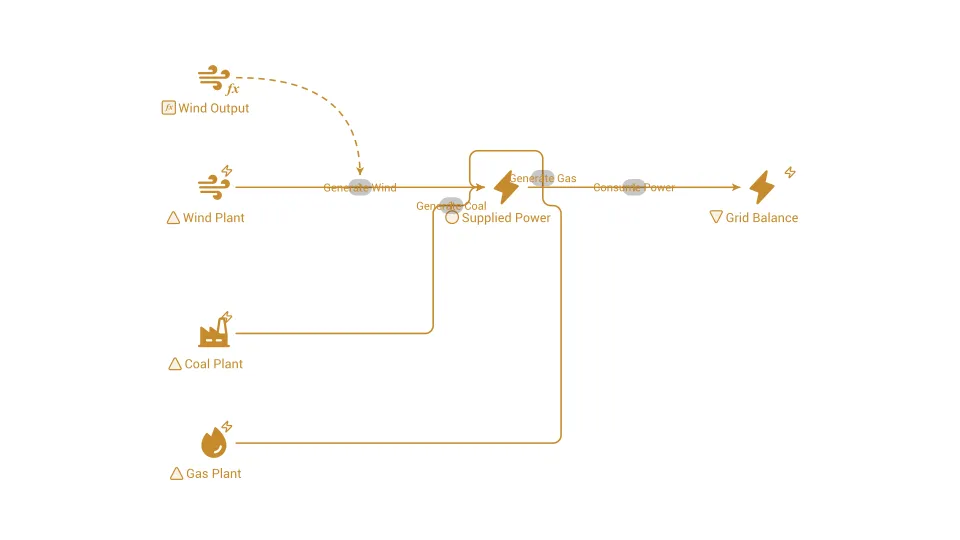
Merit order
The ranking of power plants by marginal cost, used to decide which ones are switched on first to meet demand.
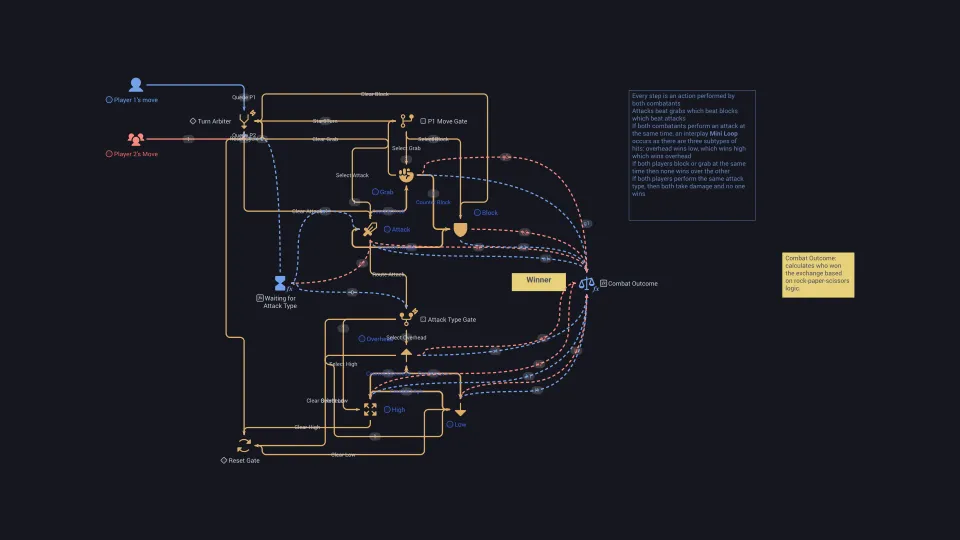
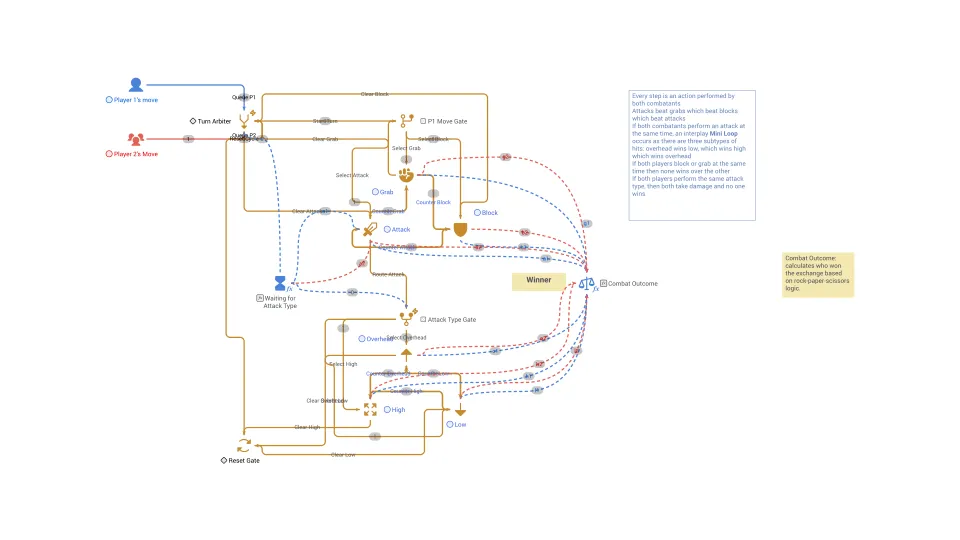
Mini loop
A mini loop refers to a short and self-contained gameplay sequence or cycle that occurs within the larger context of a game.
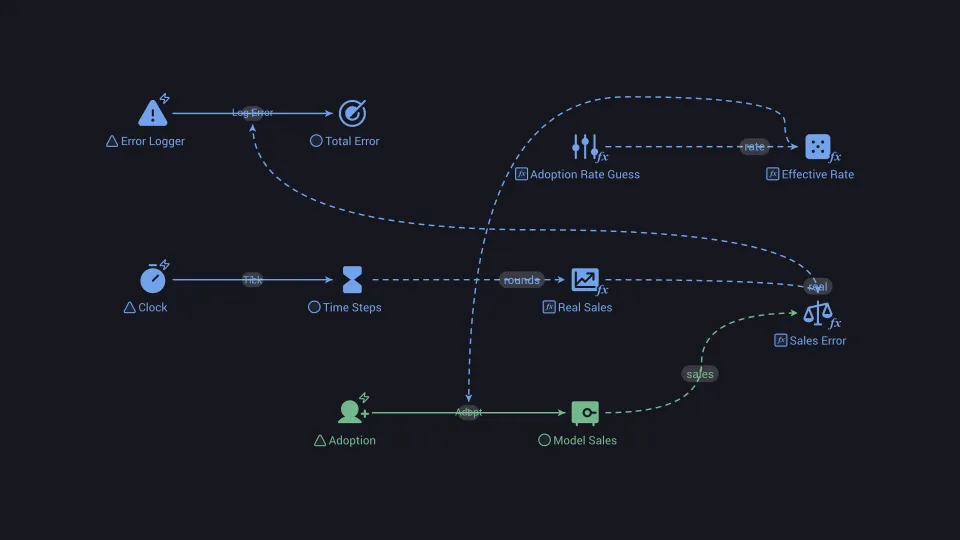
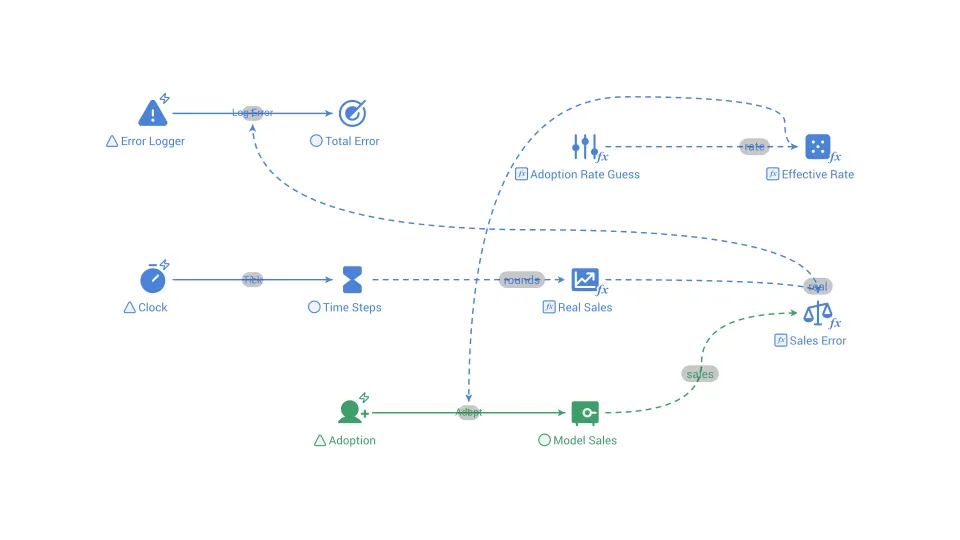
Model calibration
Adjusting a model's uncertain parameters, such as rates or delays, until its output matches observed real-world data as closely as possible.
Model validation
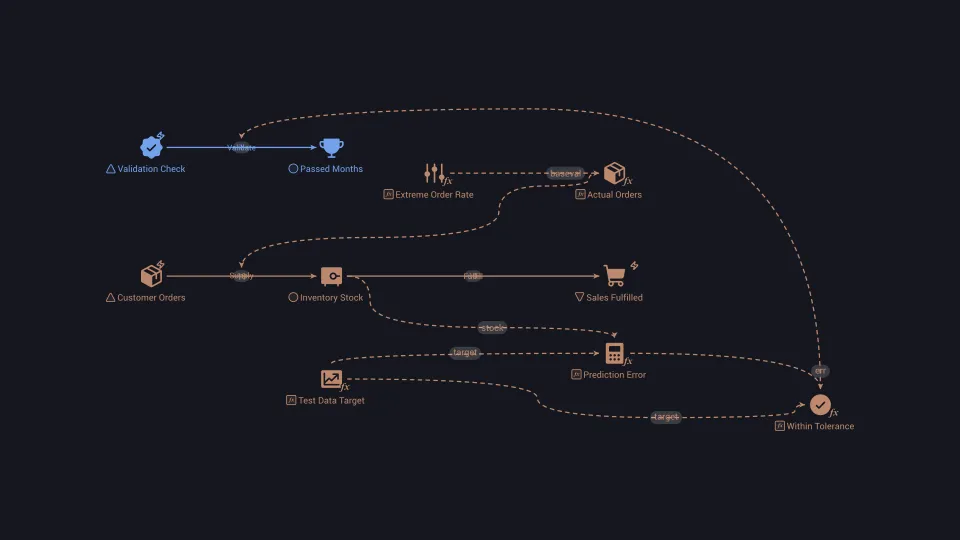
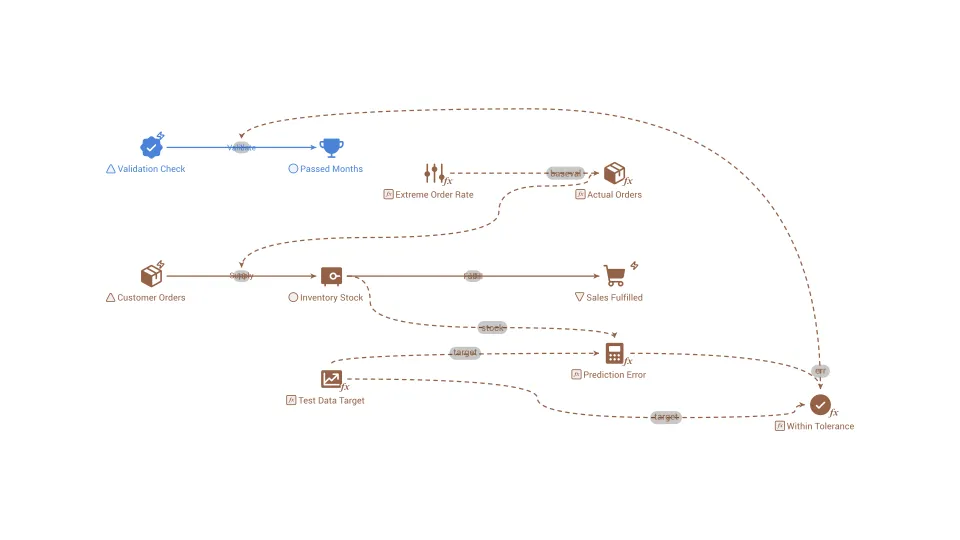
The process of checking that a model is a credible enough representation of the real system for the purpose it was built for.
Monetary policy
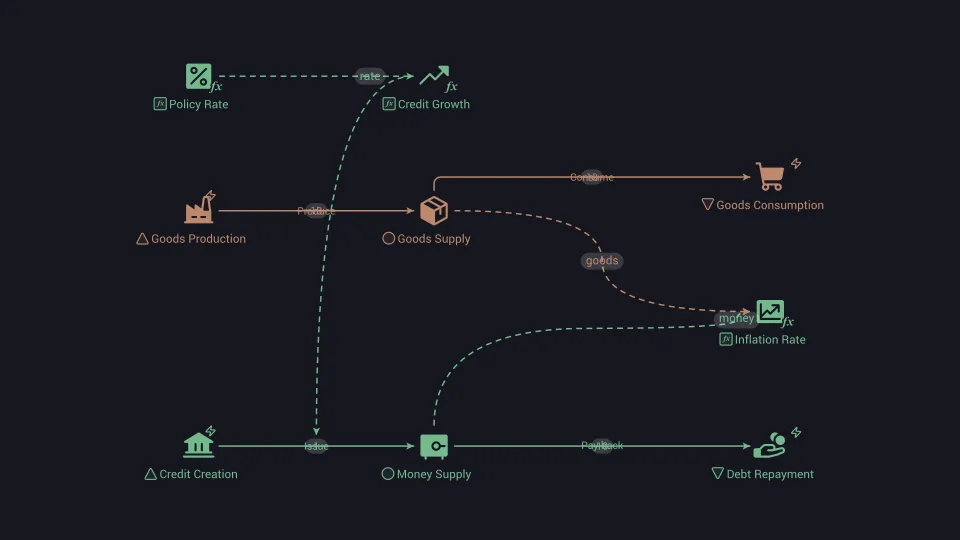
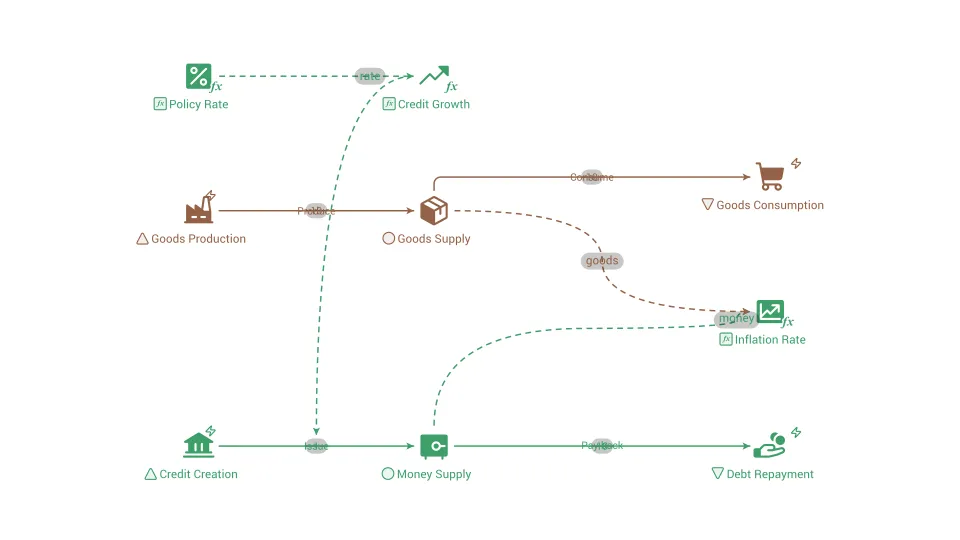
The actions a central bank takes to steer money, credit and interest rates in order to influence prices and employment.
Money supply
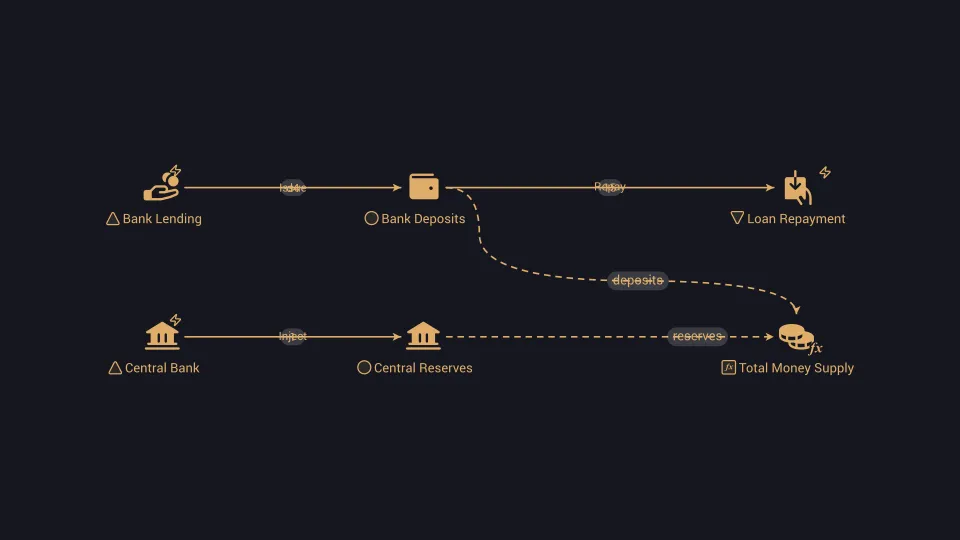
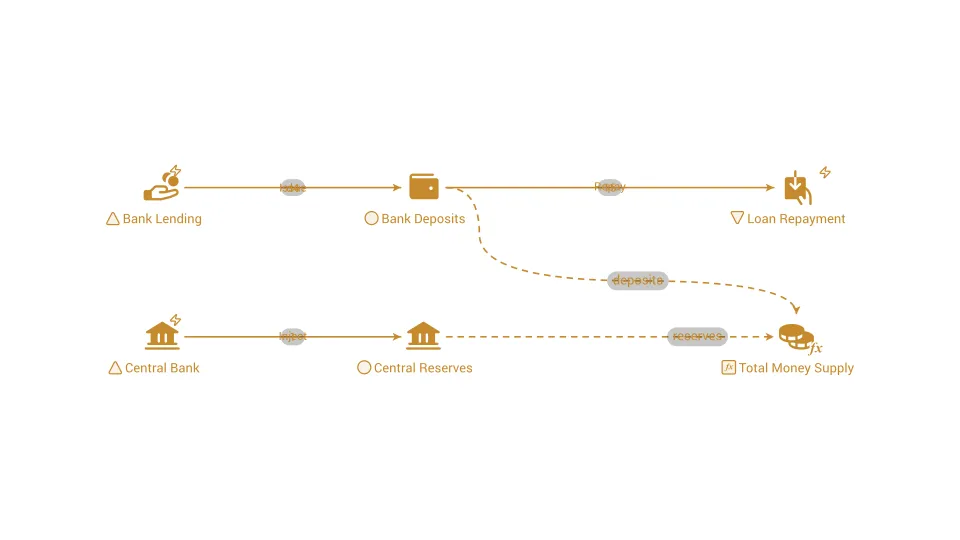
The total amount of money circulating in an economy, including cash and the balances held in bank accounts.
Monte Carlo simulation
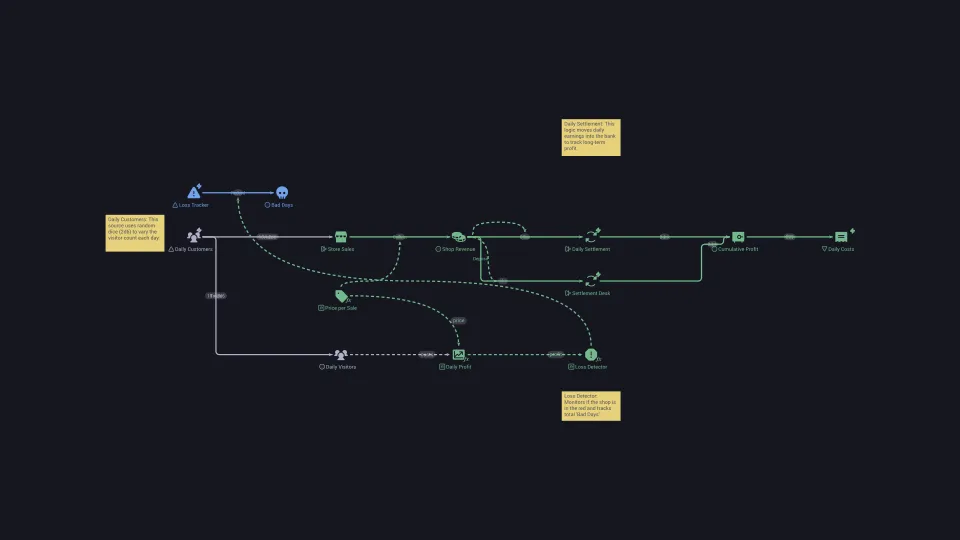
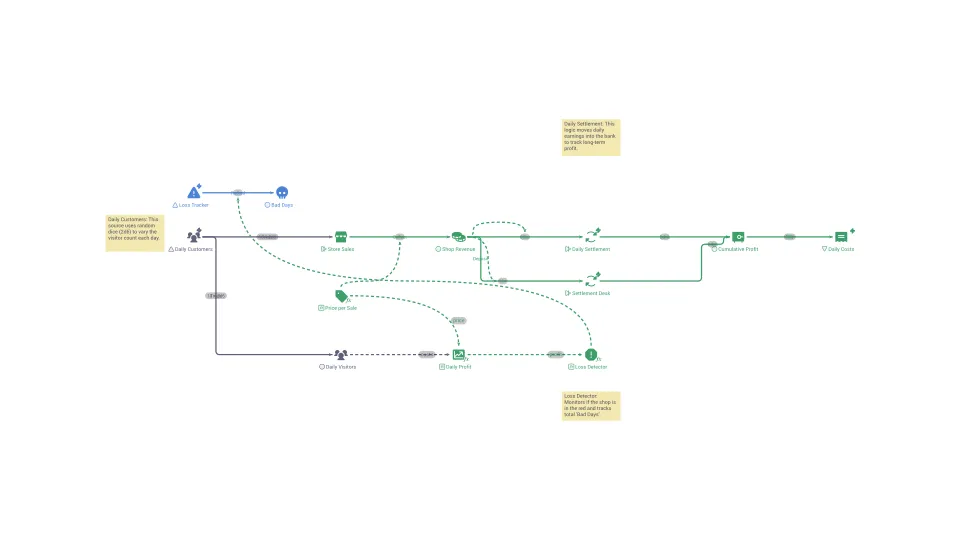
A technique that repeats a model many times with random inputs to show the full range and likelihood of possible outcomes.
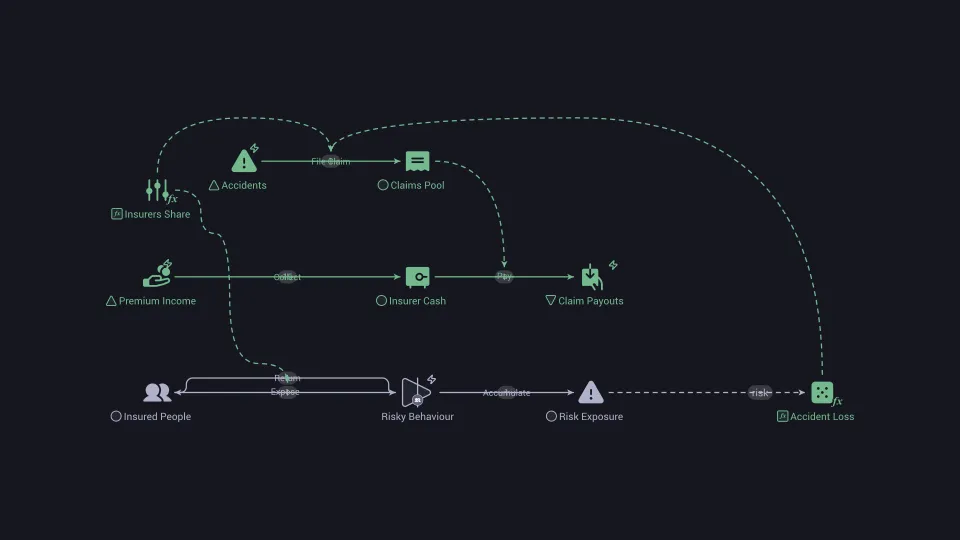
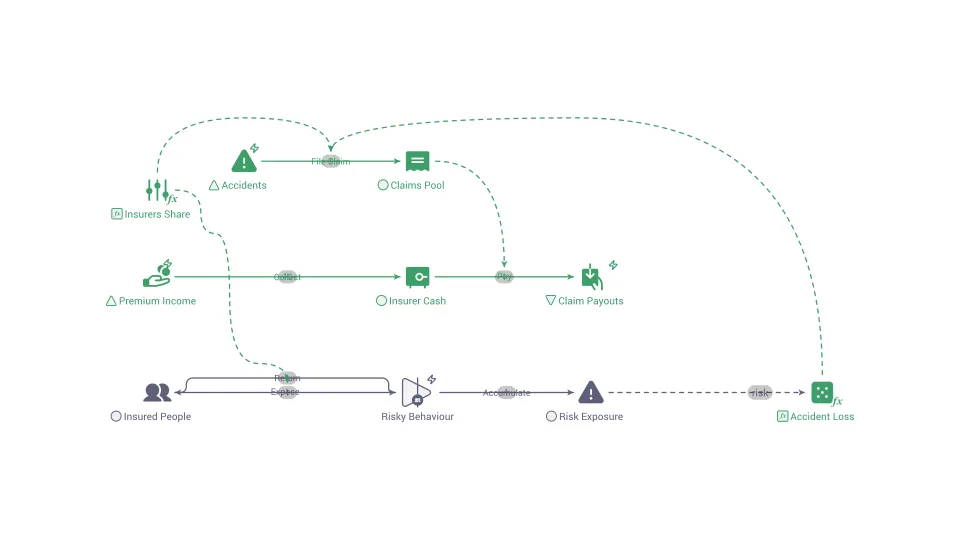
Moral hazard
The tendency to take on more risk once someone else, such as an insurer or a lender, bears the cost if things go wrong.
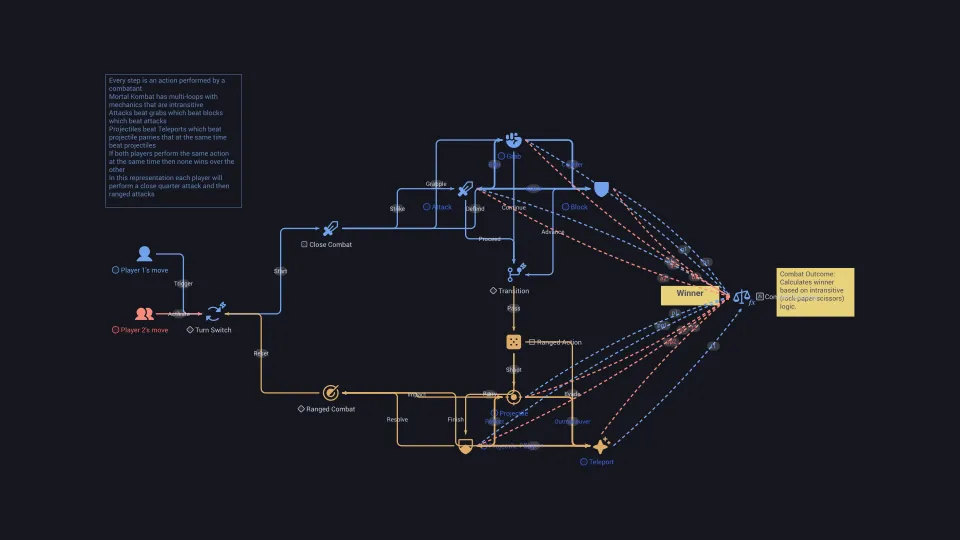
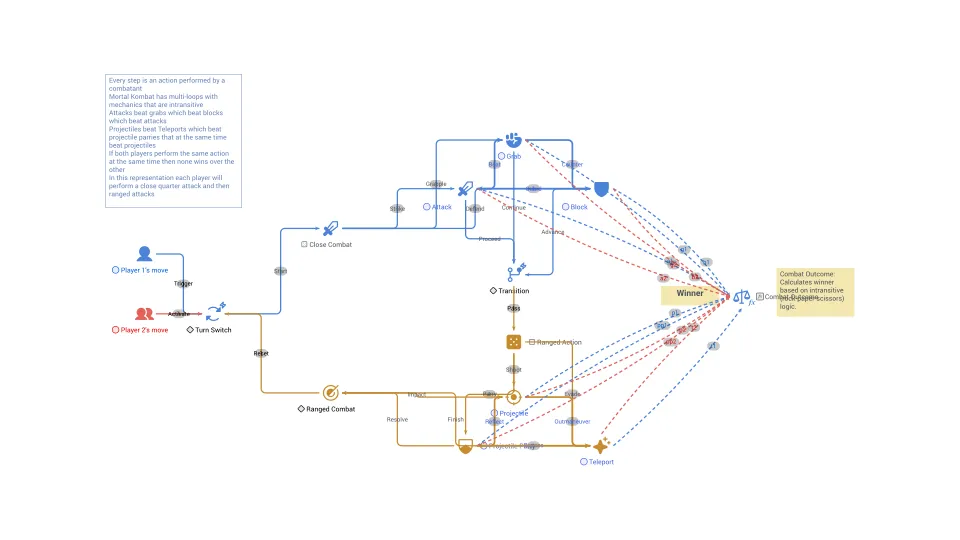
Multi loop
Multi loop refers to a larger-scale gameplay sequence that encompasses multiple interconnected mini loops or gameplay loops within a game.
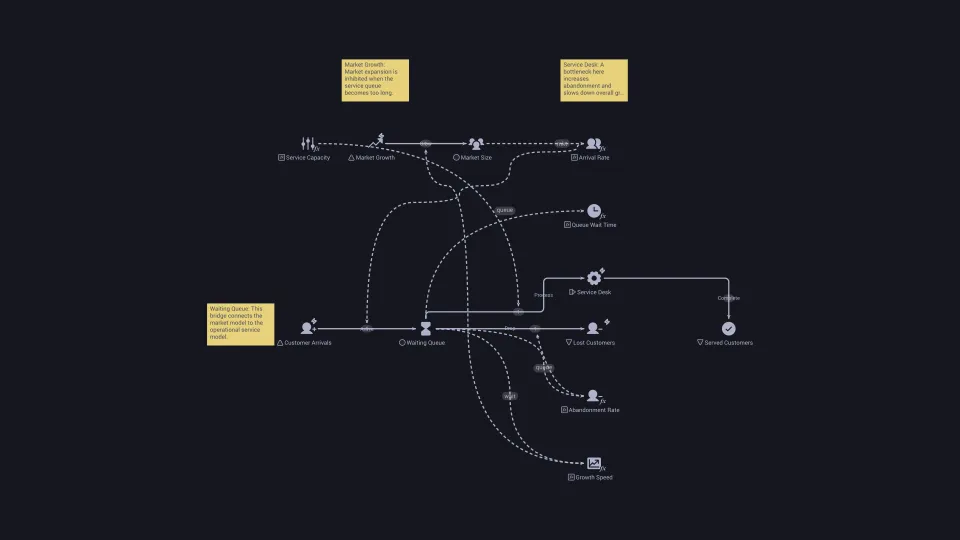
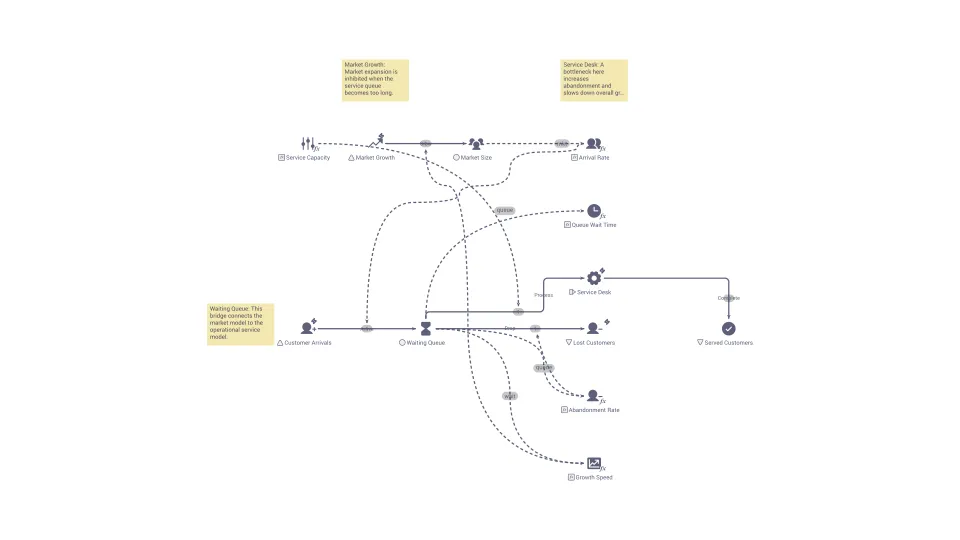
Multimethod modeling (hybrid simulation)
Building one model that combines simulation methods, such as system dynamics, discrete events, and agents, to capture different parts of a problem.
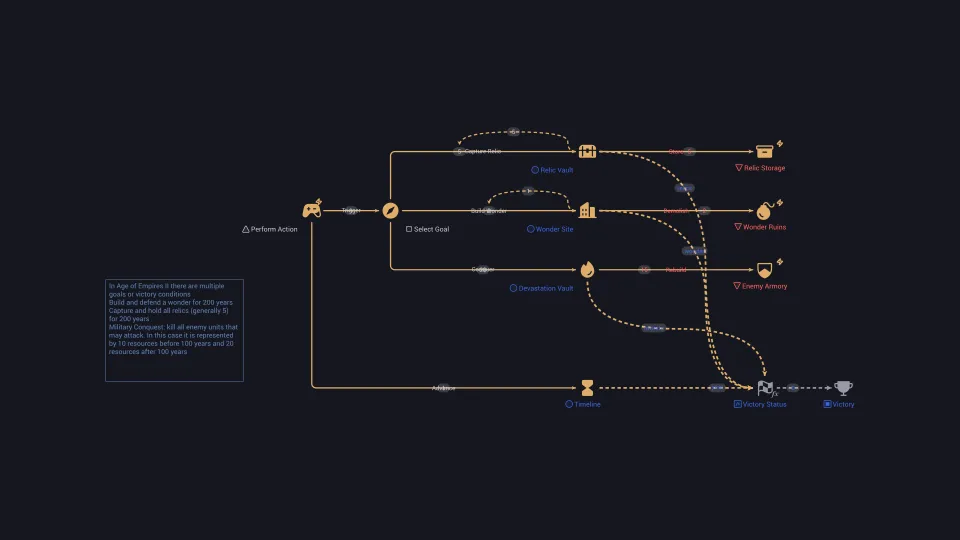
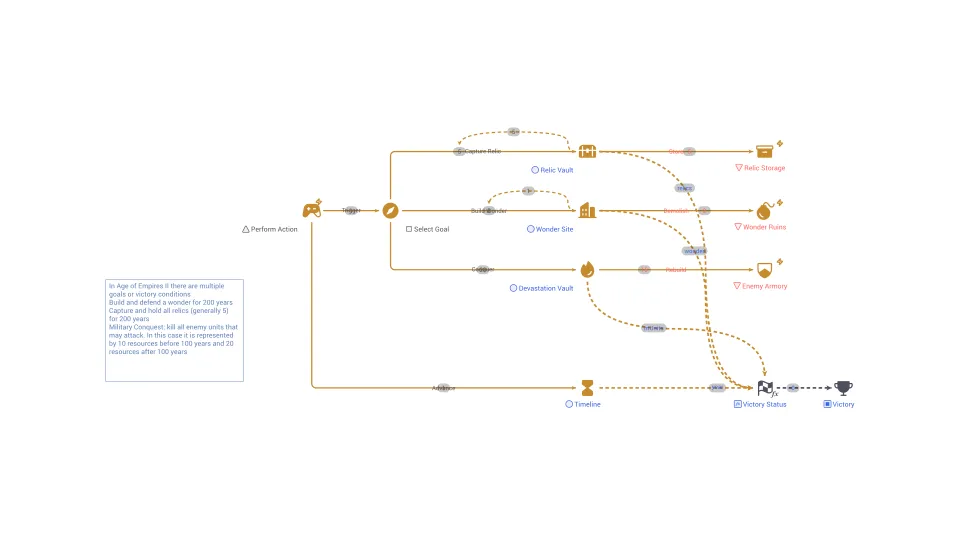
Multiple goals
Multiple goals refer to the inclusion of multiple objectives or targets that players can pursue simultaneously or sequentially within a game.
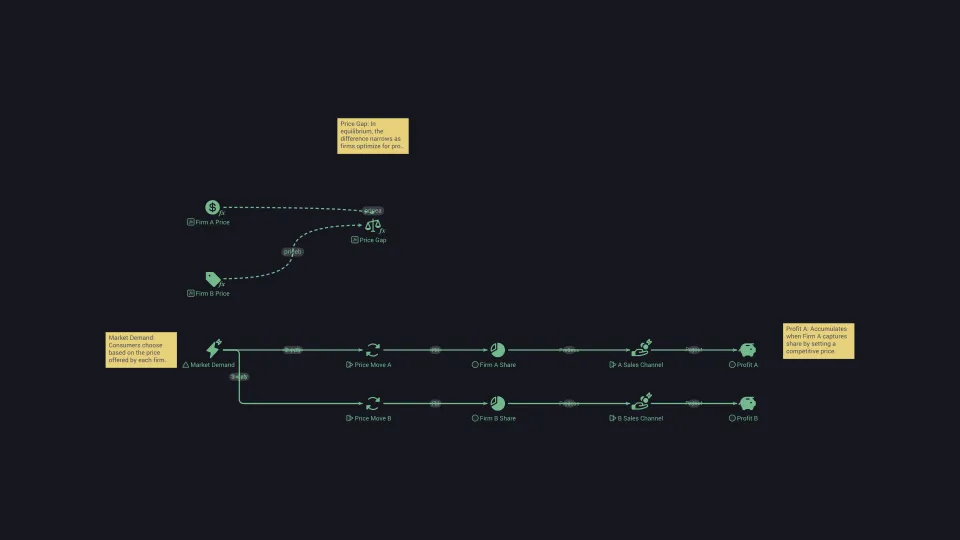
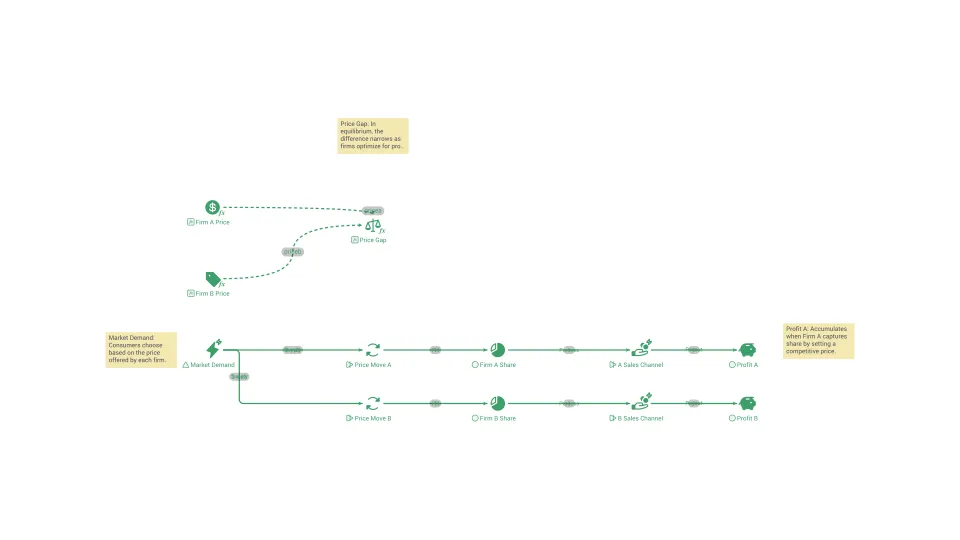
Nash equilibrium
A situation where each player is doing the best they can given what the others are doing, so nobody gains by changing alone.
Necessity good
A good people keep buying even when income falls, so demand changes less than income does.
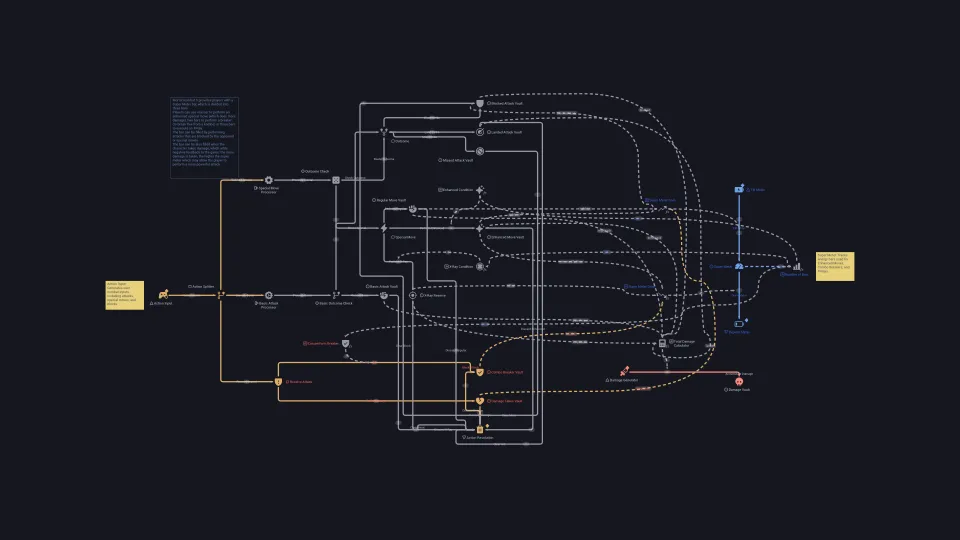
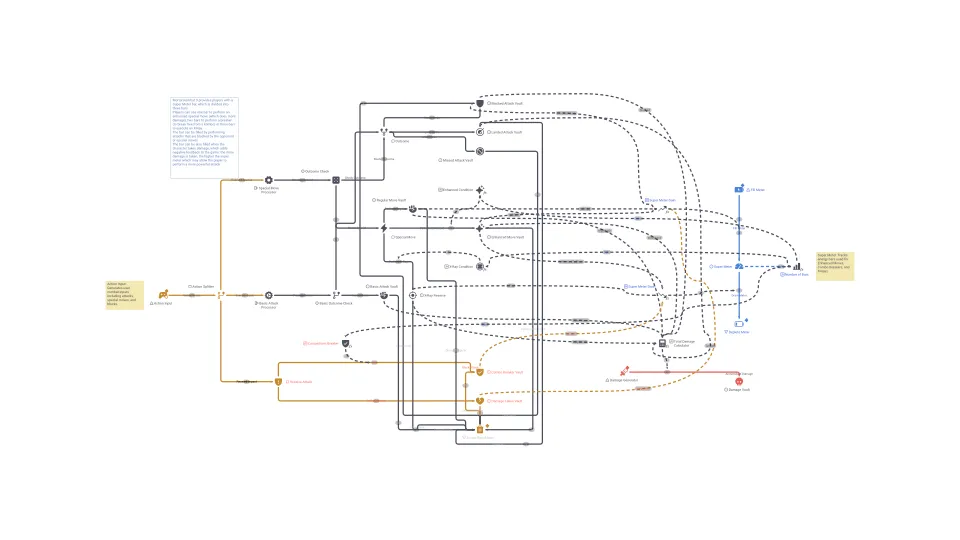
Negative feedback
Negative feedback in game design empowers a disadvantaged or losing player to recuperate, bridge the gap, or potentially reverse the course of a match.
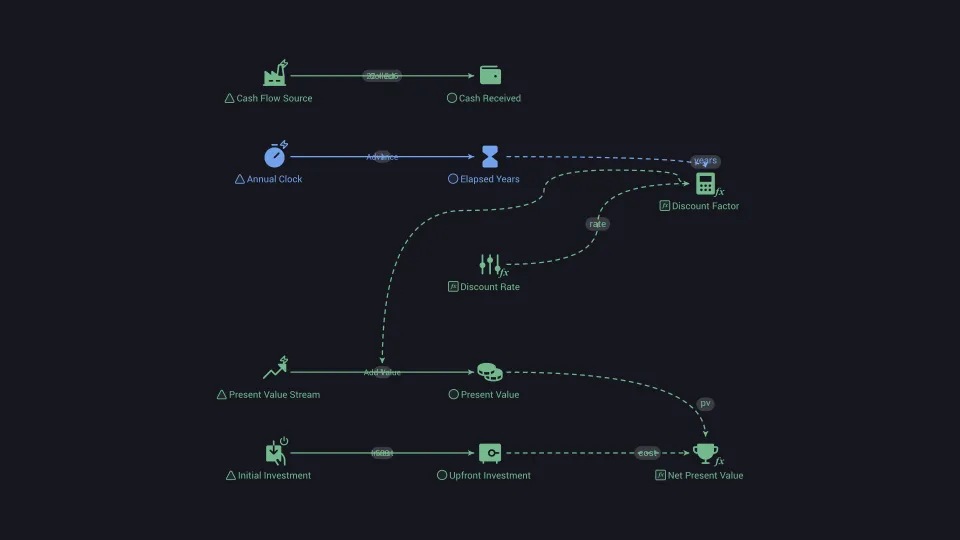
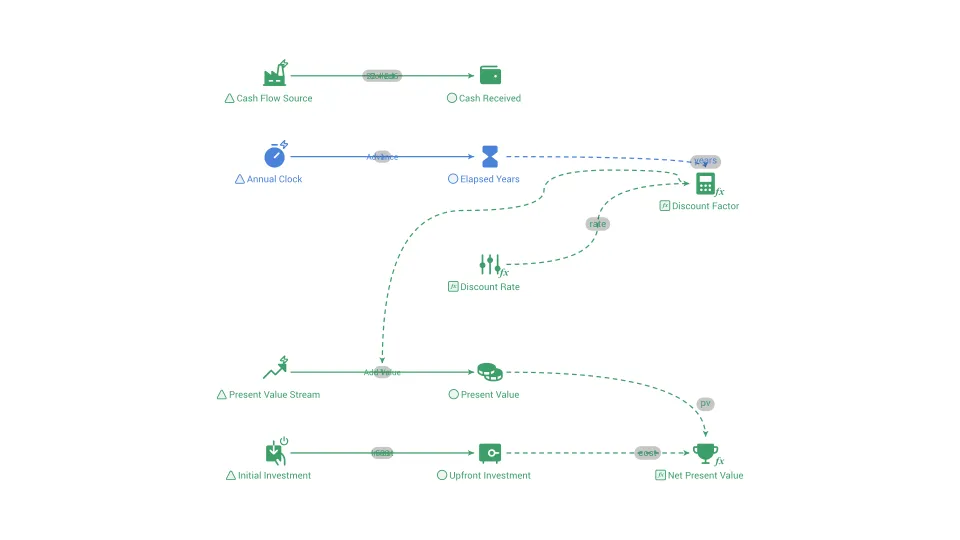
Net present value
The sum of future cash flows, each reduced by a discount rate to its value today, minus the upfront cost.
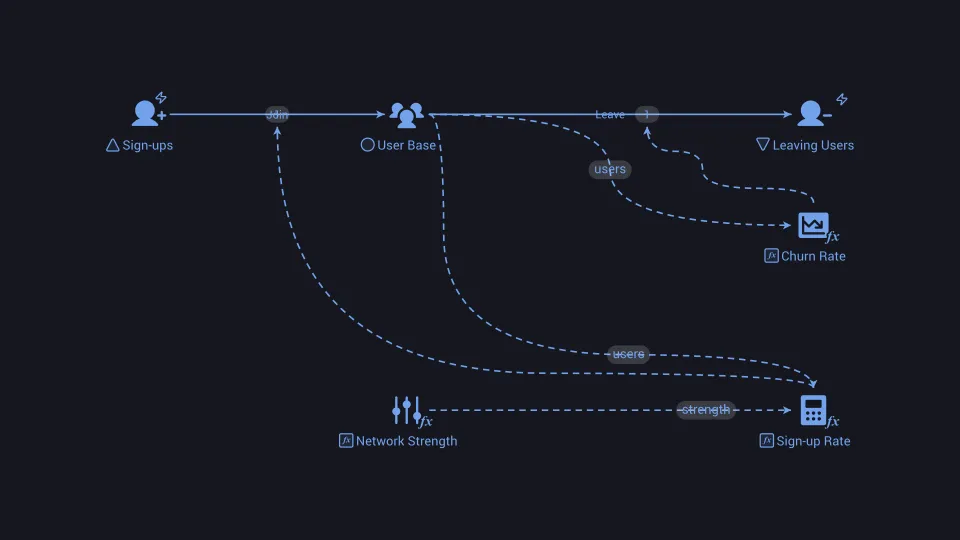
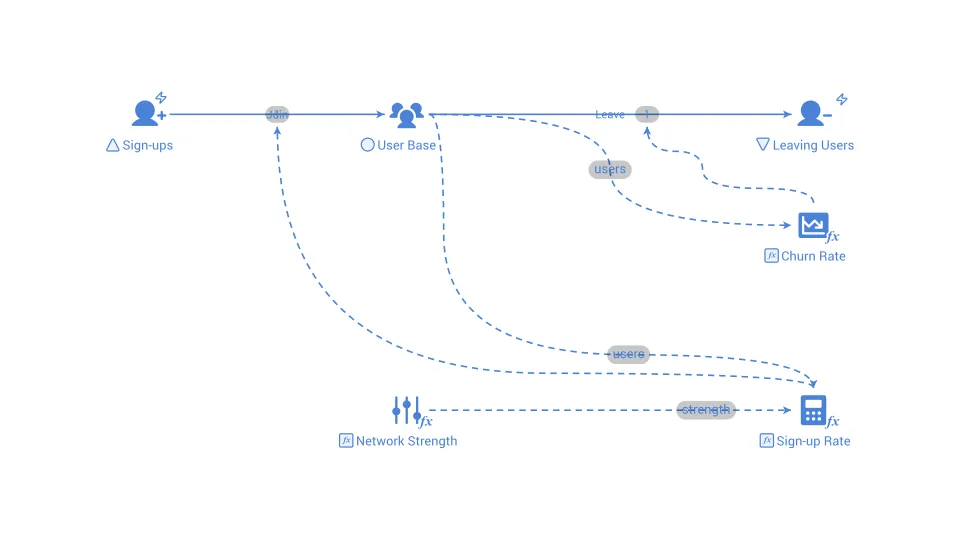
Network effect
The effect where a product or service becomes more valuable to each user as more people join and use it too.
Nonlinearity
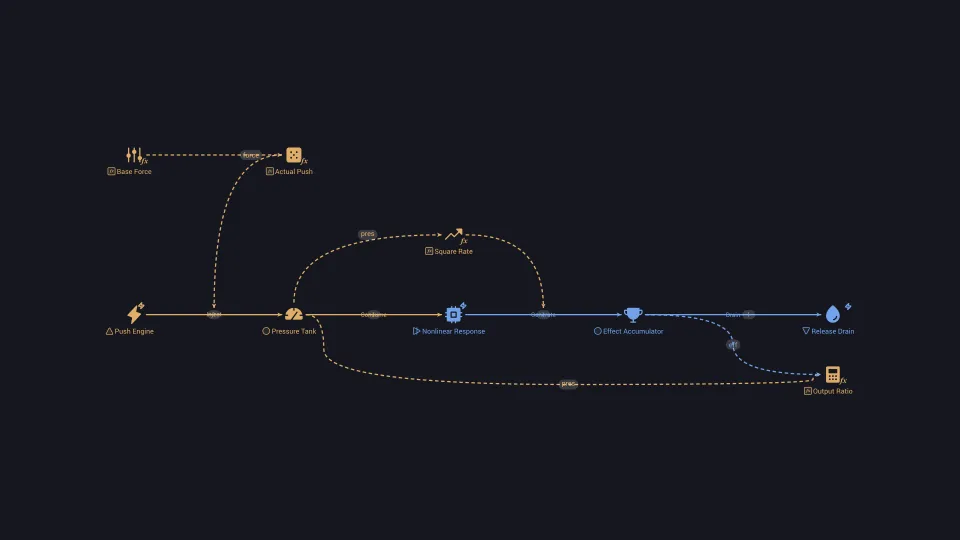
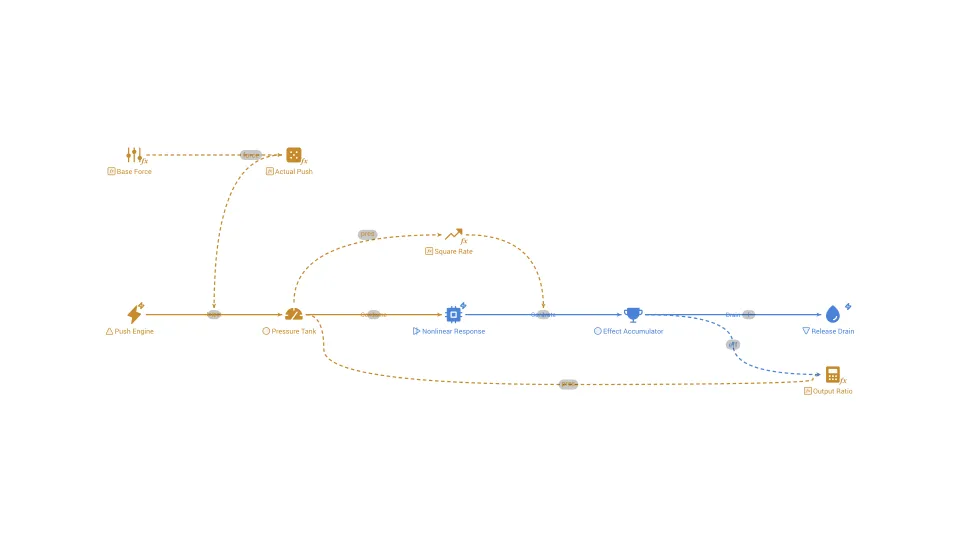
A relationship in which a change in one quantity does not produce a proportional change in another, so effects can be disproportionately large or small.
Normal good
A good for which demand rises when consumer income rises and falls when income falls, which is true of most goods.
Nuance
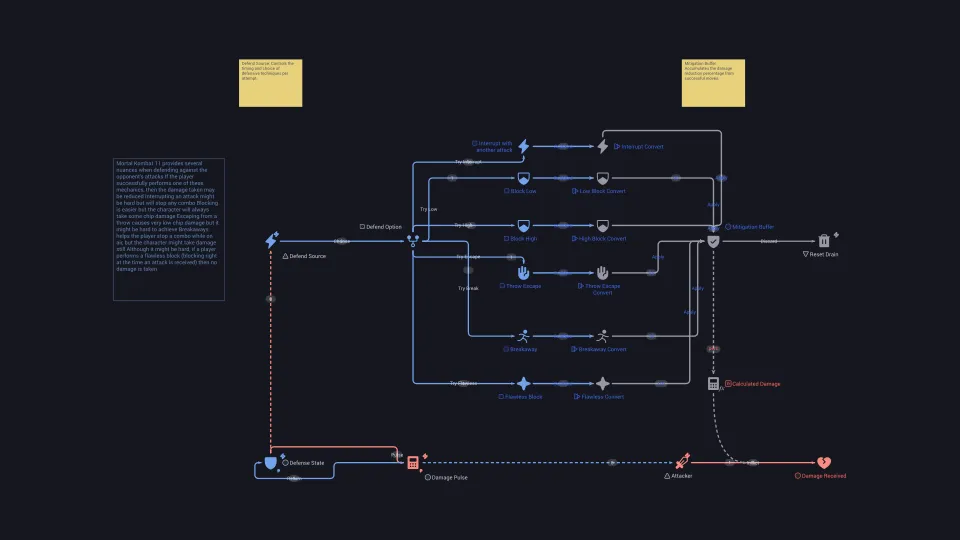
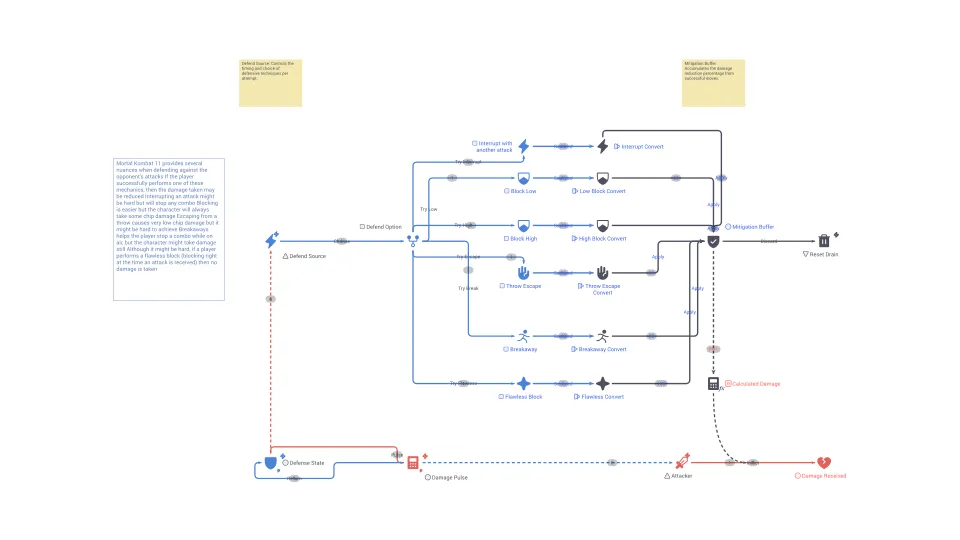
Nuance in game design refers to the subtle and intricate details, variations, or intricacies within gameplay mechanics, systems, or storytelling elements.
Obstacle
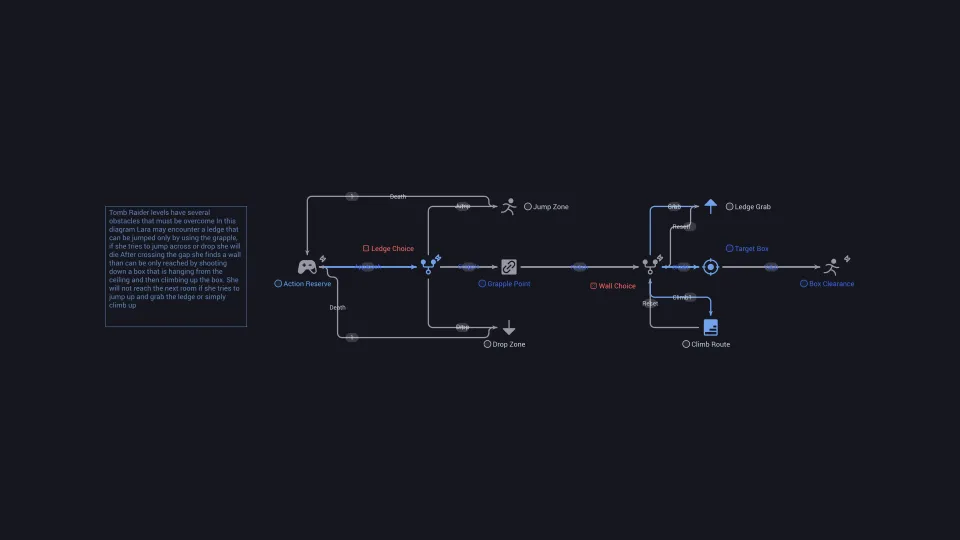
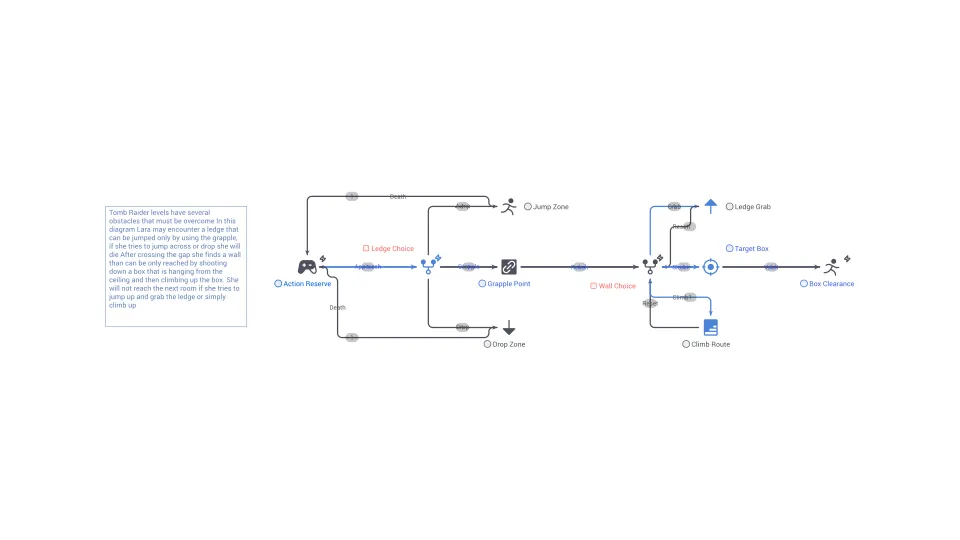
An obstacle in game design refers to a barrier, challenge, or impediment that players must overcome to progress in the game or achieve their objectives.
Opportunity cost
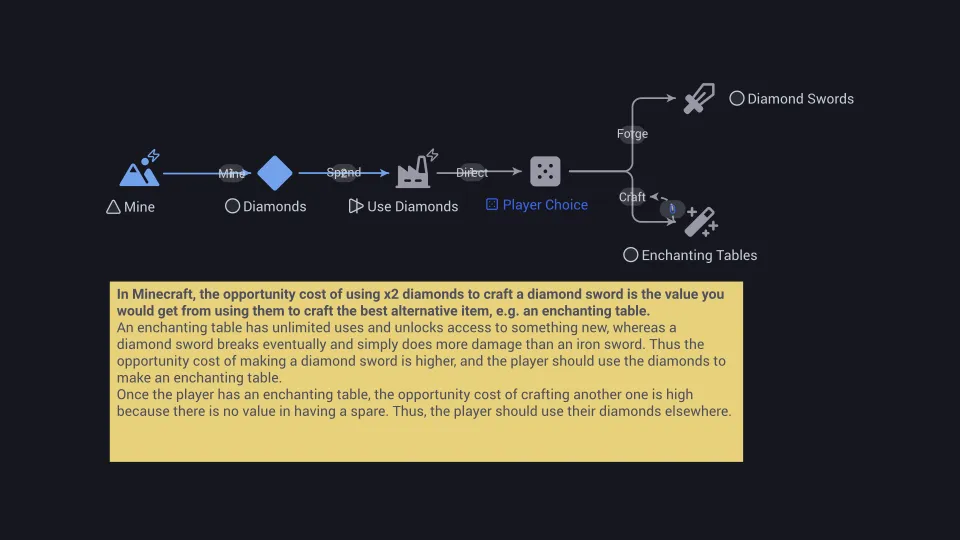
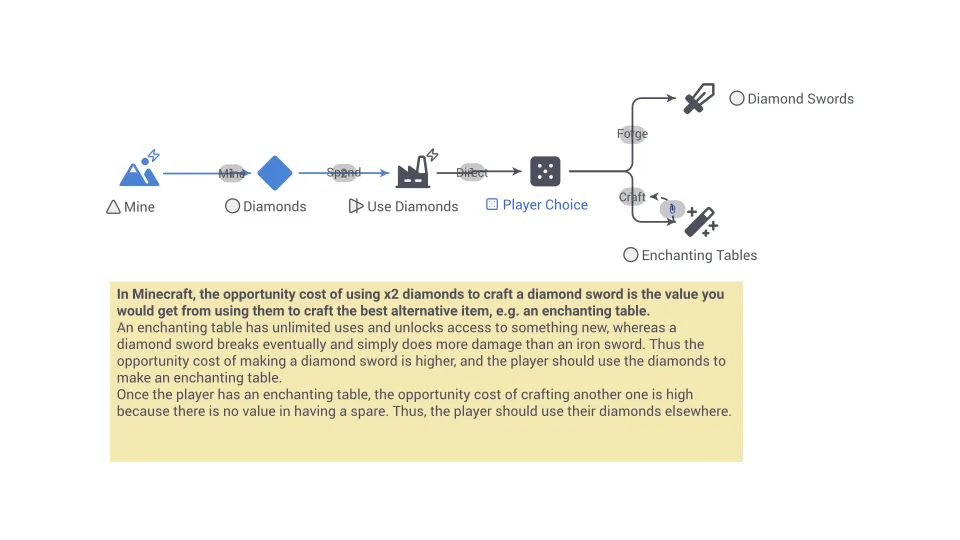
The value of the best alternative that you give up when you choose one option over another with limited resources.
Or-Lock
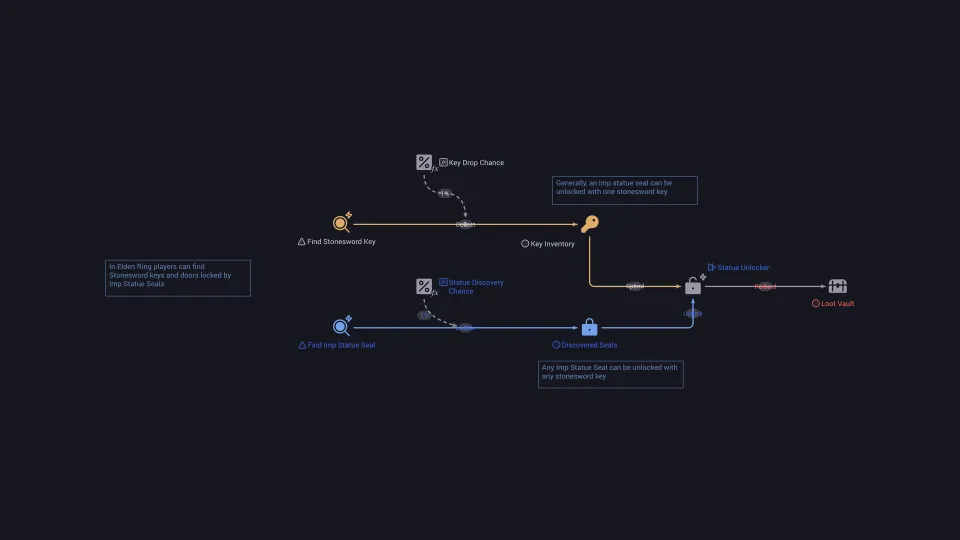
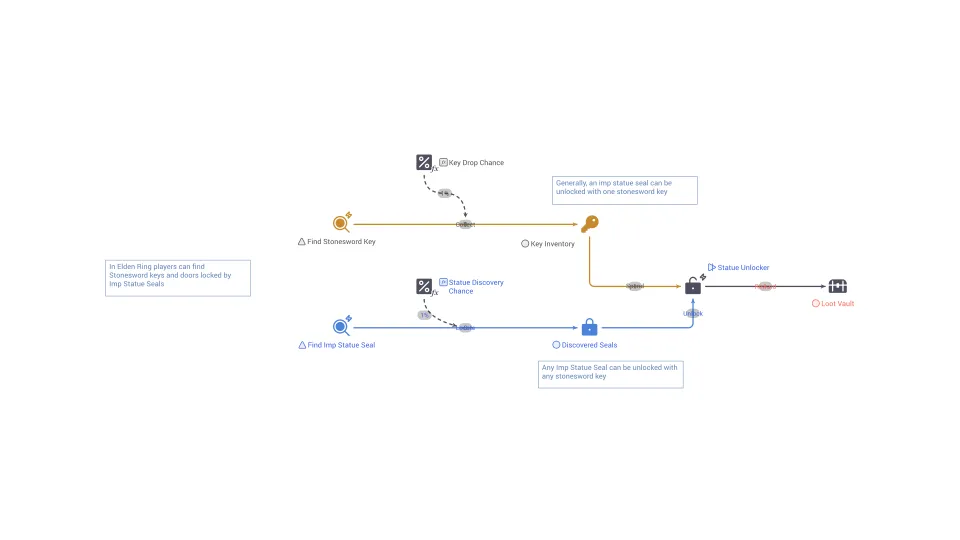
In game design, an Or-Lock refers to a branching decision point or game mechanic that presents players with a mutually exclusive choice or set of options.
Organic key
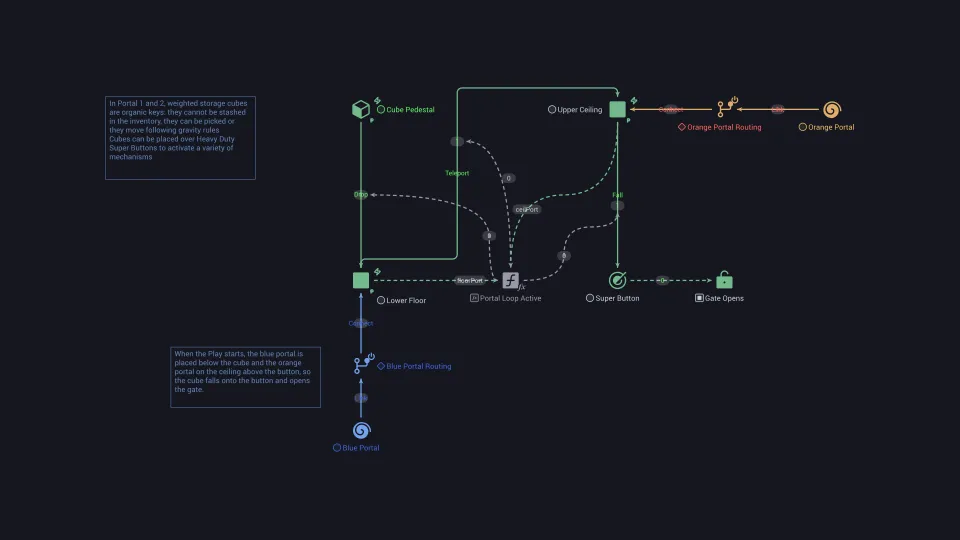
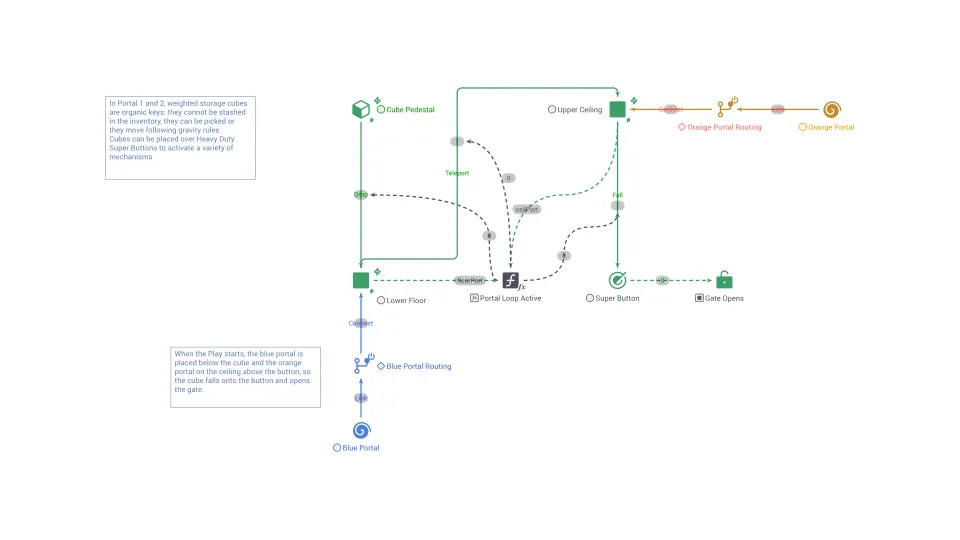
In game design, an Organic Key refers to a gameplay element that is integrated into the game world, serving as a means to unlock or access certain content.
Oscillation
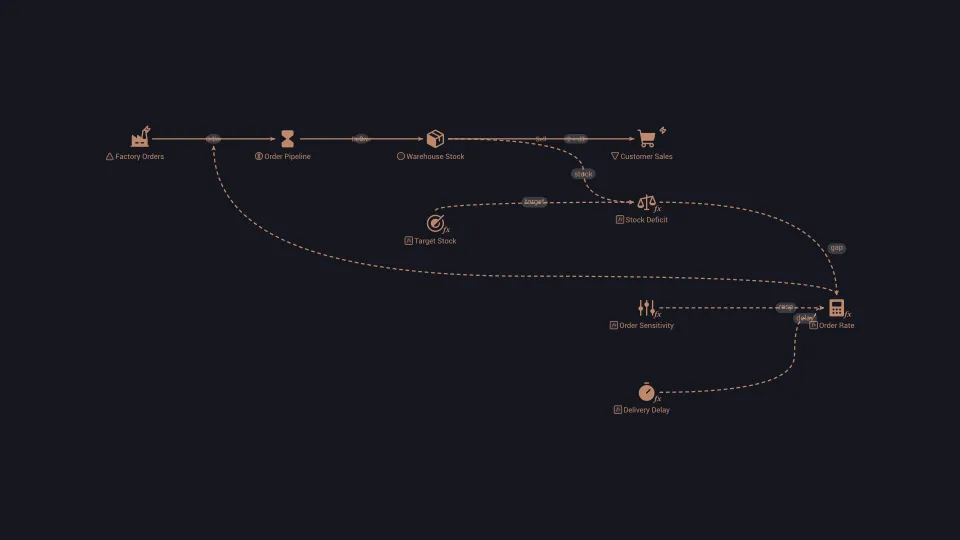
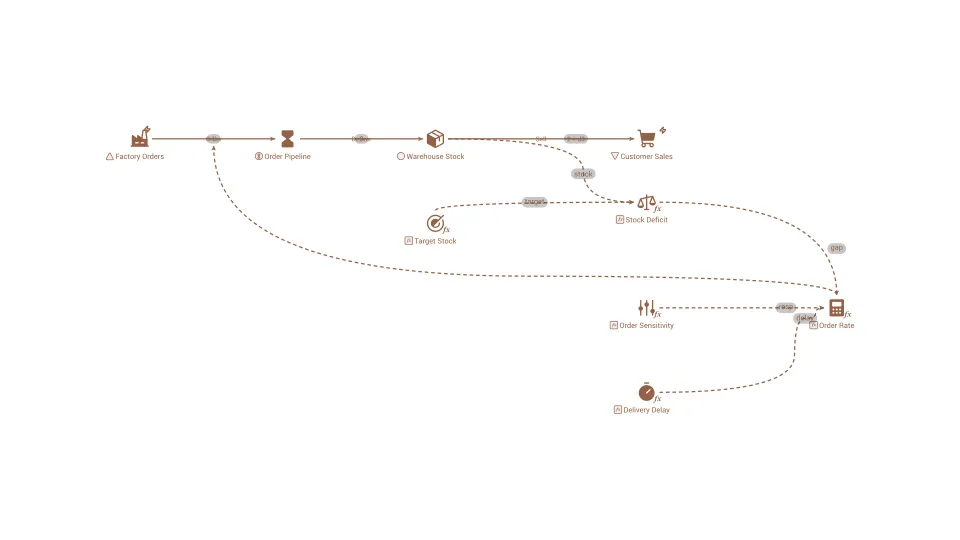
Repeating swings of a quantity above and below a central level, usually caused by a balancing loop that reacts to old information.
Outcome
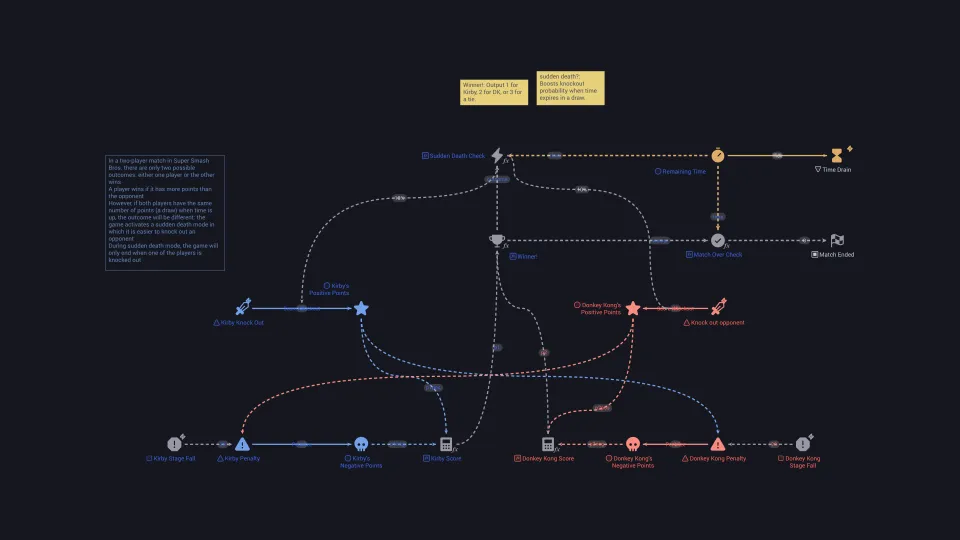
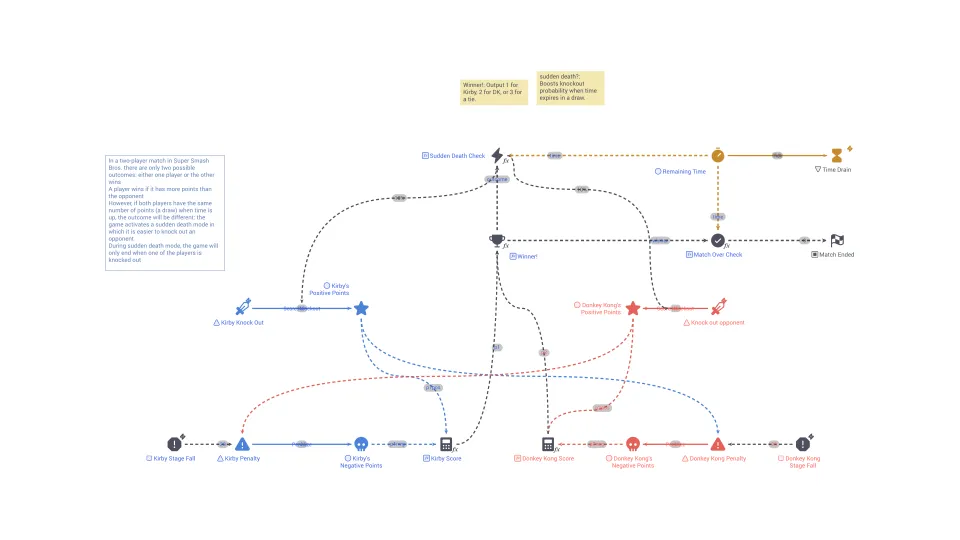
The outcome refers to the result or consequence of player actions, choices, or events within a game.
Overchoice
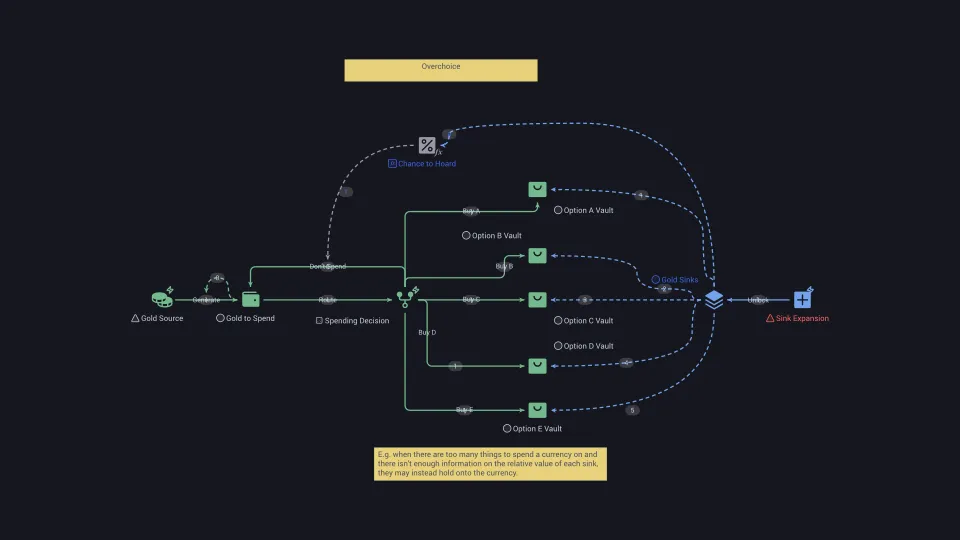
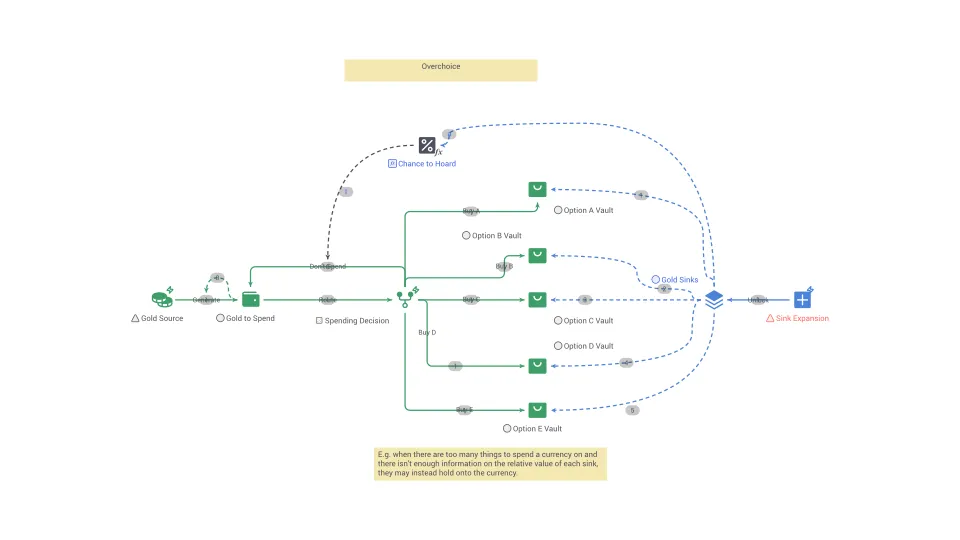
The stress and indecision that people feel when faced with too many options, which can lead them to delay or not choose at all.
Overjustification effect
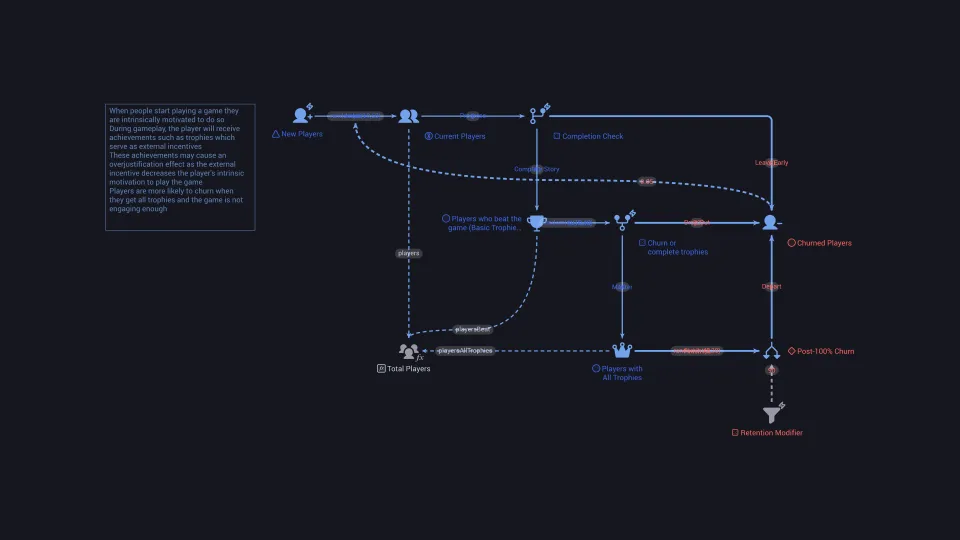
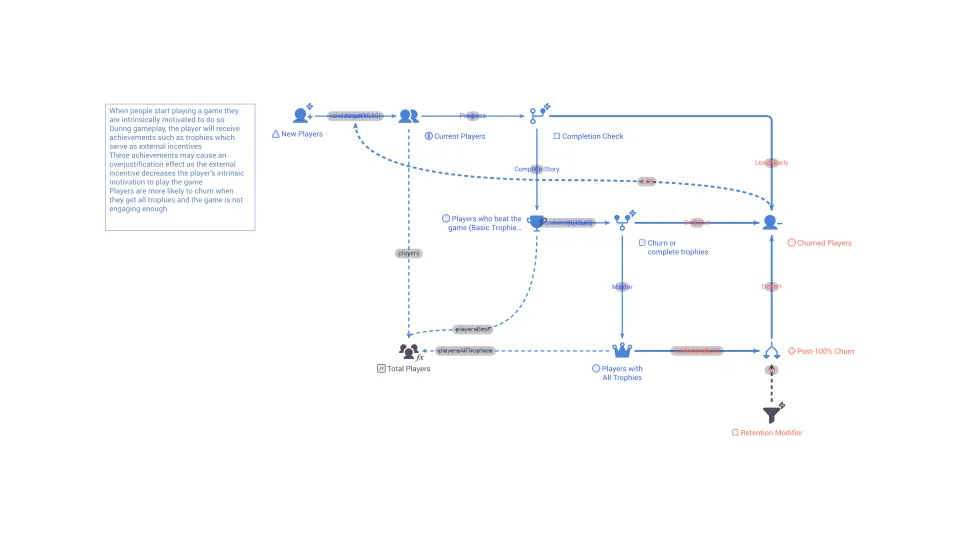
The drop in interest in an activity that happens when people are given outside rewards for something they already enjoyed.
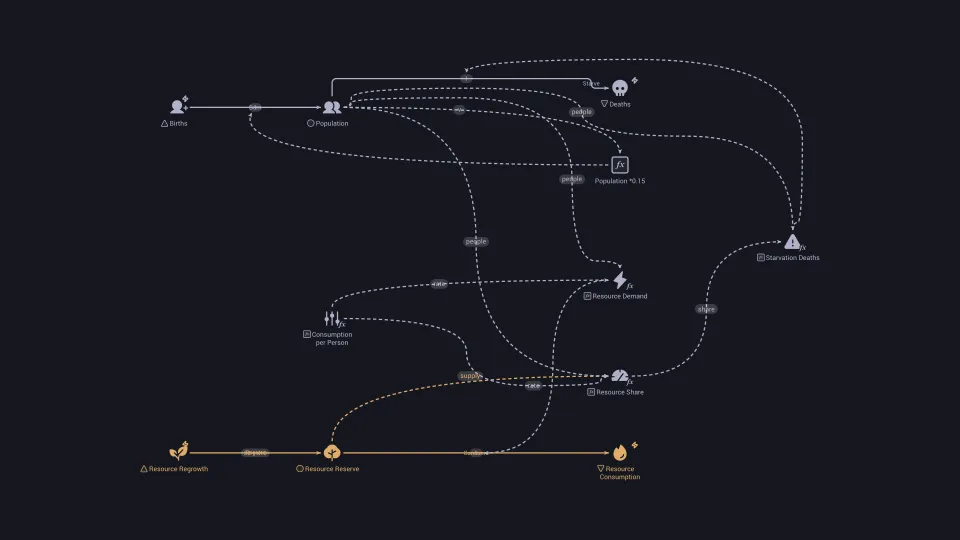
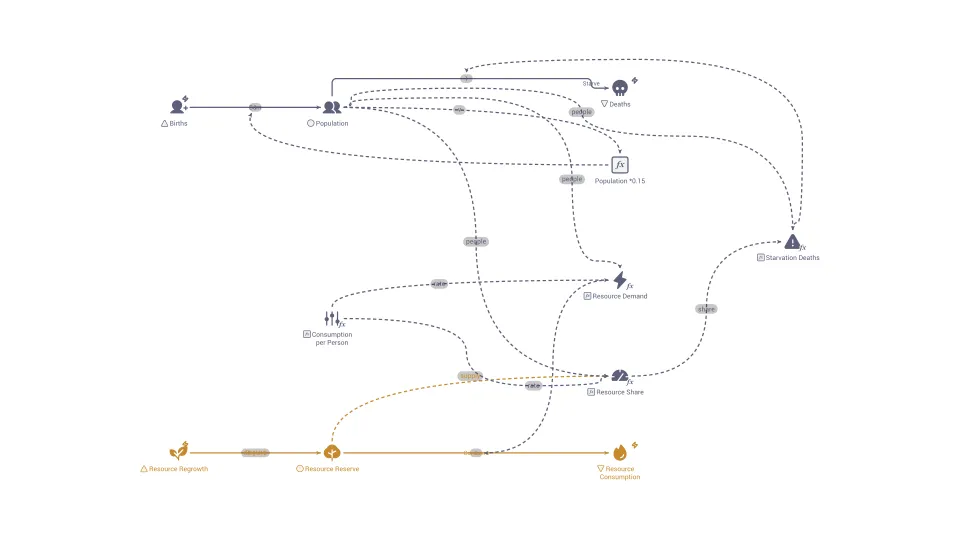
Overshoot and collapse
A pattern in which a system grows past what its resources can sustain, drains them, and then falls back to a level below where it started.
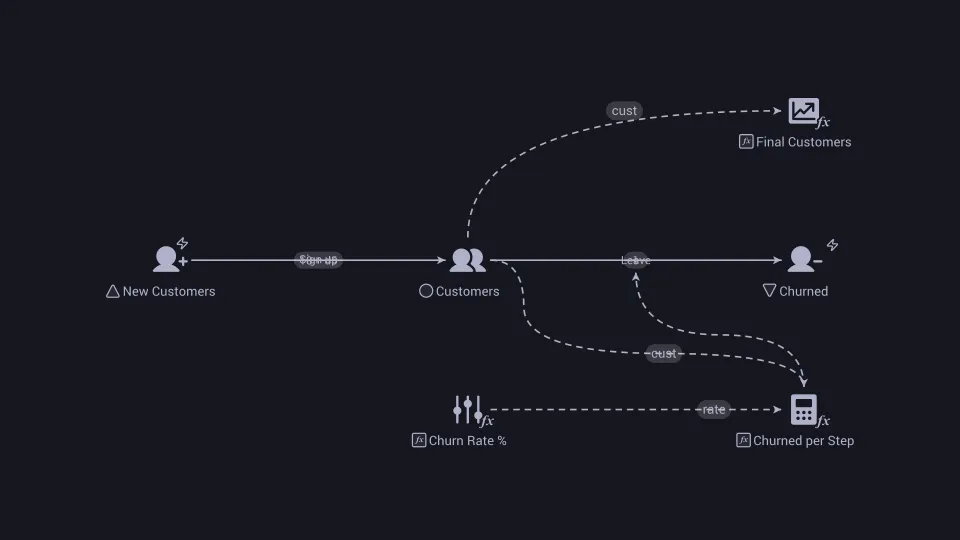
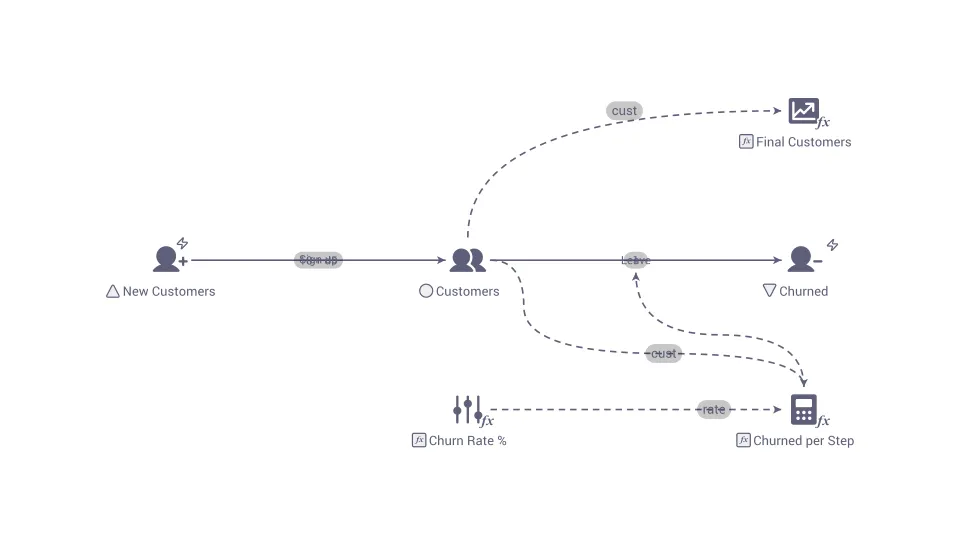
Parameter sweep
Running a model many times while stepping one or more inputs through a range of values to see how the output changes.
Pareto efficiency
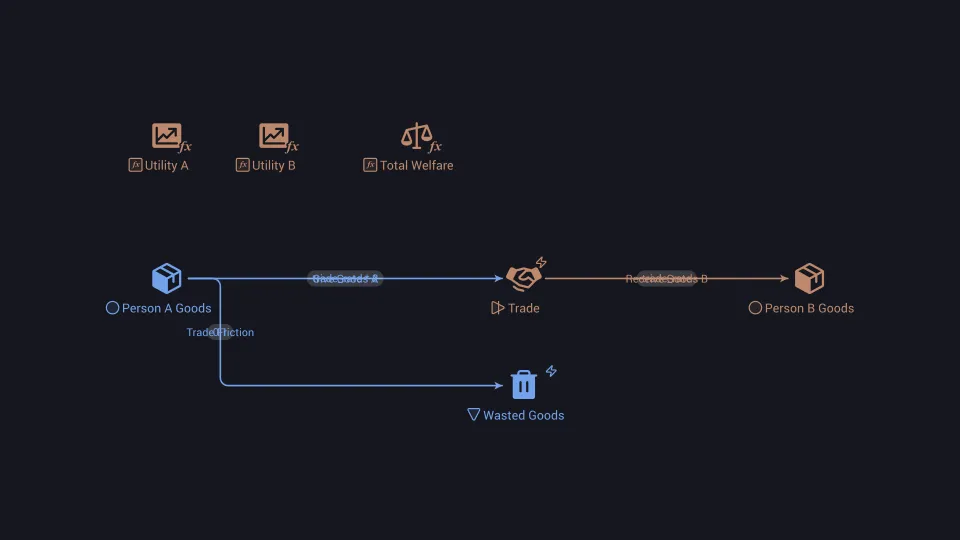
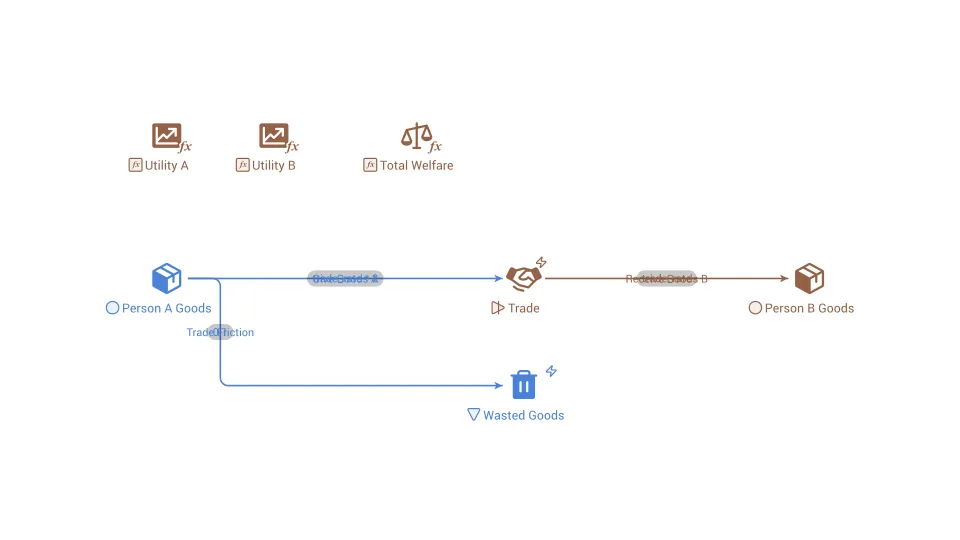
A state of resource allocation in which no one can be made better off without making at least one other person worse off.
Path dependence
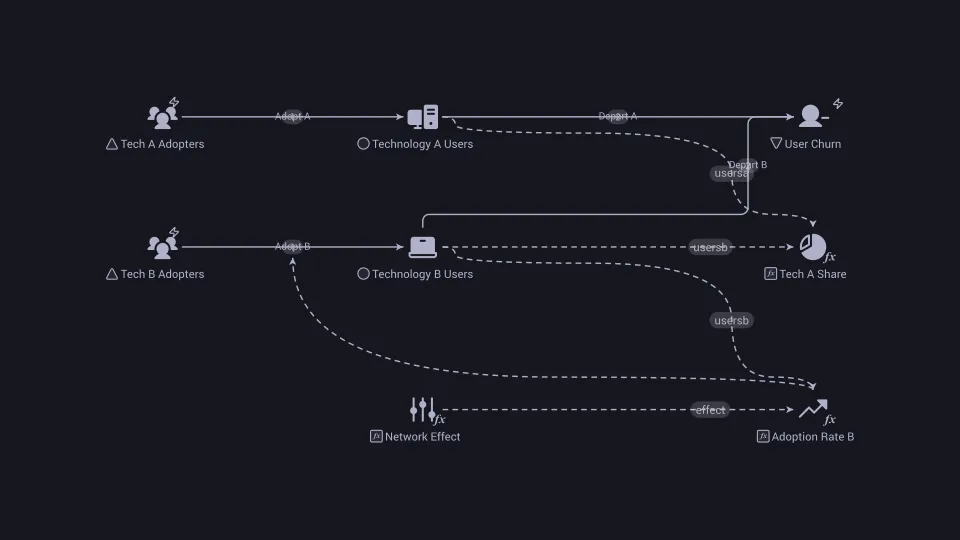
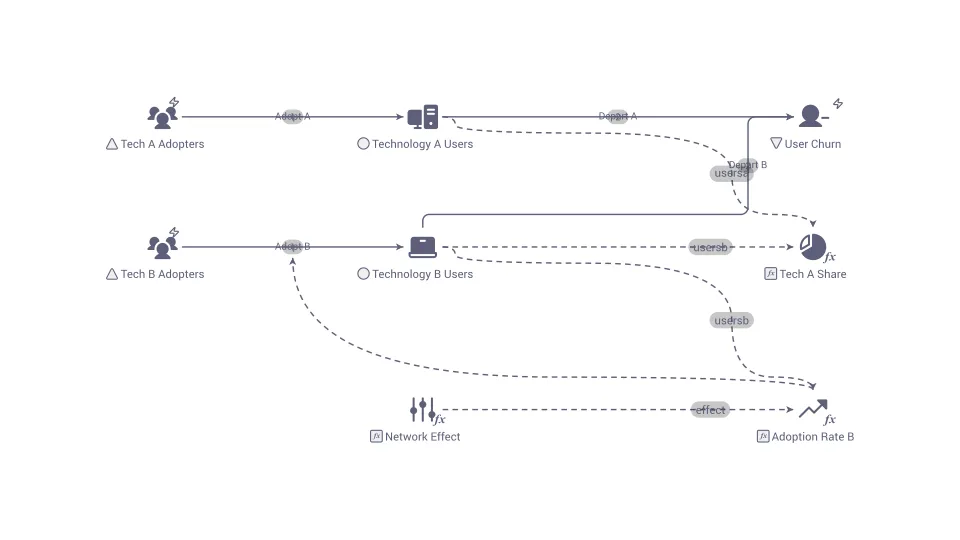
The idea that where a system ends up depends on the sequence of earlier events, so history matters and early choices can lock in.
Patient flow
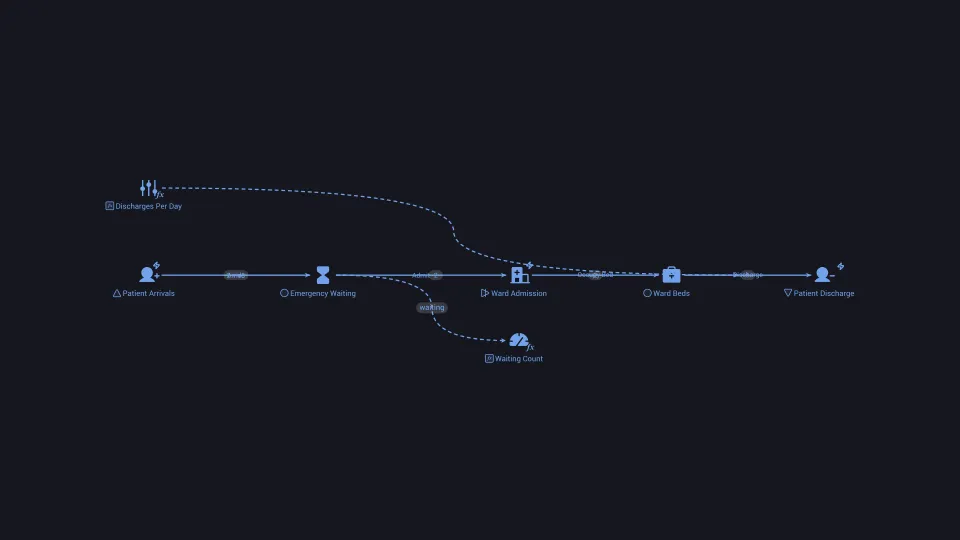
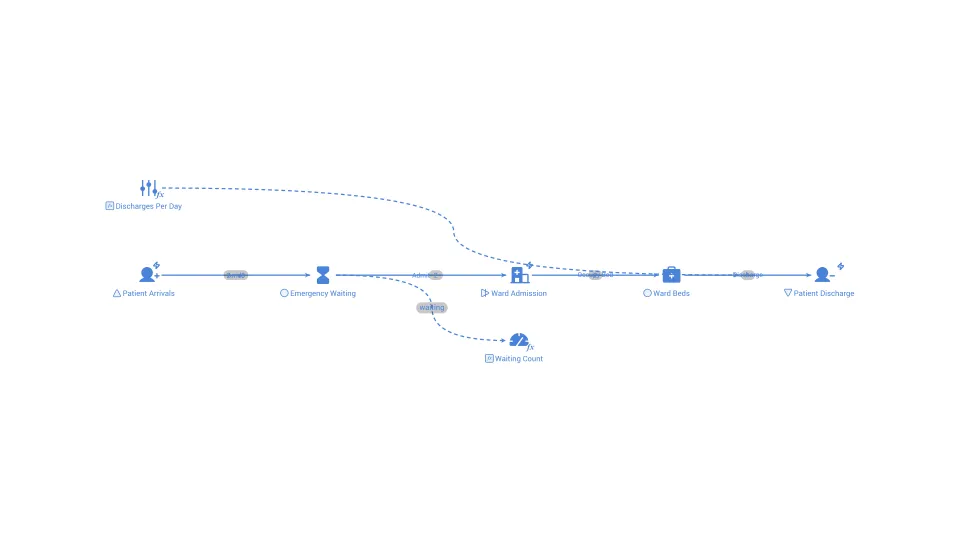
The movement of patients through a healthcare system, from arrival to discharge, and the speed and delays along the way.
Payback period
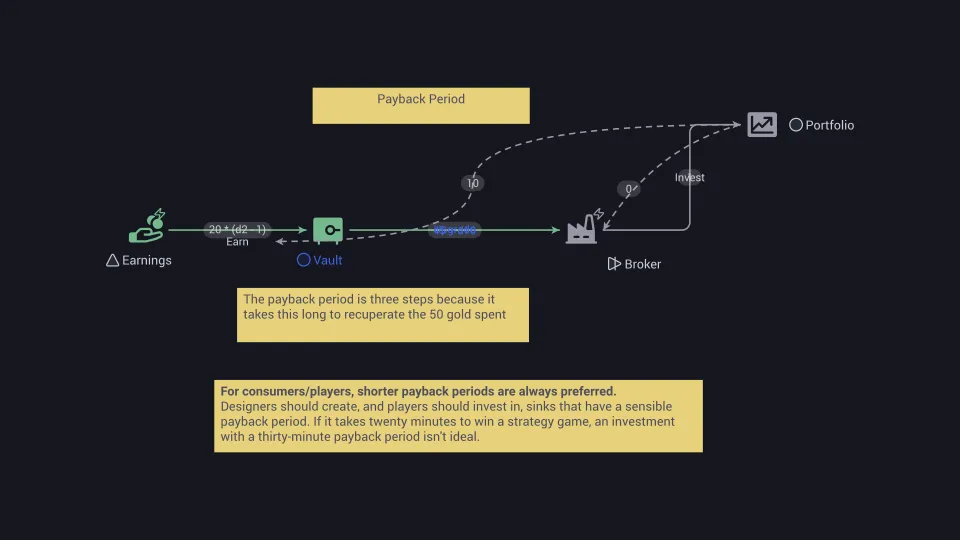
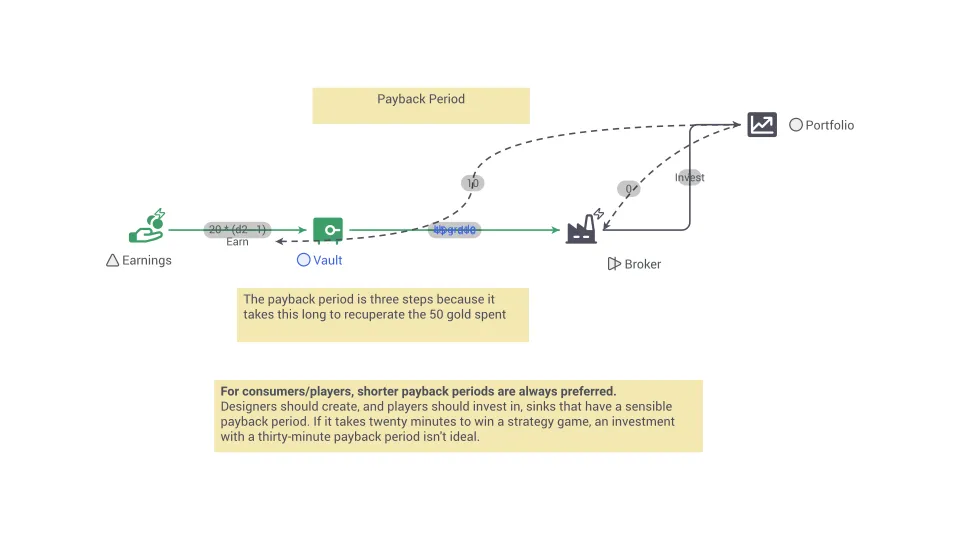
The length of time it takes for the returns from an investment to add up to the amount that was first put in.
Peak demand
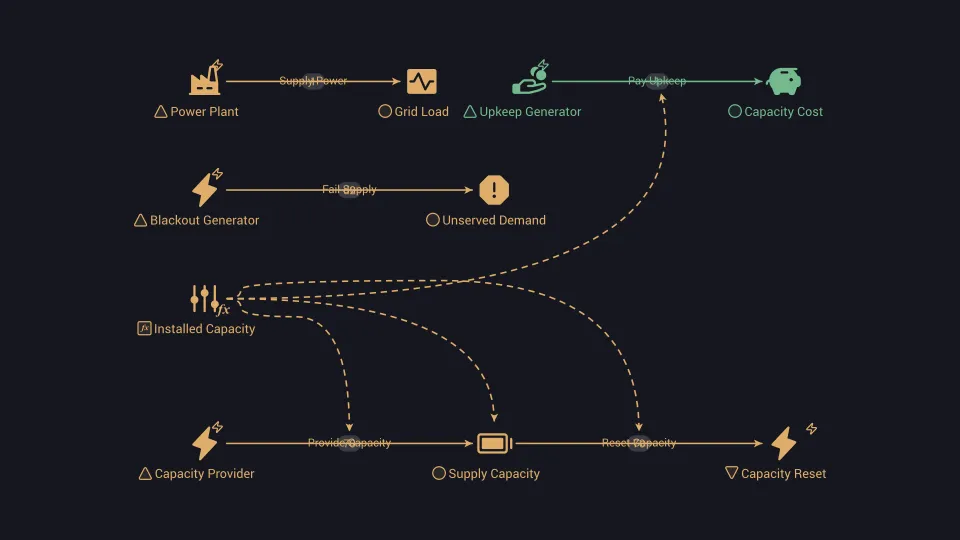
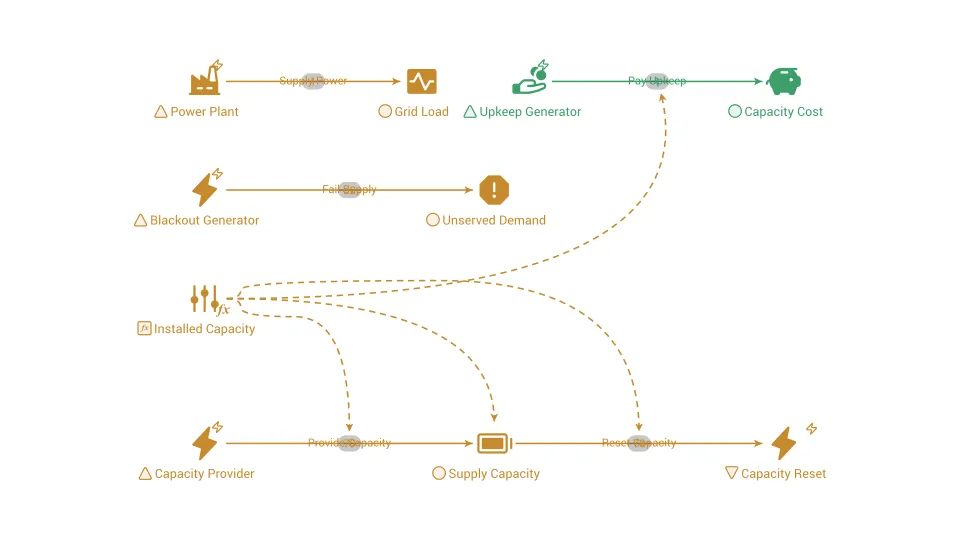
The highest level of demand that a system, such as a power grid or a network, must meet within a given period.
Perverse incentive
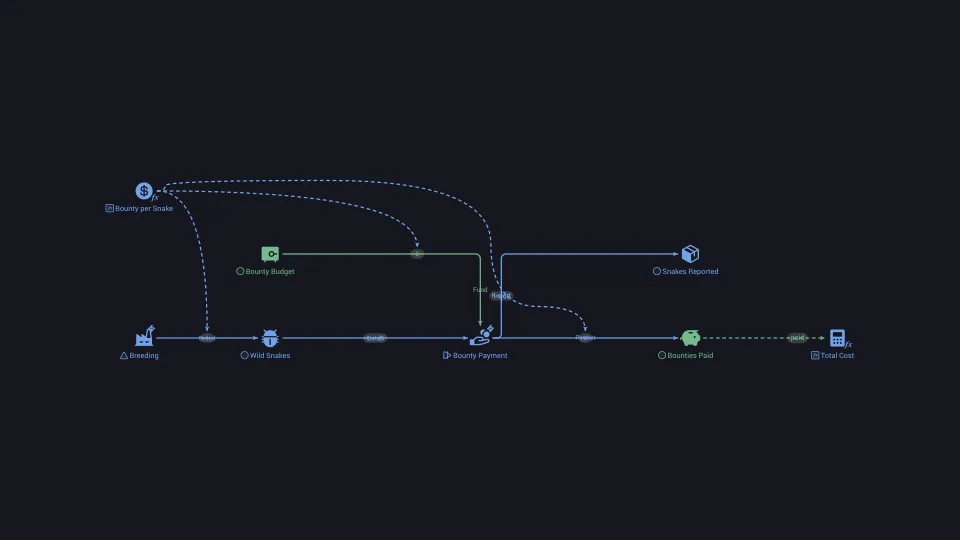
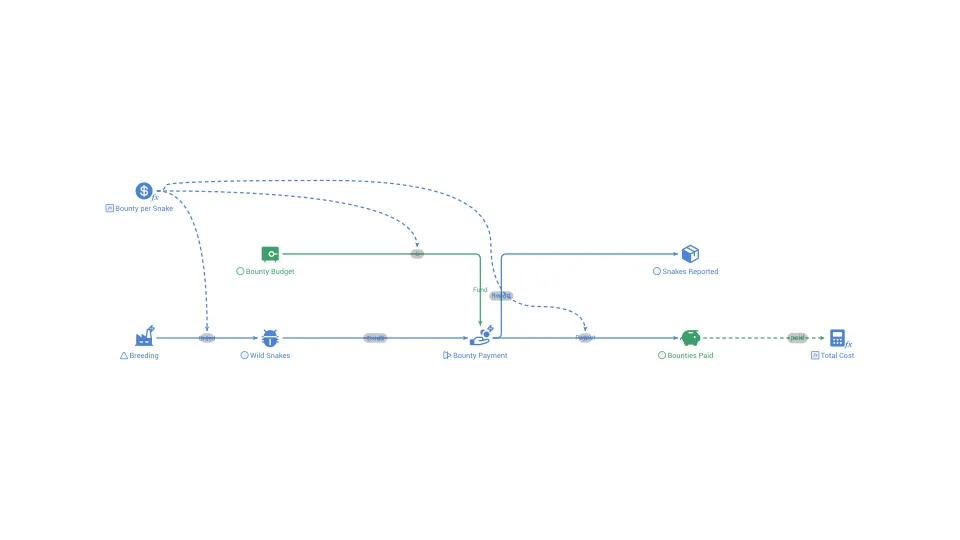
An incentive that rewards the opposite of what its designer wanted, so the rule backfires.
Pigeonhole principle
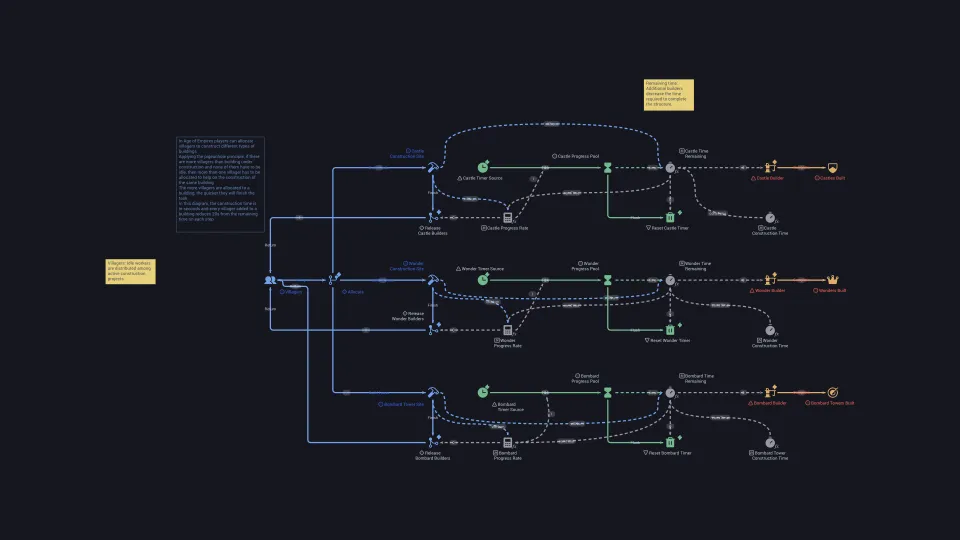
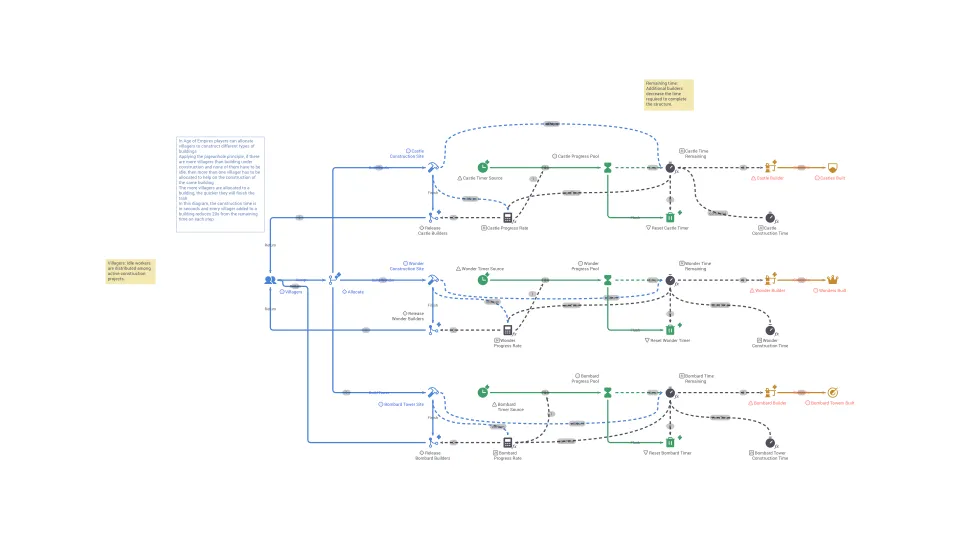
The Pigeonhole Principle refers to a concept where a limited number of options are insufficient to accommodate the variety of possibilities within a game.
Pin
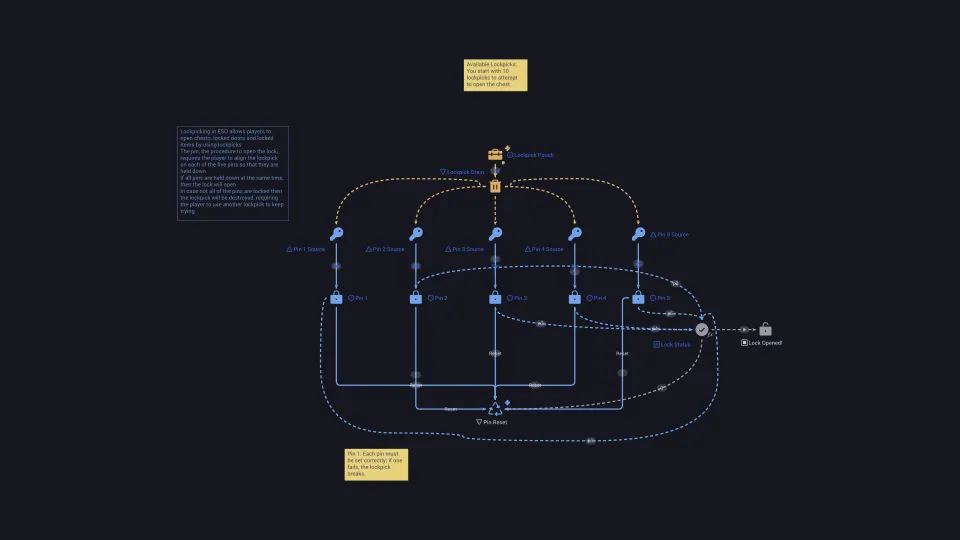
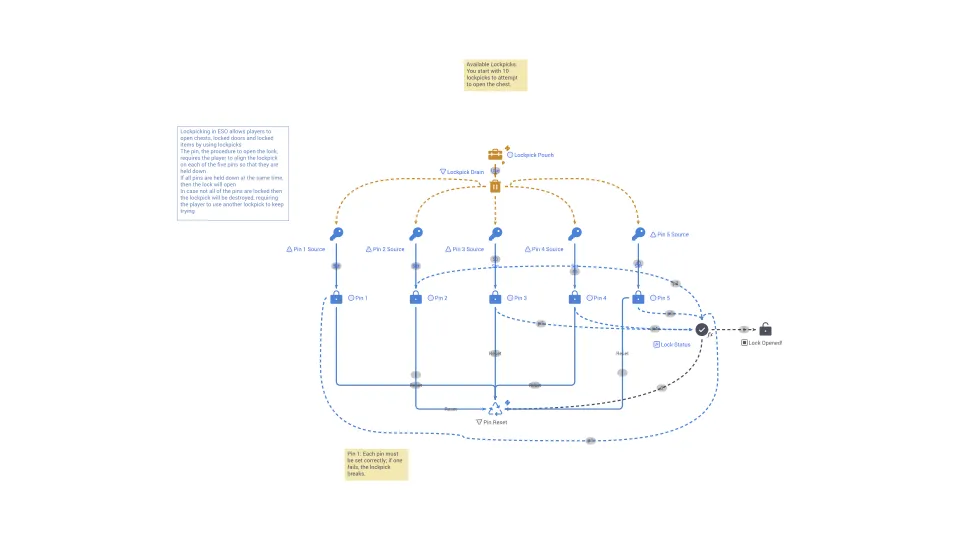
In the context of lockpicking in game design, a "pin" refers to one of the components of a lock mechanism.
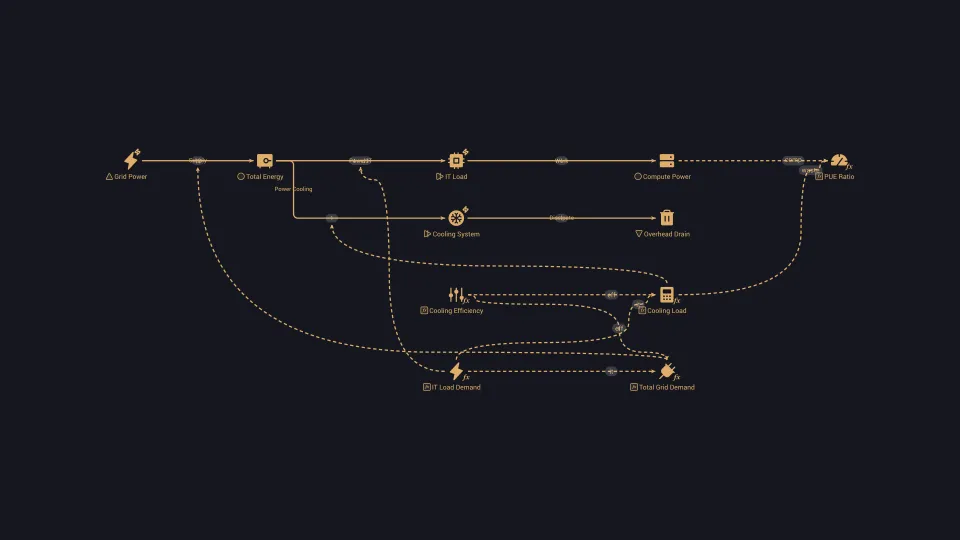
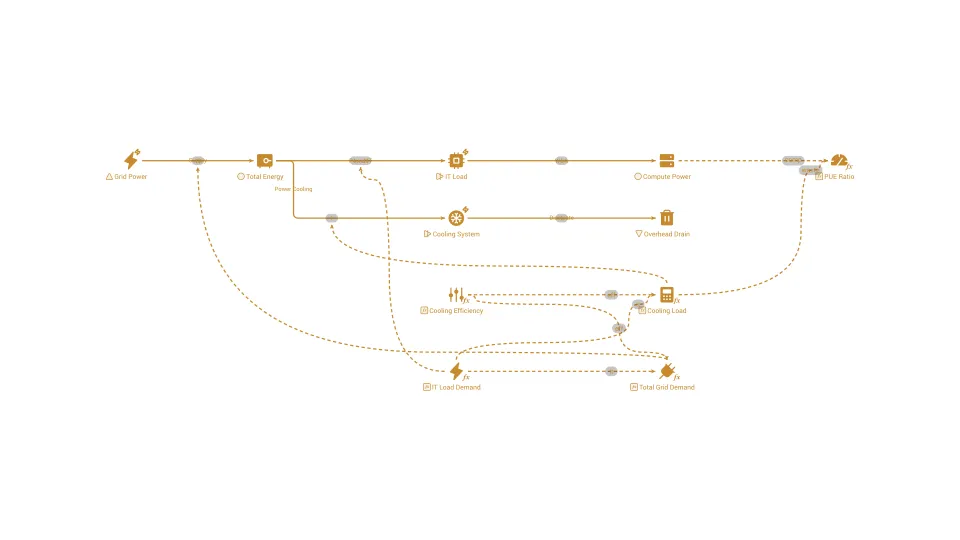
Power usage effectiveness
The ratio of a data center's total energy use to the energy that reaches its computing equipment, where 1.0 means no overhead.
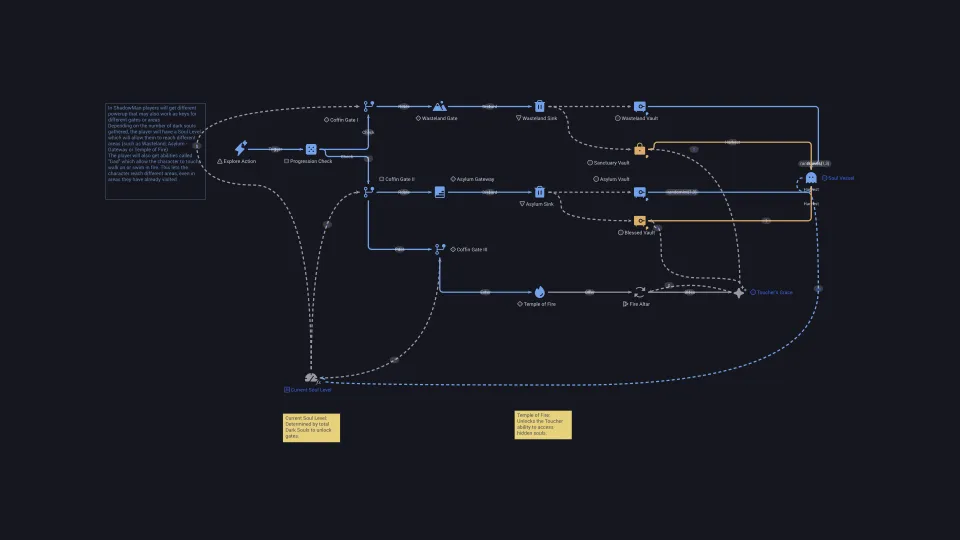
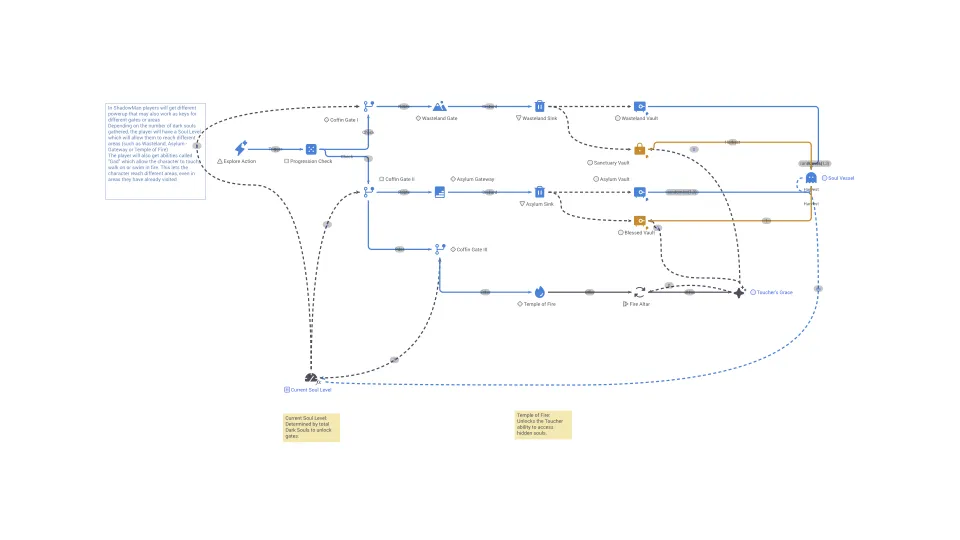
Powerup key
A Powerup Key refers to a game element that grants players temporary or permanent enhancements to their abilities, attributes, or resources within the game.
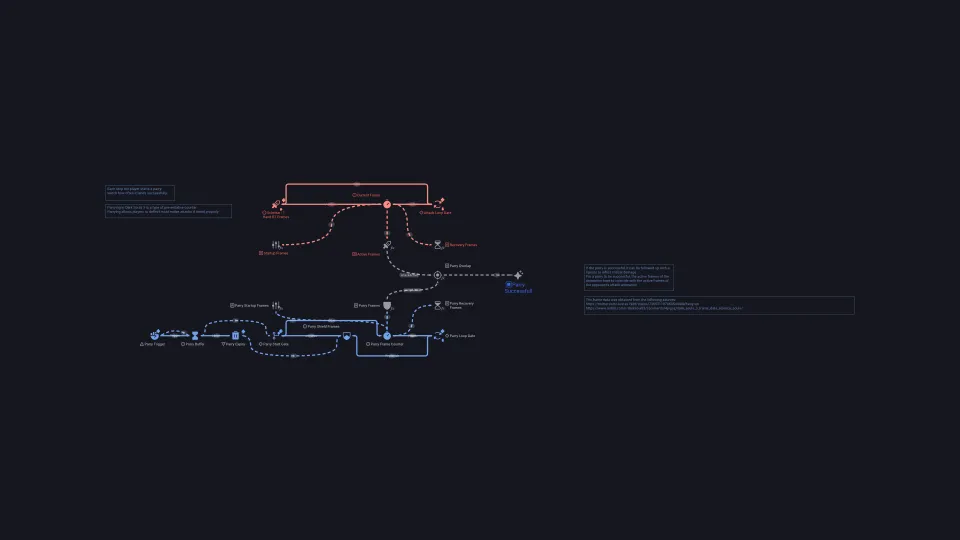
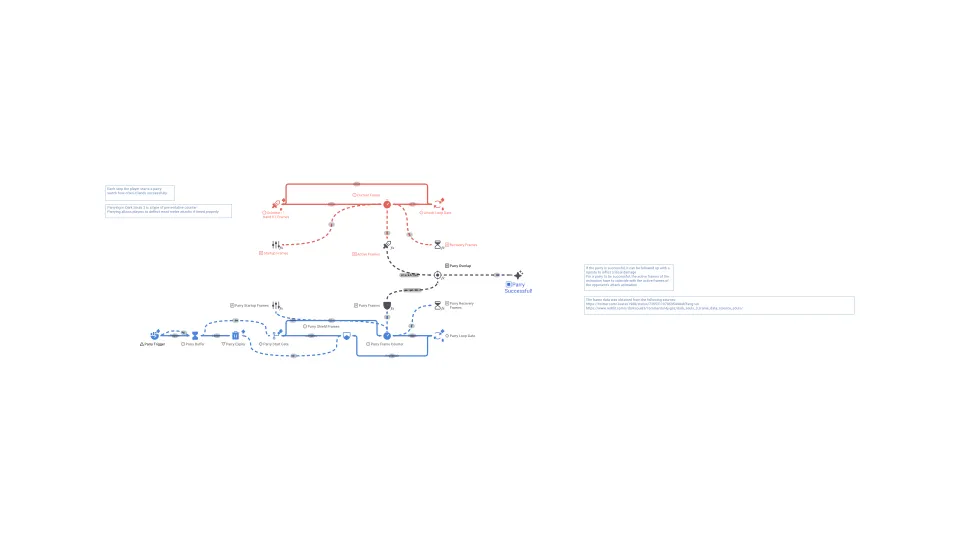
Preventative counter
A preventative counter represents the action of a player or game element to stop a force of contrary motion from ever affecting them.
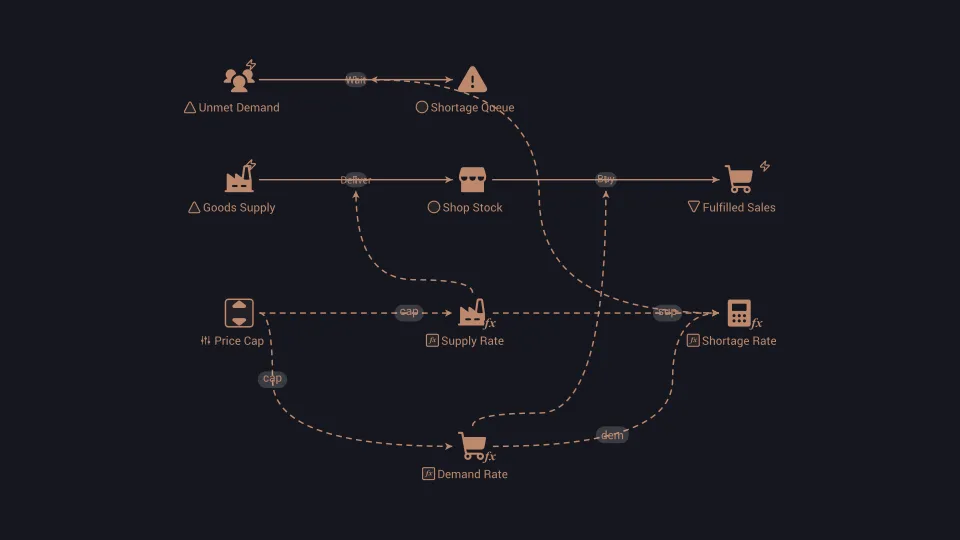
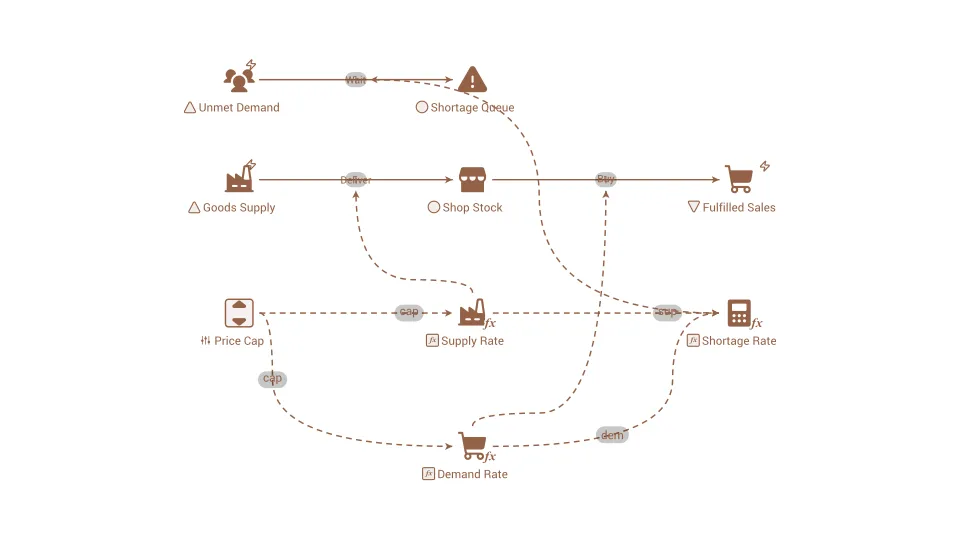
Price ceiling
A legal maximum price that sellers may charge, which holds the price below where supply and demand would settle.
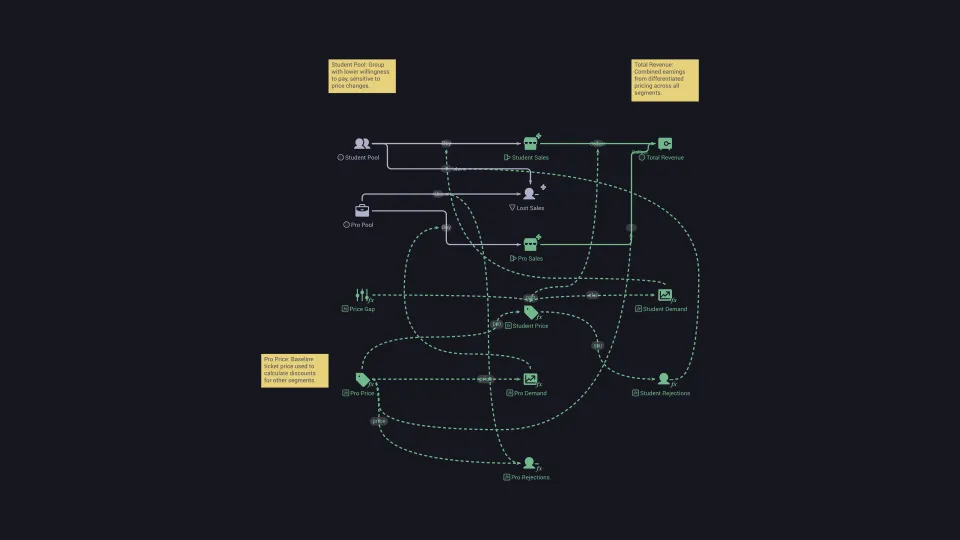
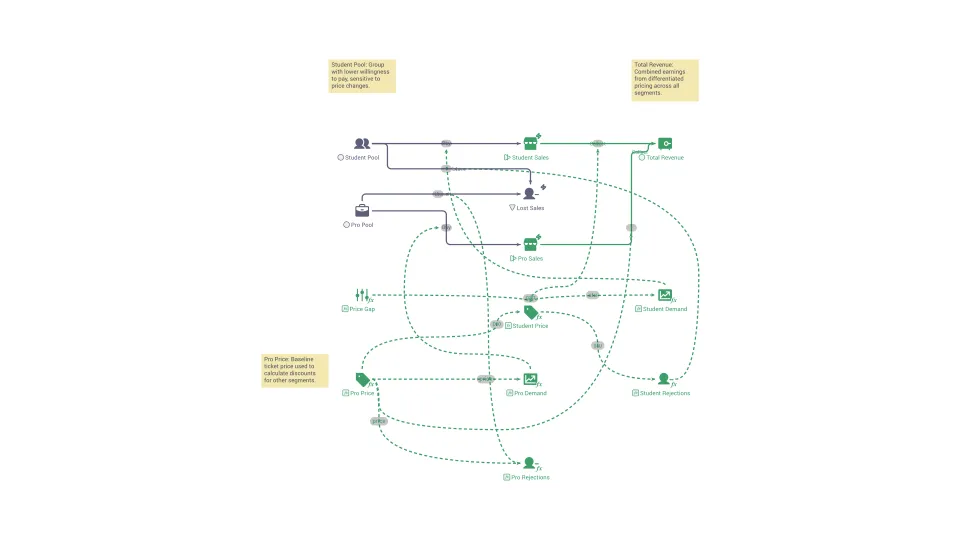
Price discrimination
Charging different customers different prices for the same product, based on what each is willing to pay.
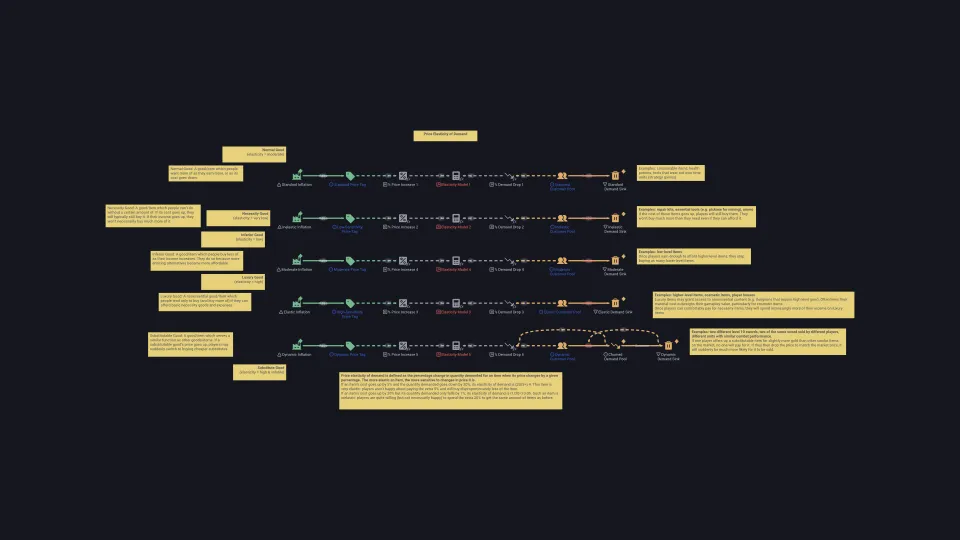
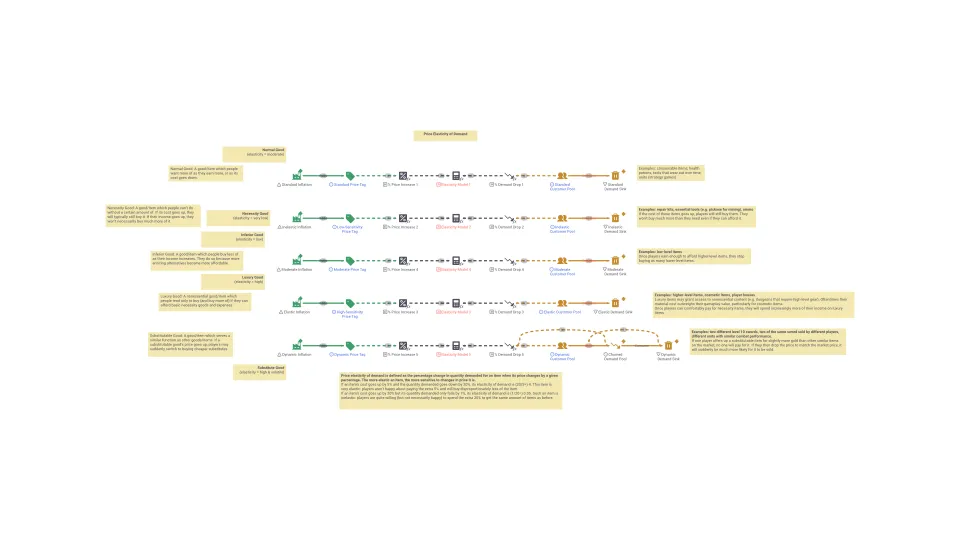
Price elasticity of demand
A measure of how much the quantity demanded of a good changes when its price changes by one percent.
Price floor
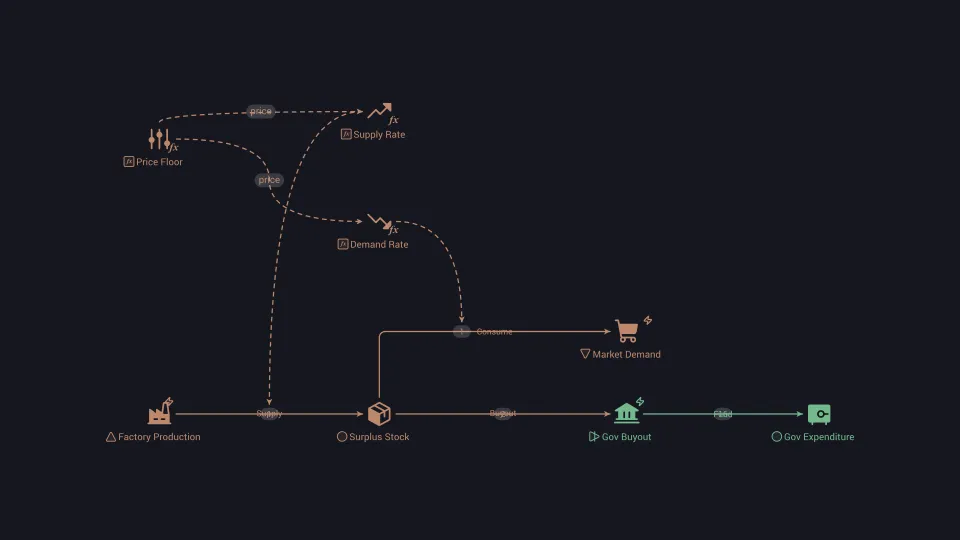
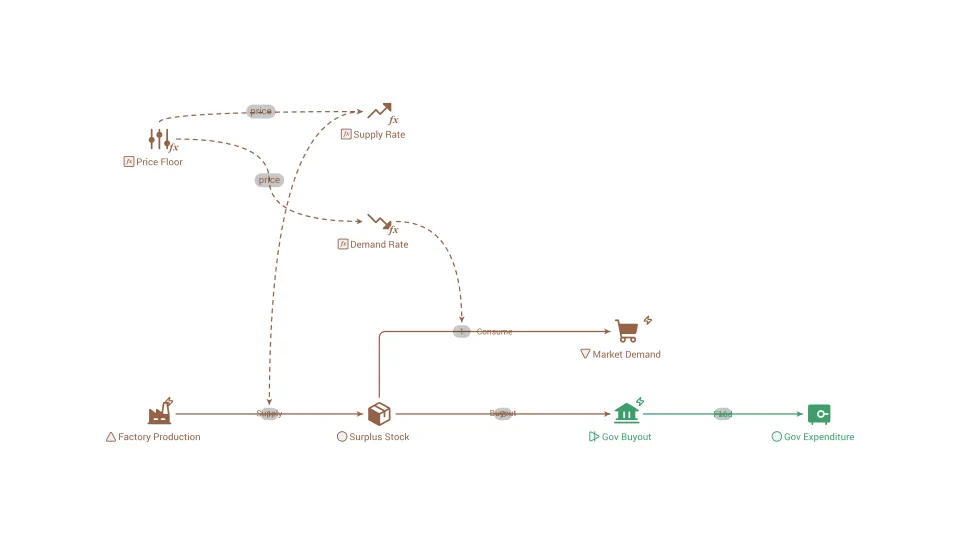
A legal minimum price that sellers must receive, which holds the price above where supply and demand would settle.
Primary mechanic
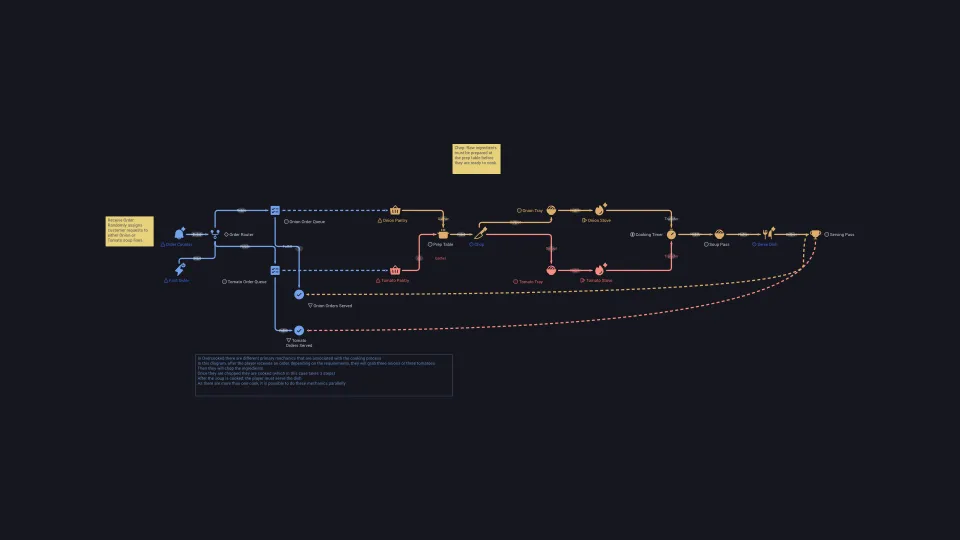
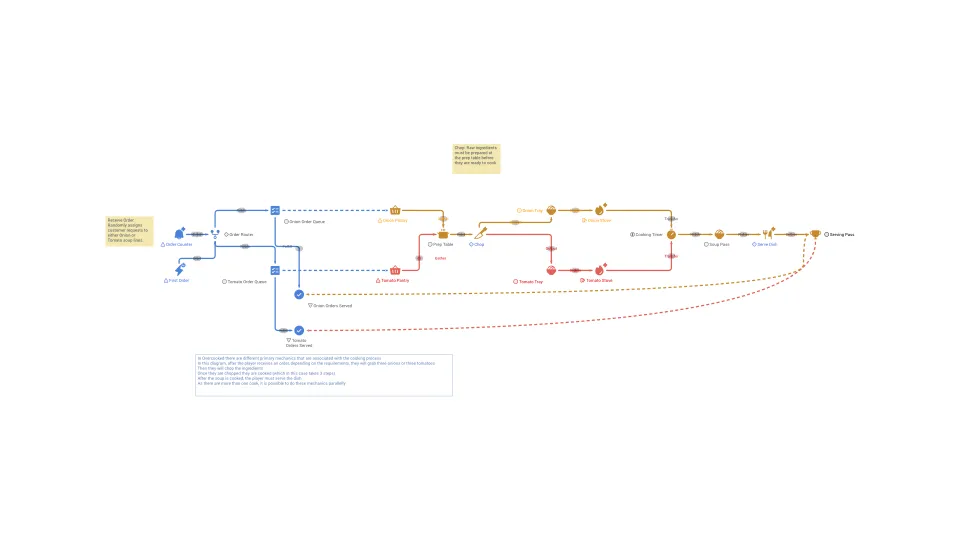
The primary mechanic refers to the core gameplay element or system that forms the foundation of the game experience.
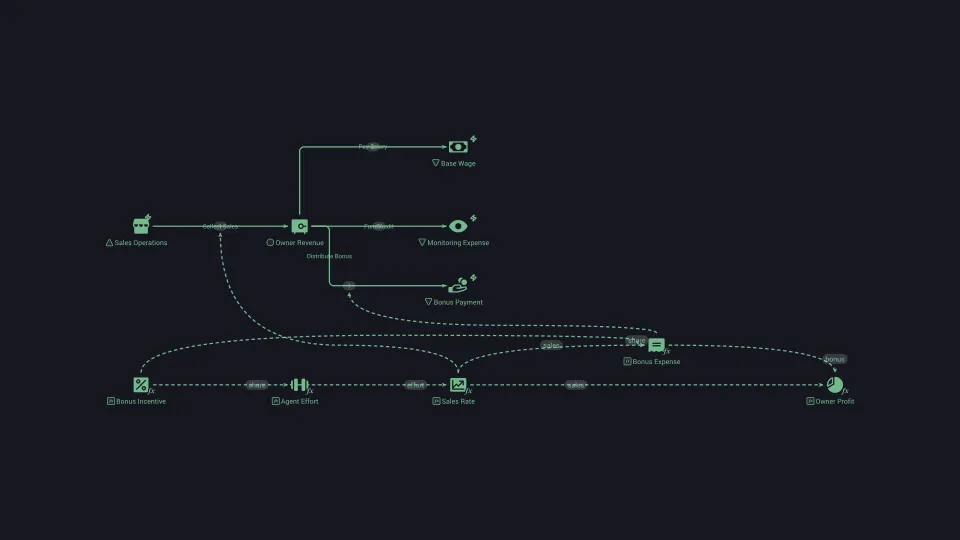
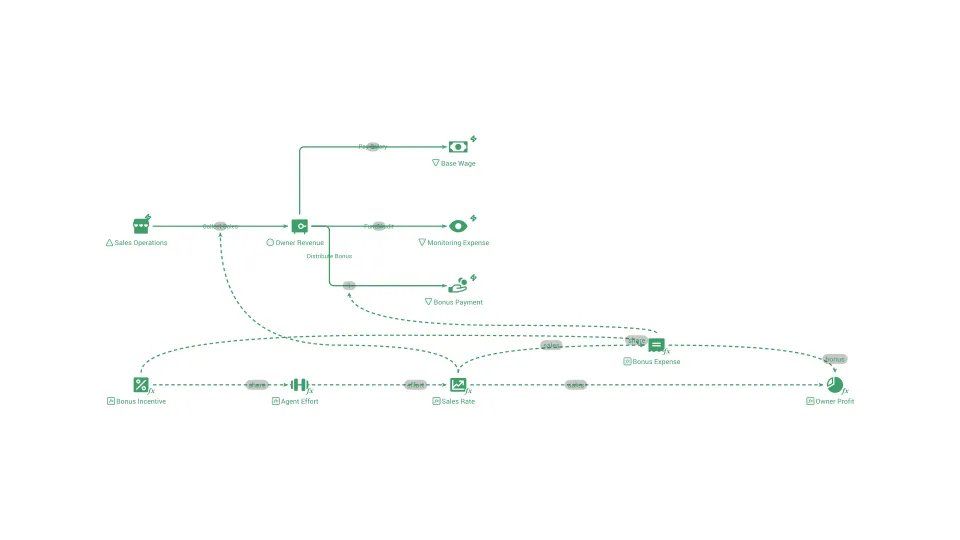
Principal-agent problem
The conflict that arises when one party acts for another but has different interests and knows more about what it is doing.
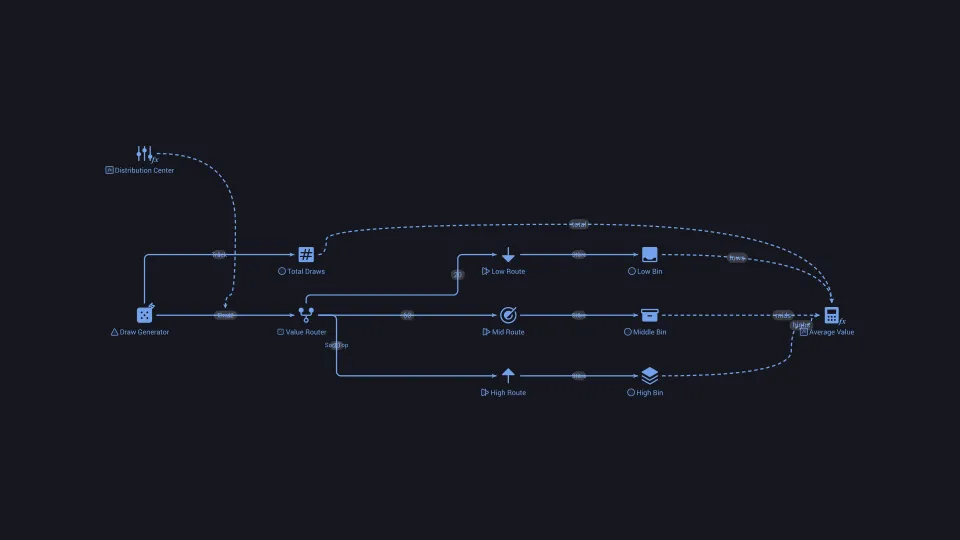
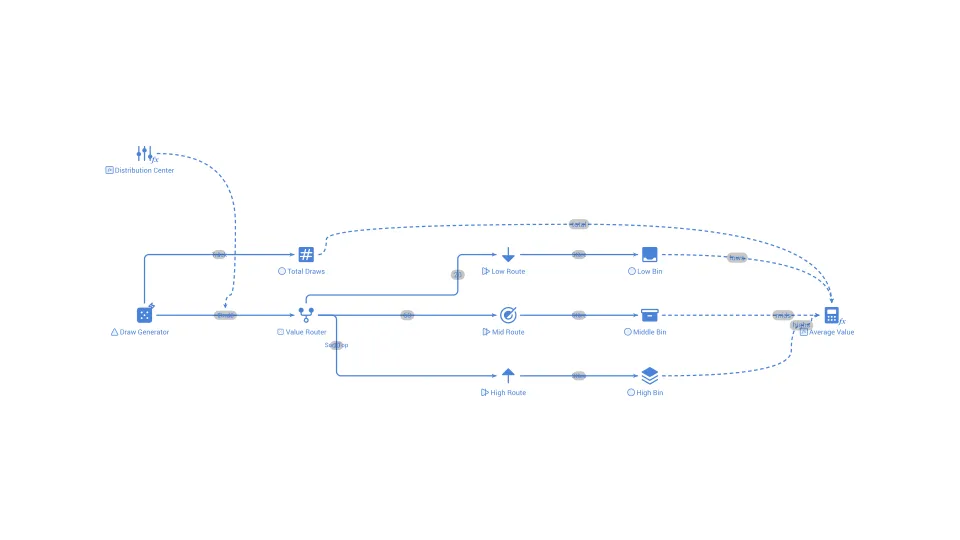
Probability distribution
A description of how likely each possible value of an uncertain quantity is, such as a bell curve, a flat range, or a long tail.
Properties (variation)
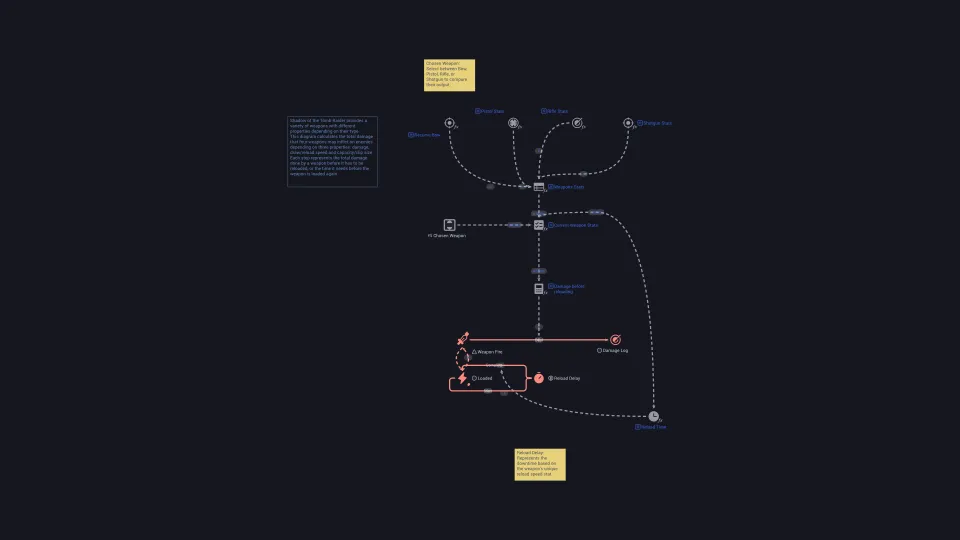
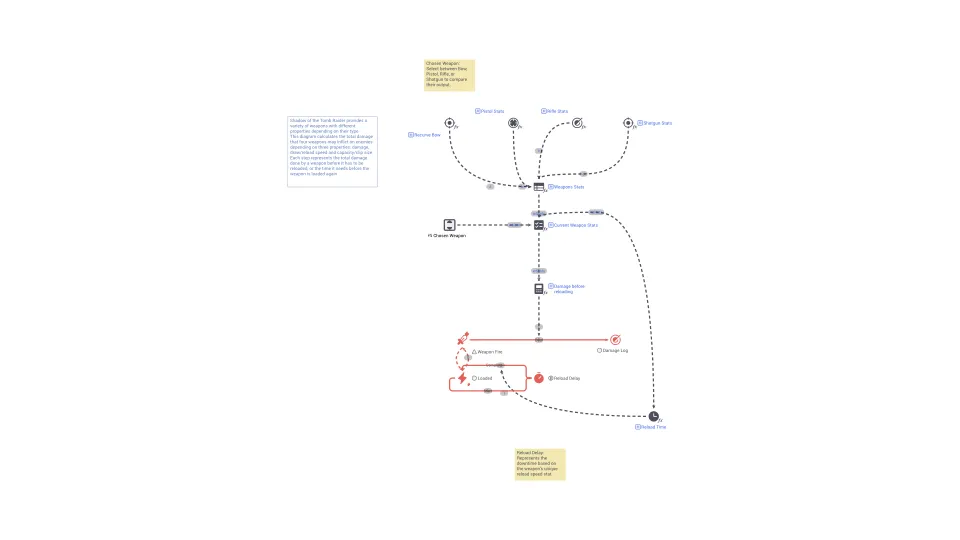
In game design, properties refer to the characteristics, attributes, or qualities that define the behavior and interactions of game elements.
Proximity
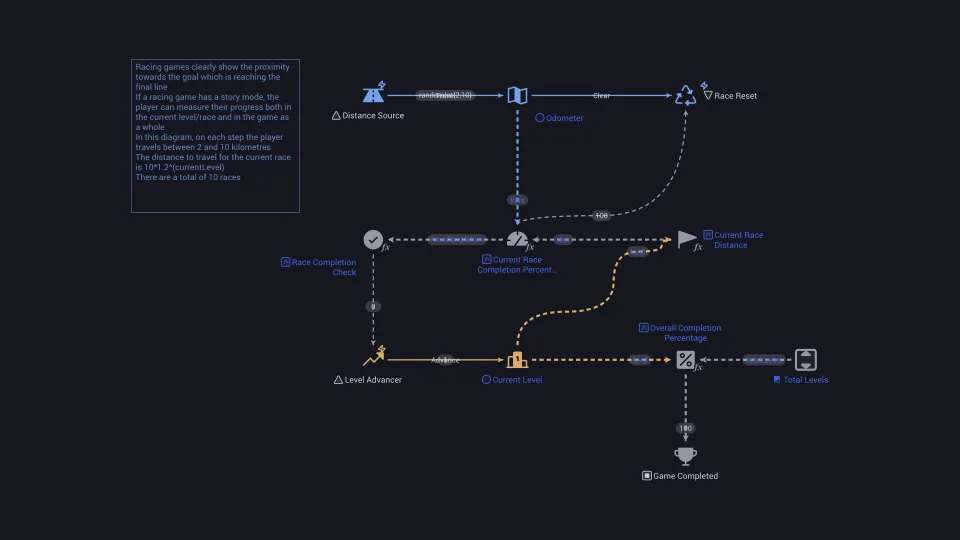
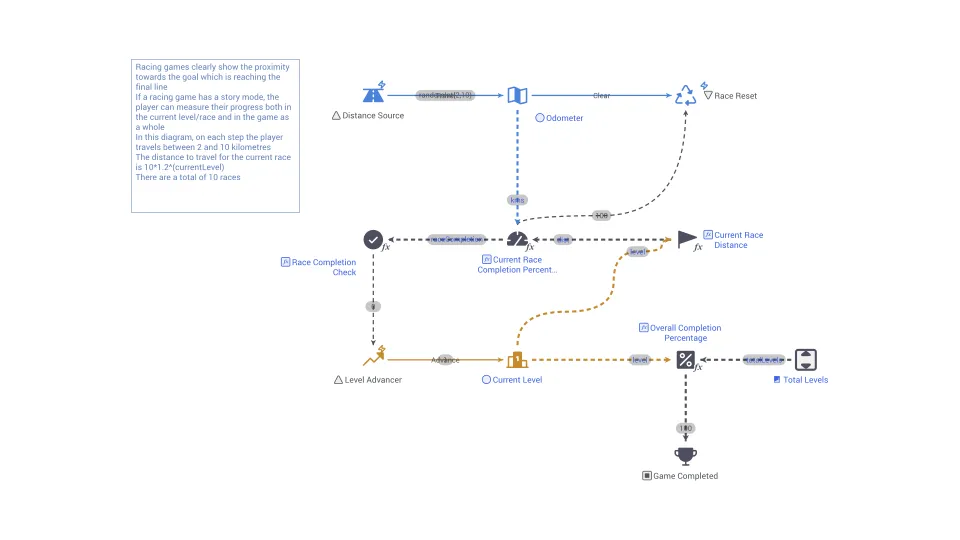
Proximity refers to the spatial relationship or distance between game elements, objects, or characters within the game world.
Public good
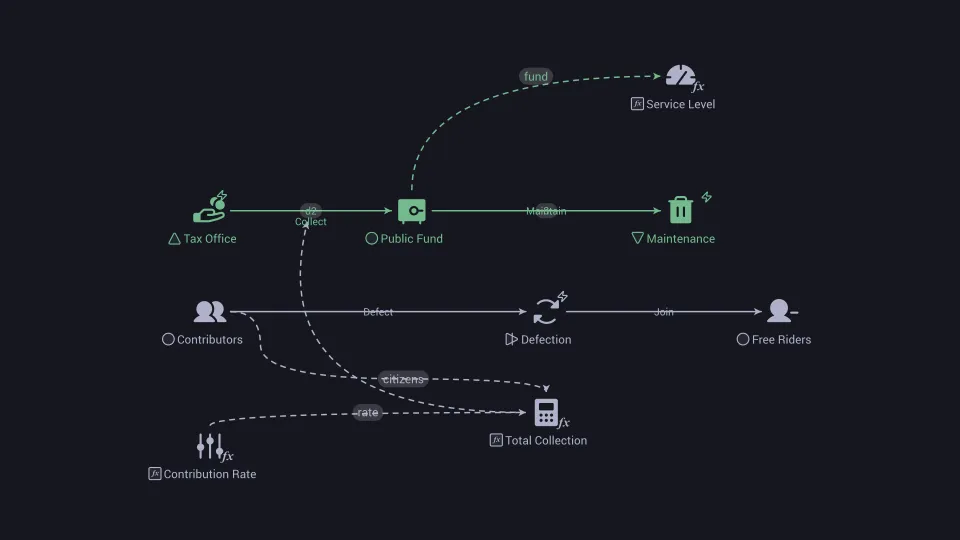
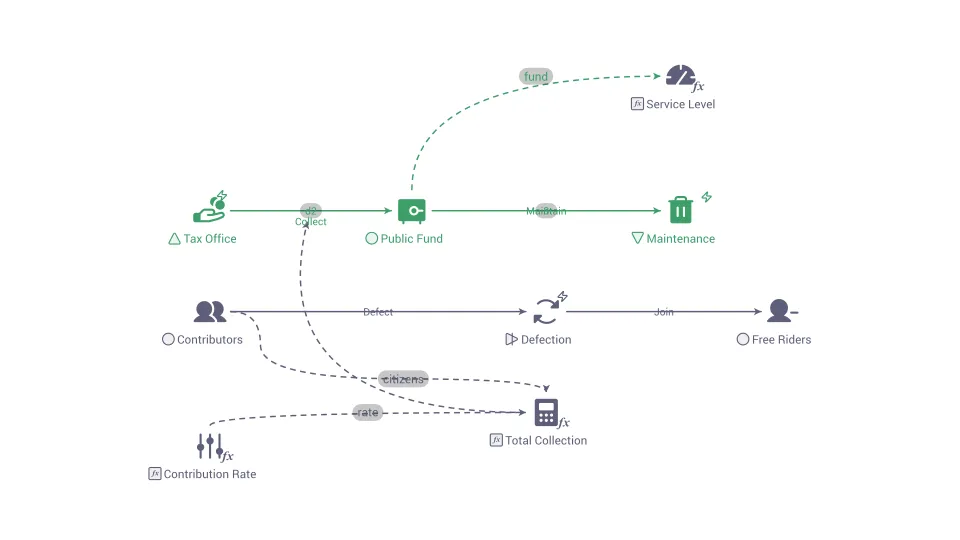
A good that anyone can use without paying and that one person's use does not reduce for the next person.
Punishment
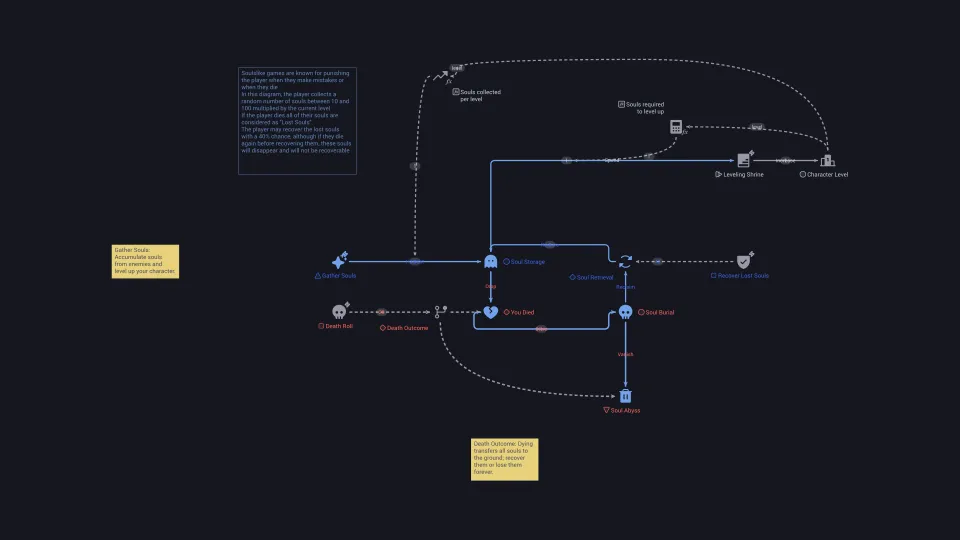
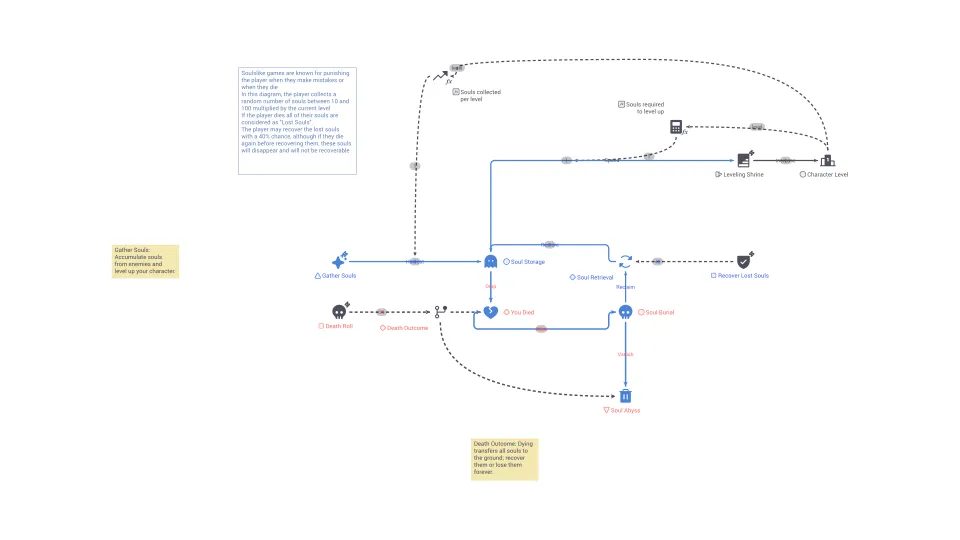
In game design, punishment refers to the penalties imposed on players for their unfavorable actions, decisions, or failures within the game.
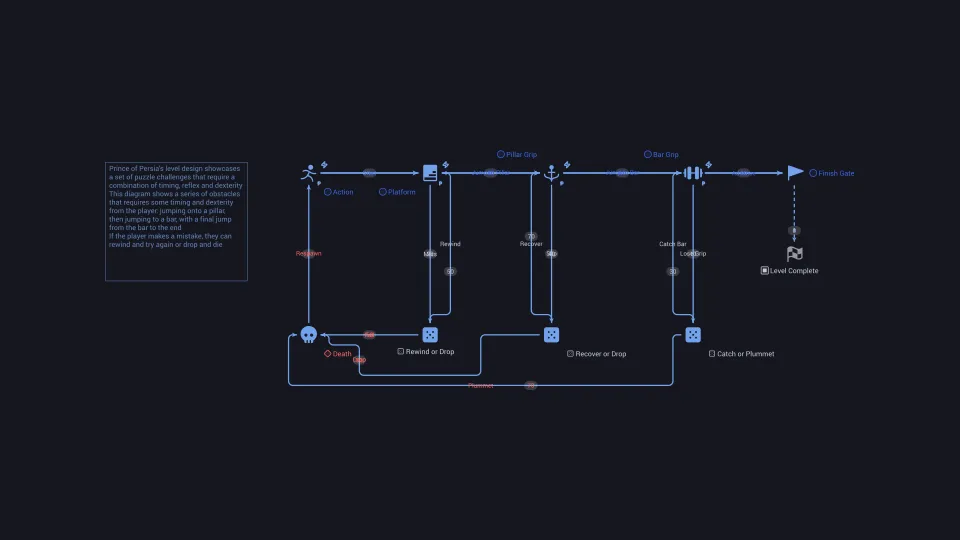
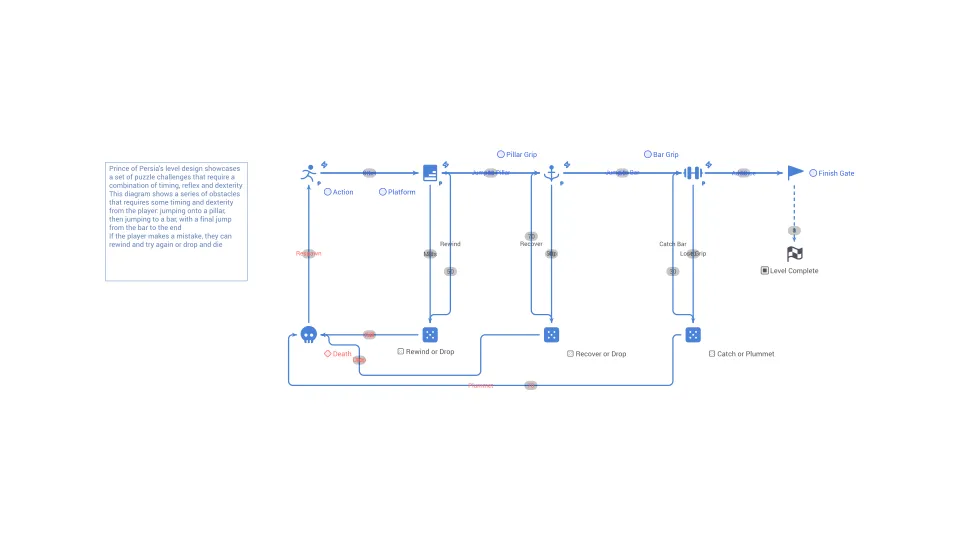
Puzzle challenge
In game design, a puzzle challenge refers to a gameplay segment or activity that requires players to solve problems using logic and reasoning.
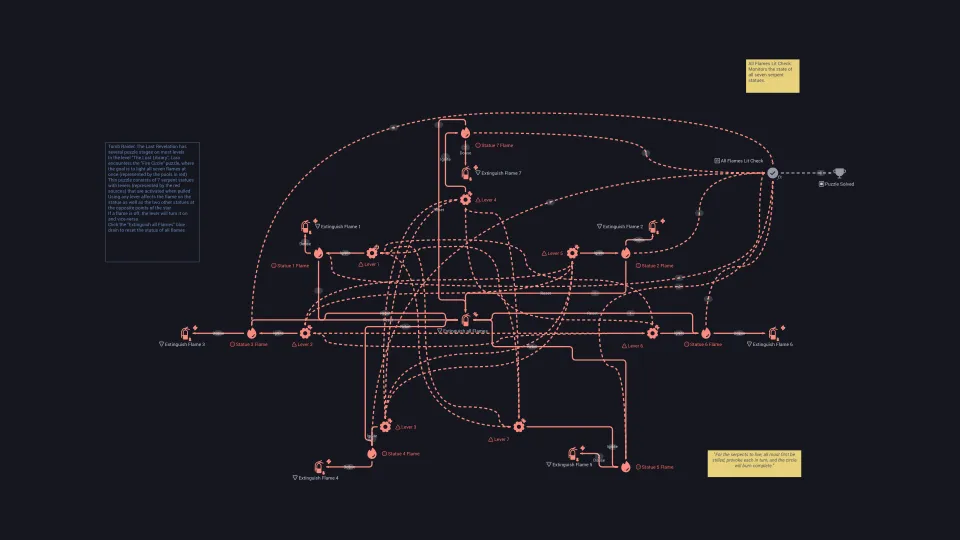
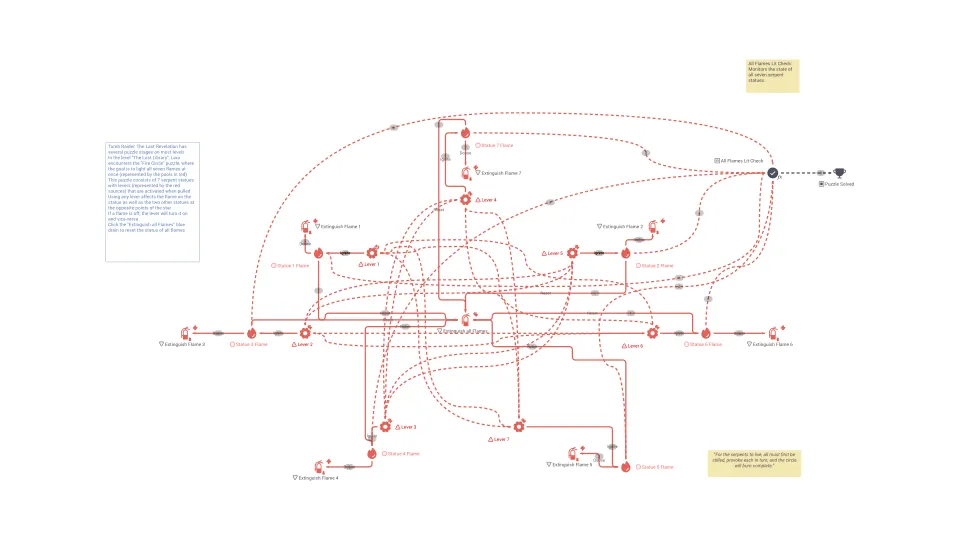
Puzzle stage
In game design, a puzzle stage refers to a specific section or level within a game that focuses primarily on puzzle-solving gameplay.
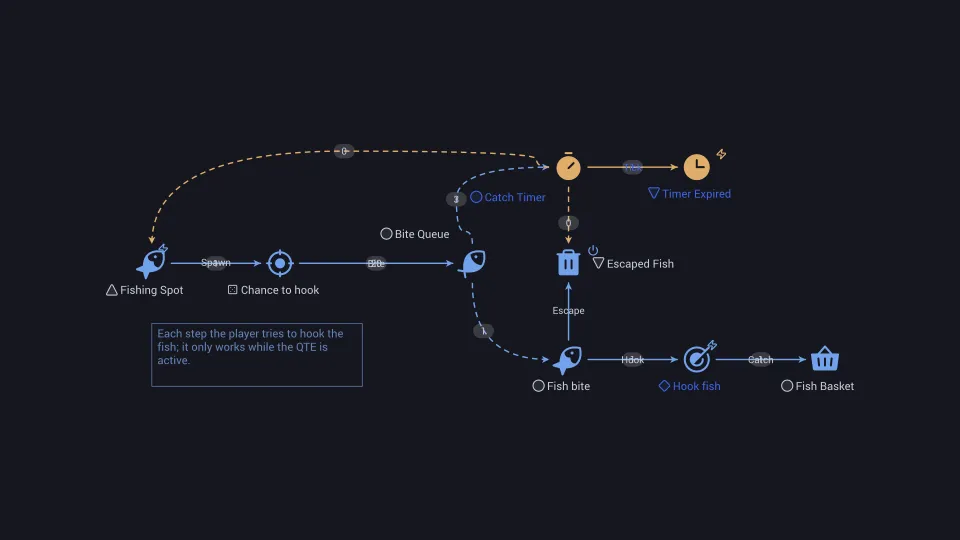
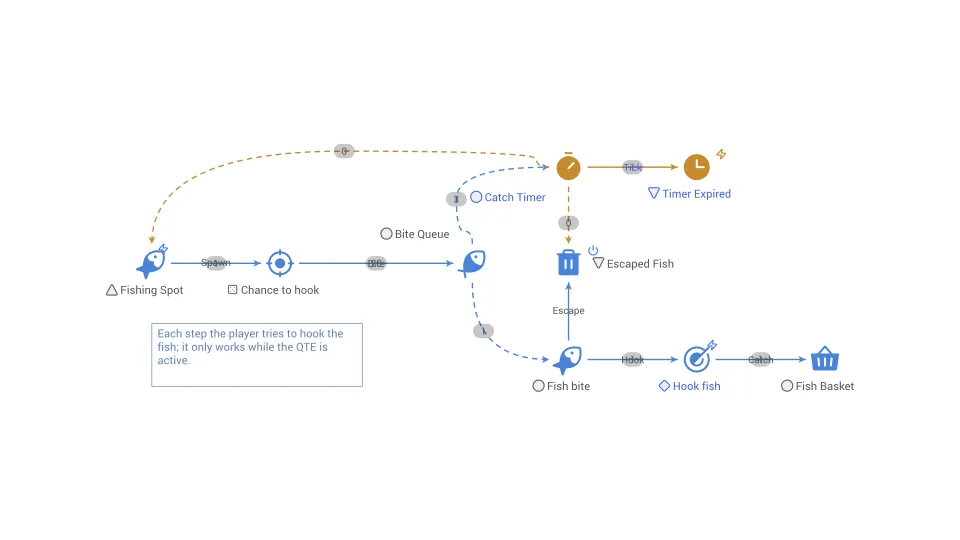
QTE
QTE stands for "Quick Time Event," which is a gameplay mechanic commonly used in video games to create more cinematic and interactive experiences.
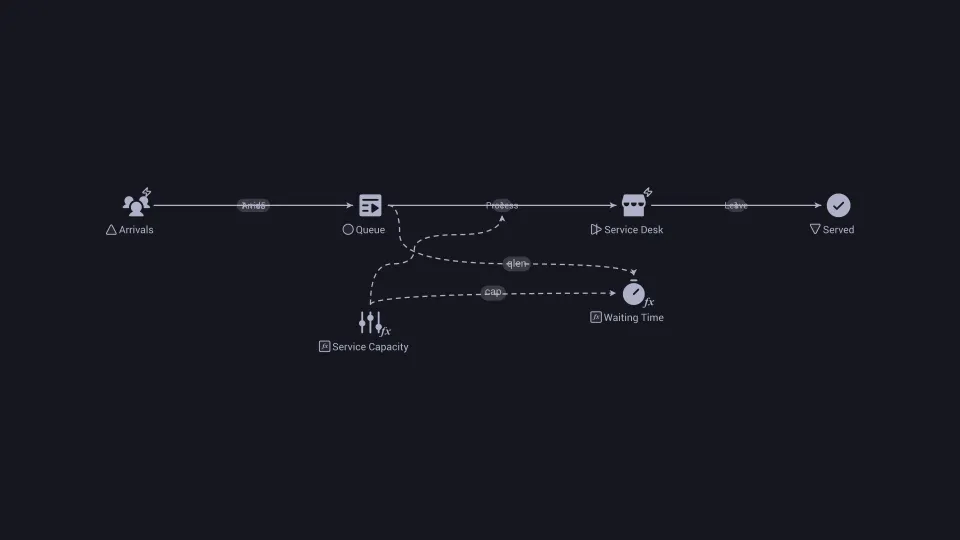
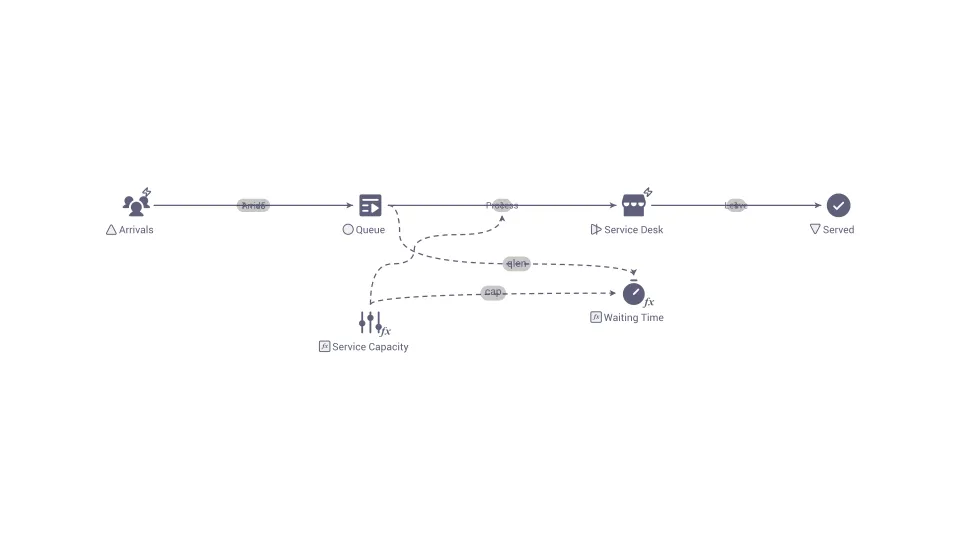
Queueing
The study of waiting lines: how arrivals, service speed and the number of servers determine how long people or items wait.
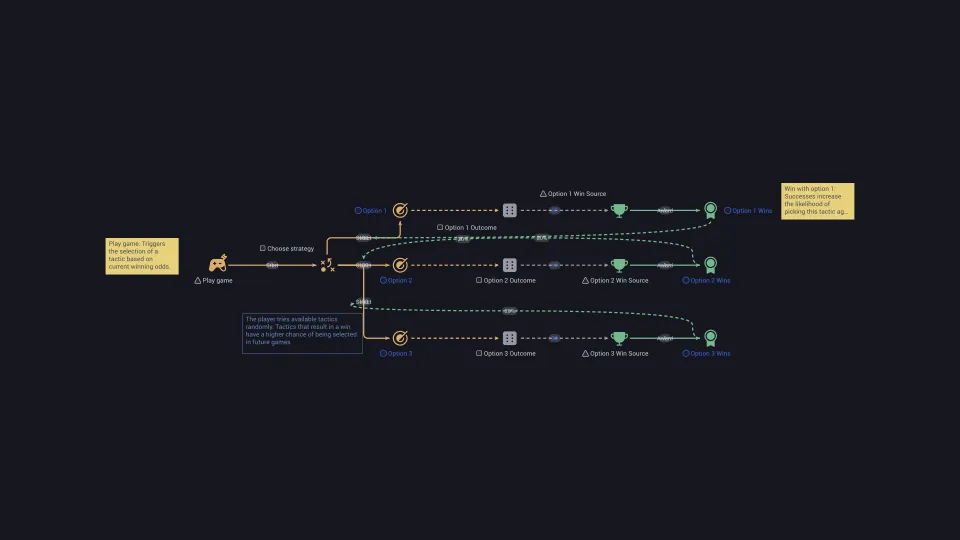
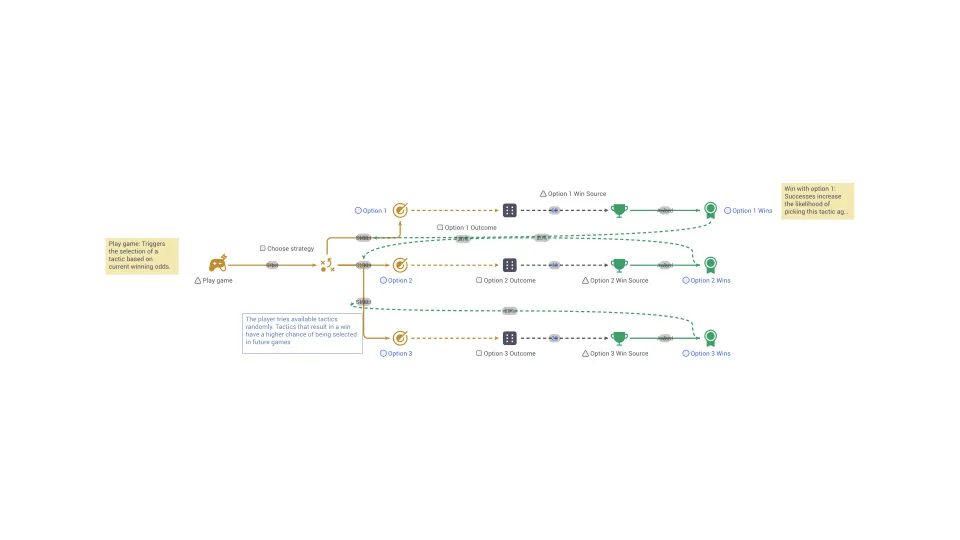
R&D (playstyle)
"R&D playstyle" prioritizes experimentation and learning over winning, emphasizing exploration of moves and mechanics.
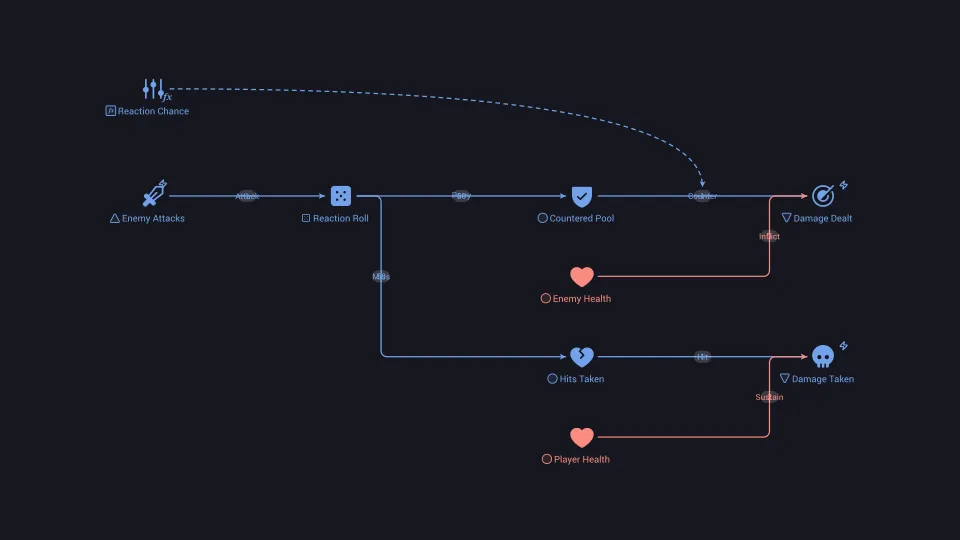
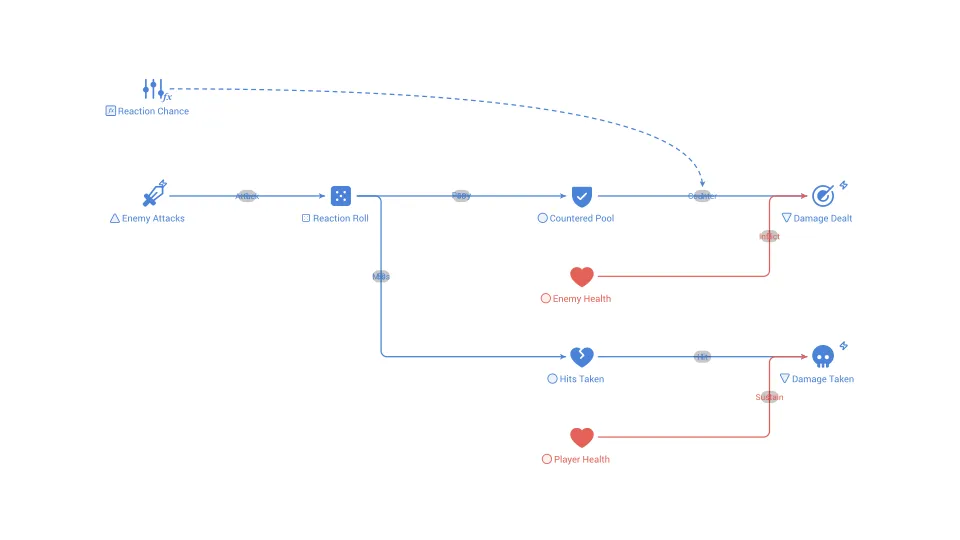
Reactionary counter
A reactionary counter is a type of defensive move that a player can use in response to an opponent's attack or action.
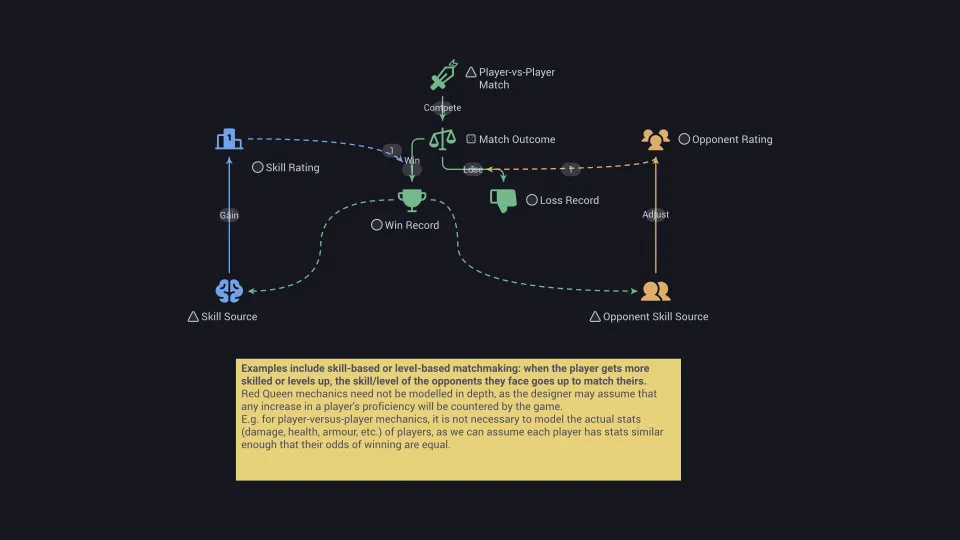
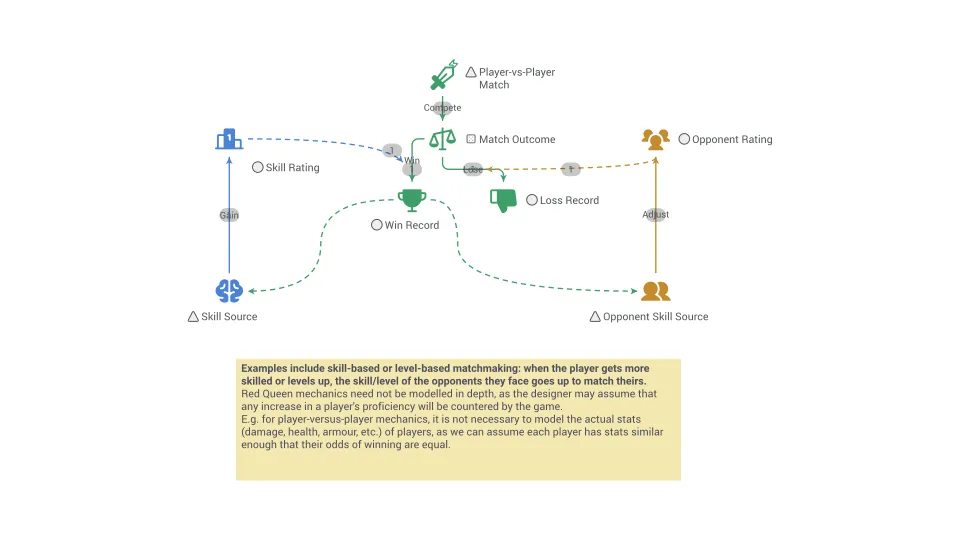
Red queen mechanic
Red Queen Mechanic describes a negative feedback-type system in which, when the player's proficiency at a task increases, the challenge they face increases.
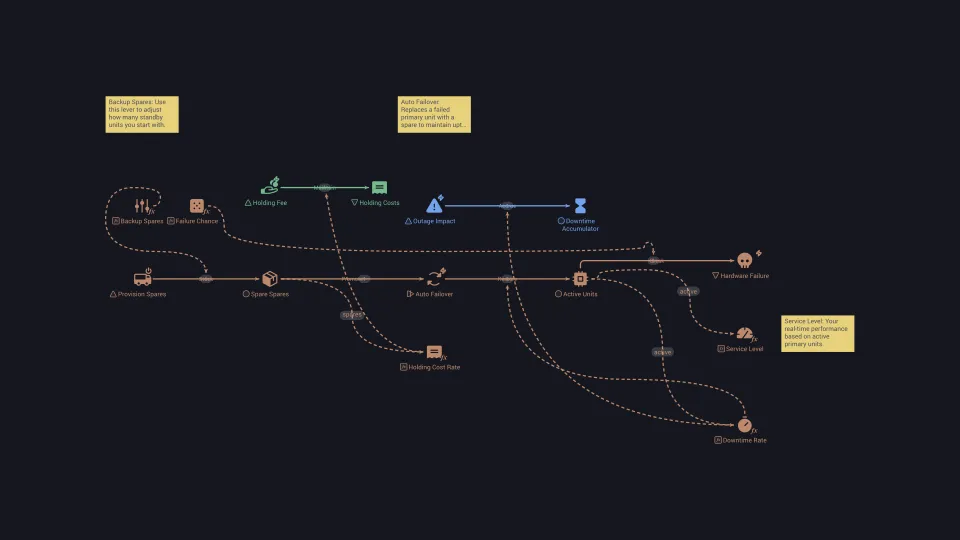
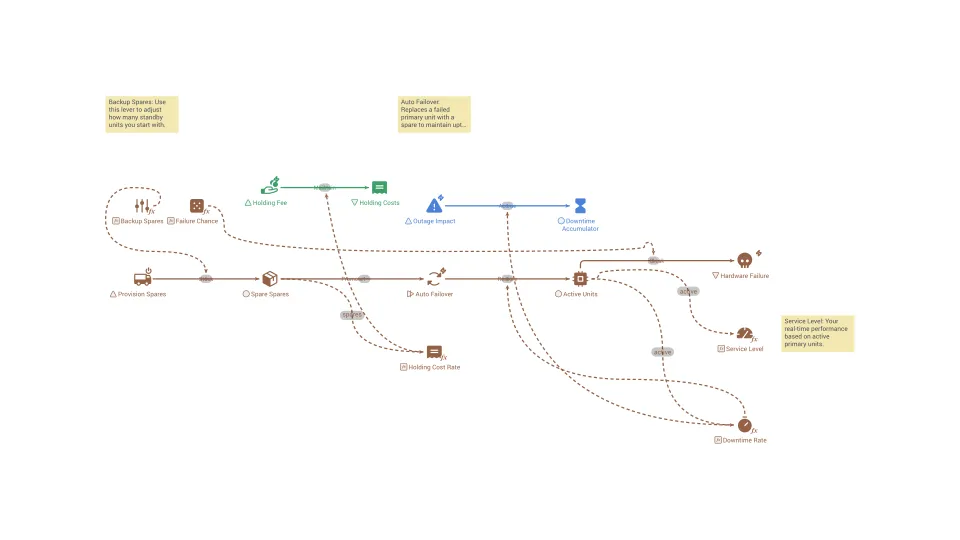
Redundancy
Extra capacity or backup components kept in place so that a single failure does not stop the whole system.
Reference mode
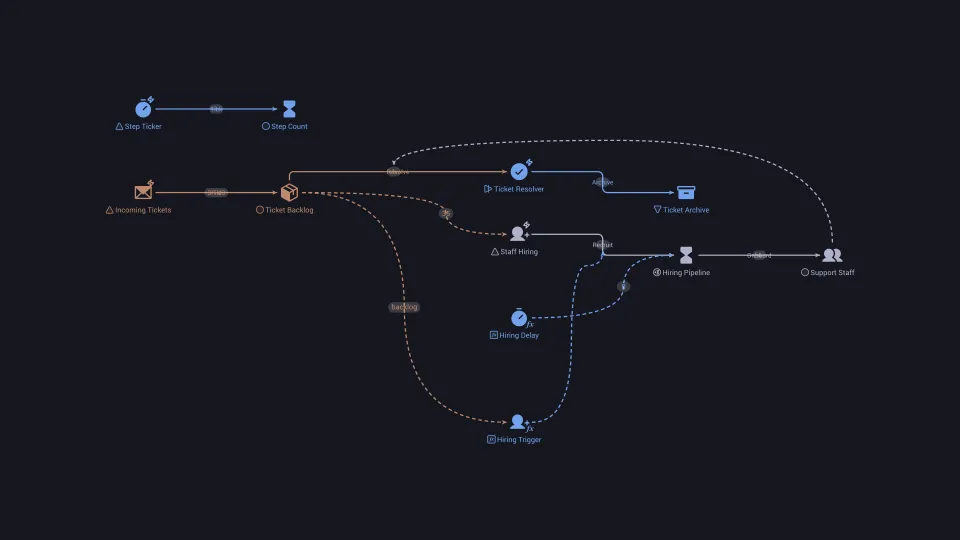
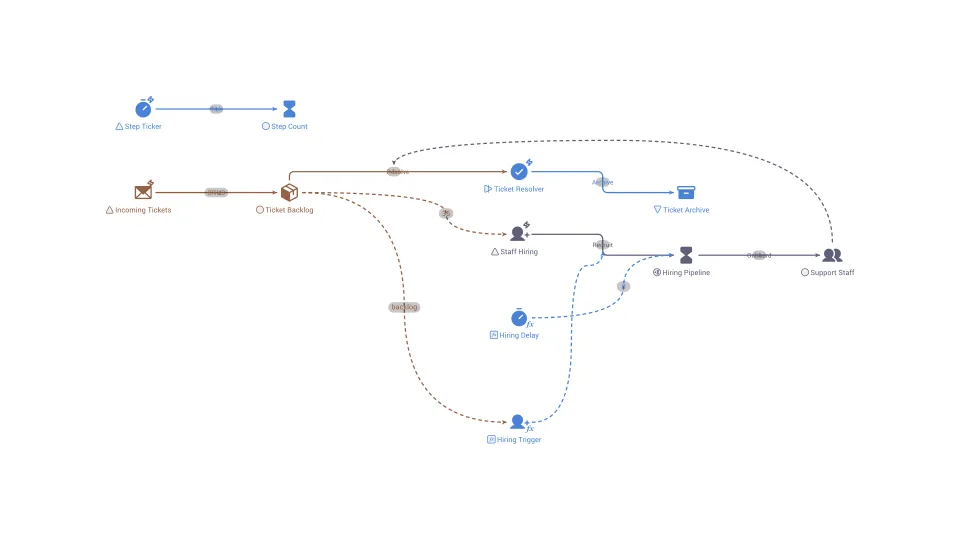
The pattern of change over time, drawn or measured, that a model is built to explain, usually shown as a behavior-over-time graph.
Reinforcing feedback loop
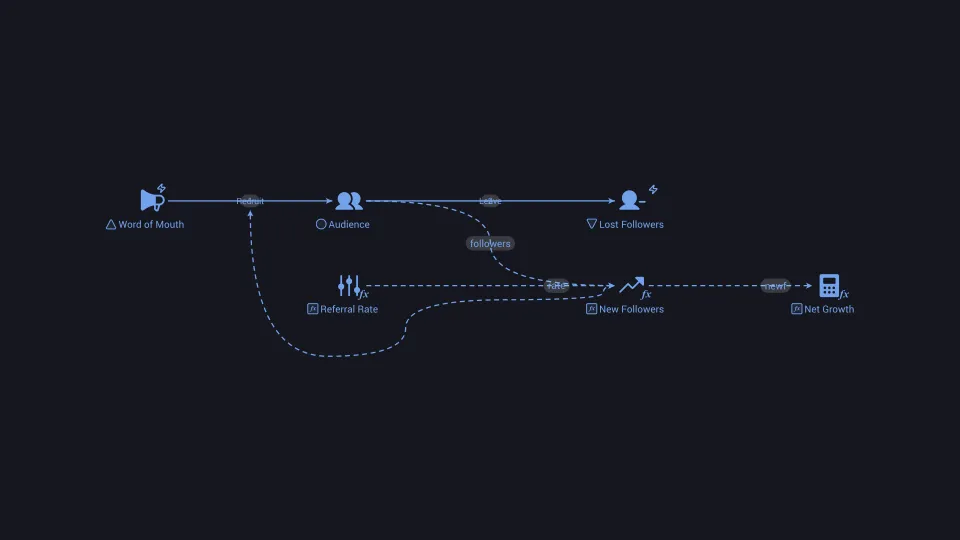
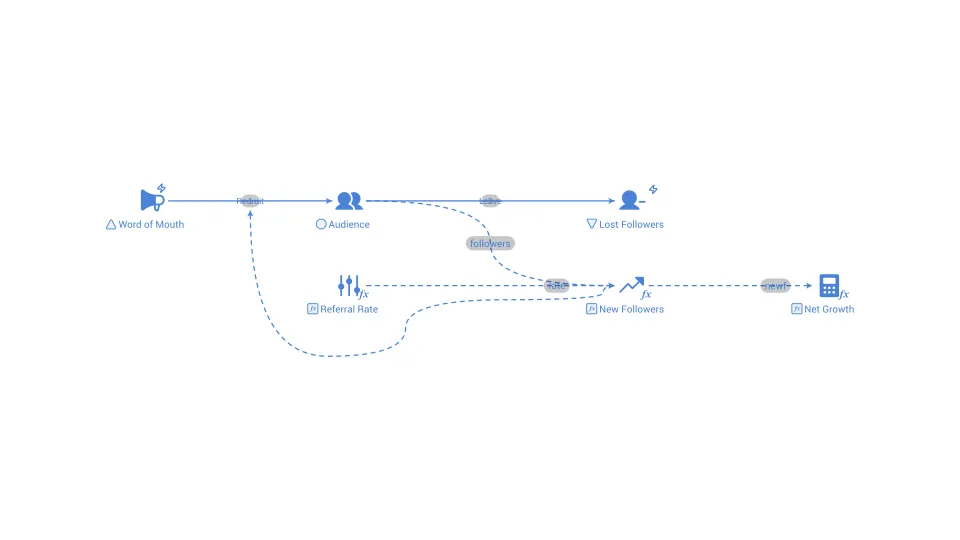
A circular chain of cause and effect in which a change in a quantity leads to more of the same change, so growth or decline accelerates.
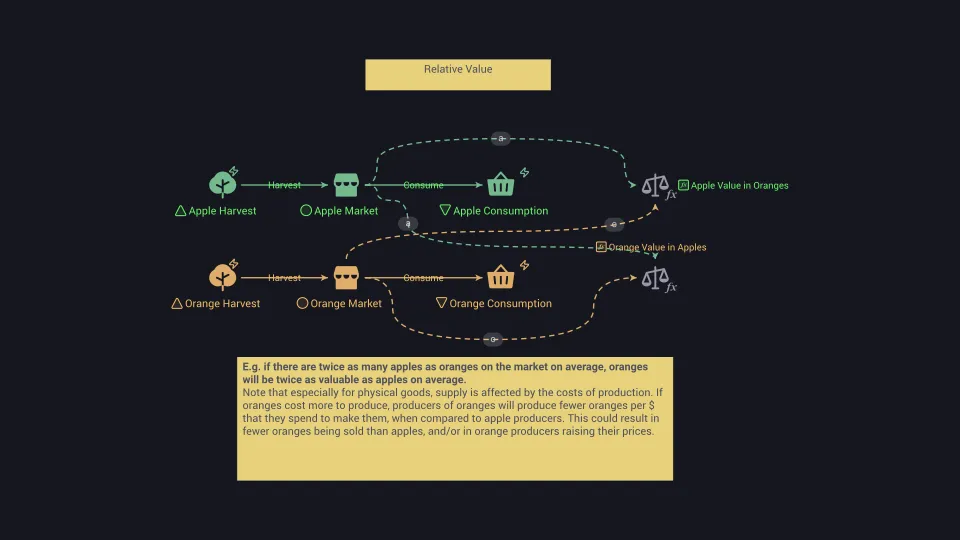
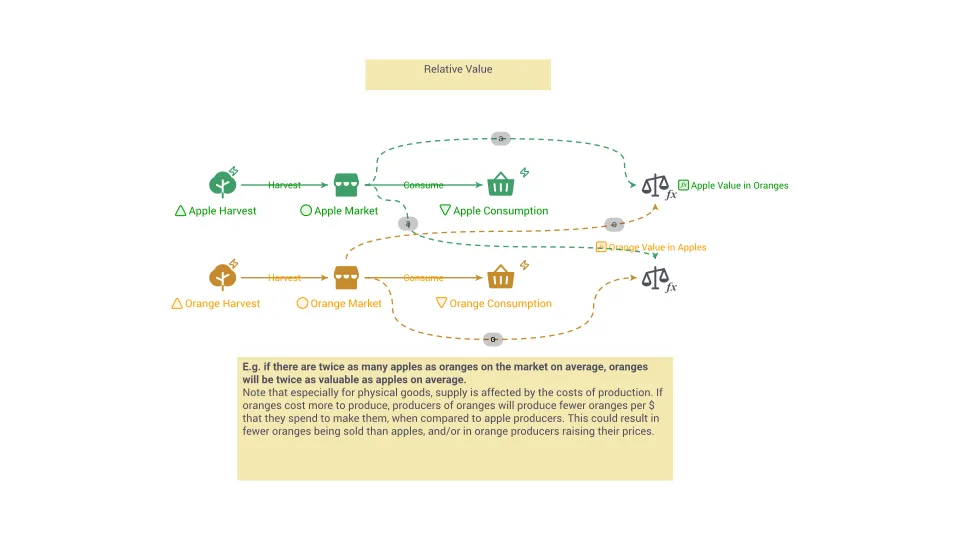
Relative value
The worth of one thing measured in terms of another, instead of in an absolute amount of money.
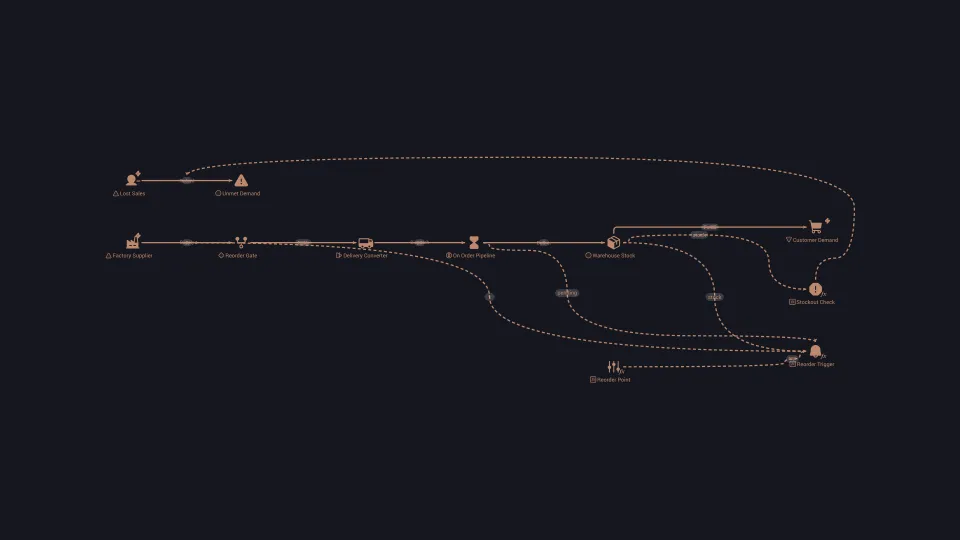
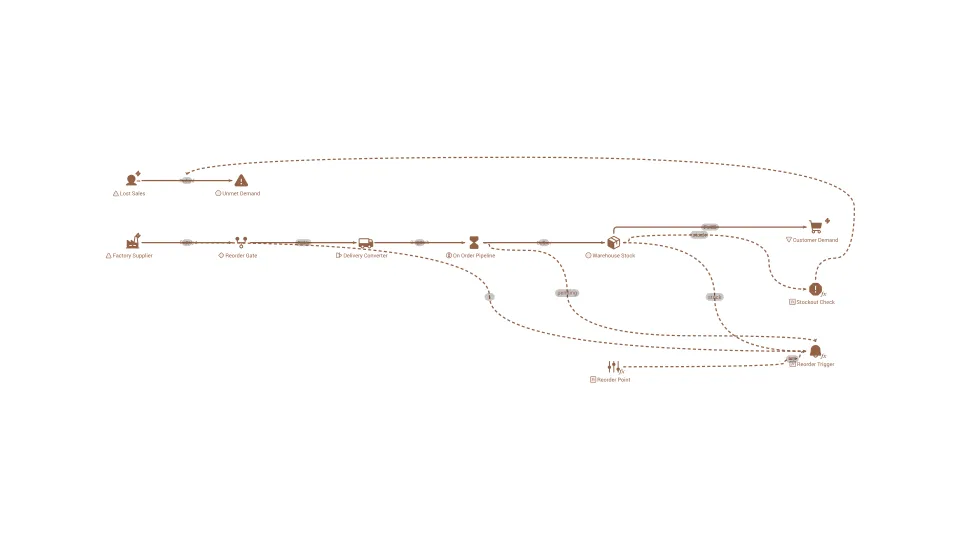
Reorder point
The stock level at which a new order is placed, so that it arrives before the remaining stock runs out.
Repair mechanic
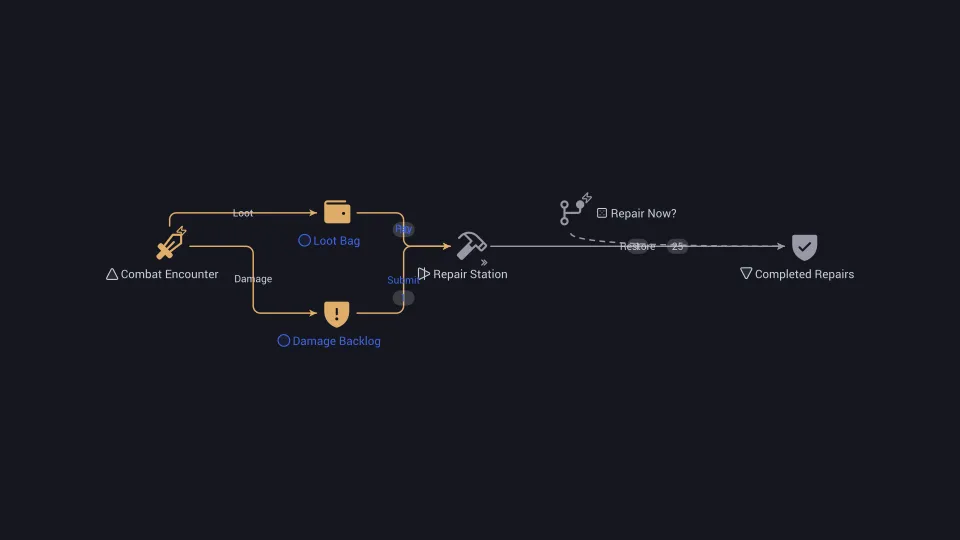
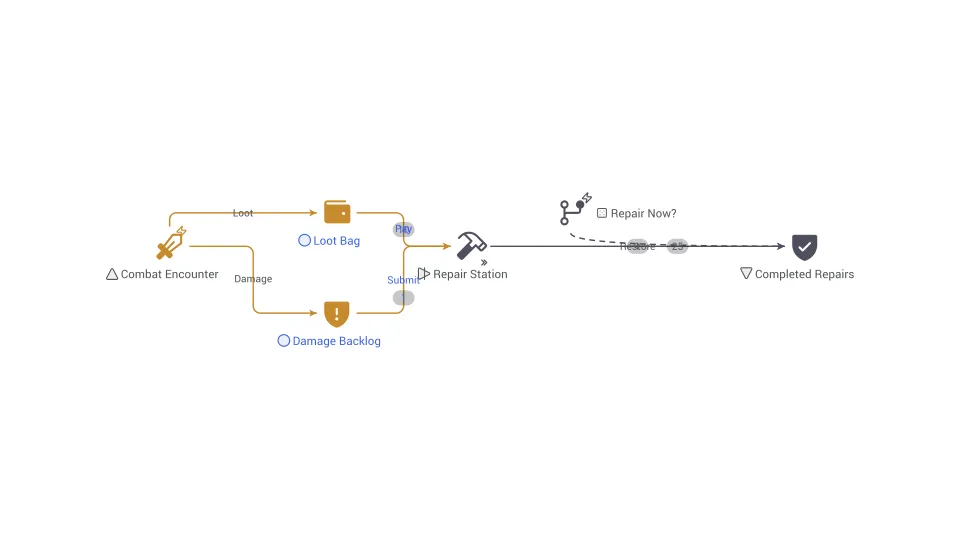
A repair mechanic refers to a gameplay element that allows players to restore or fix the condition of in-game objects, such as weapons, vehicles, or structures.
Reproduction number
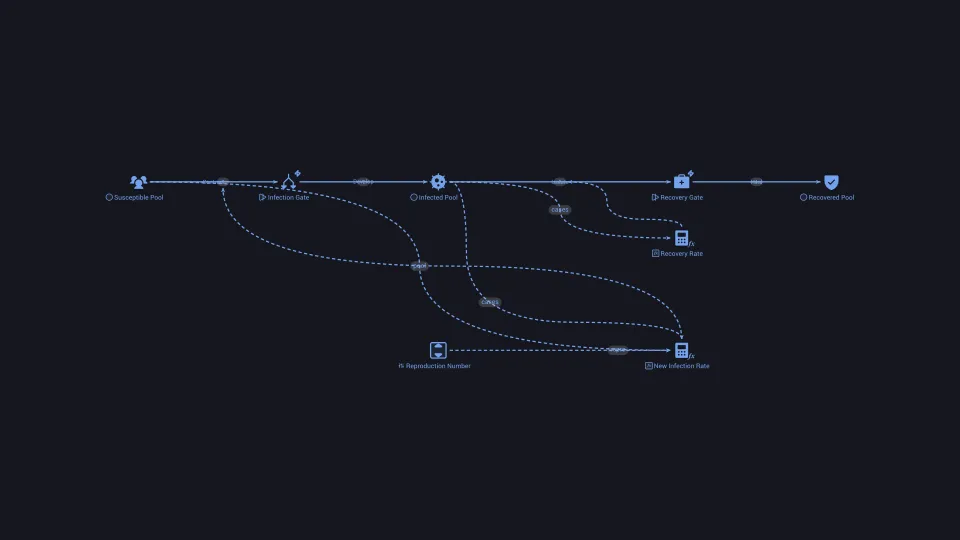
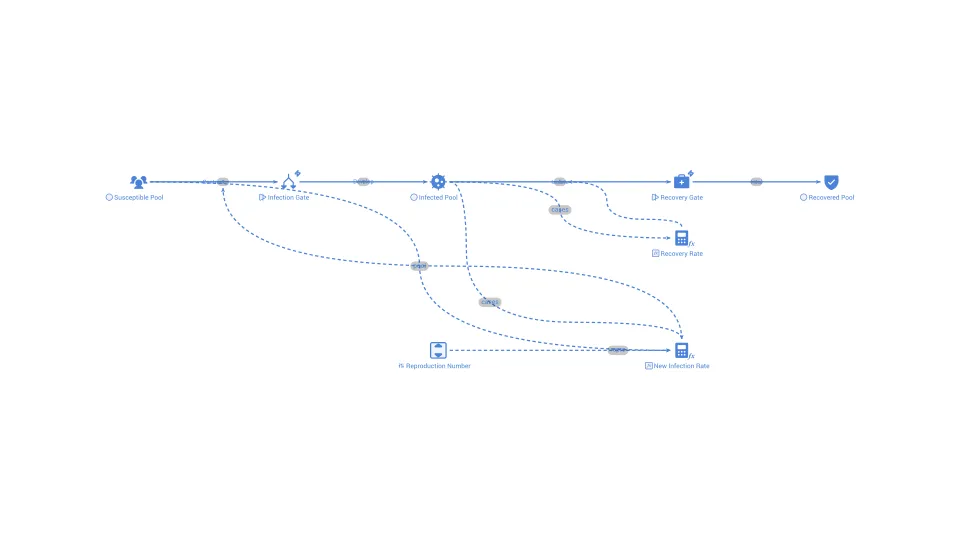
The average number of new infections caused by one infected person, which decides whether an outbreak grows or fades.
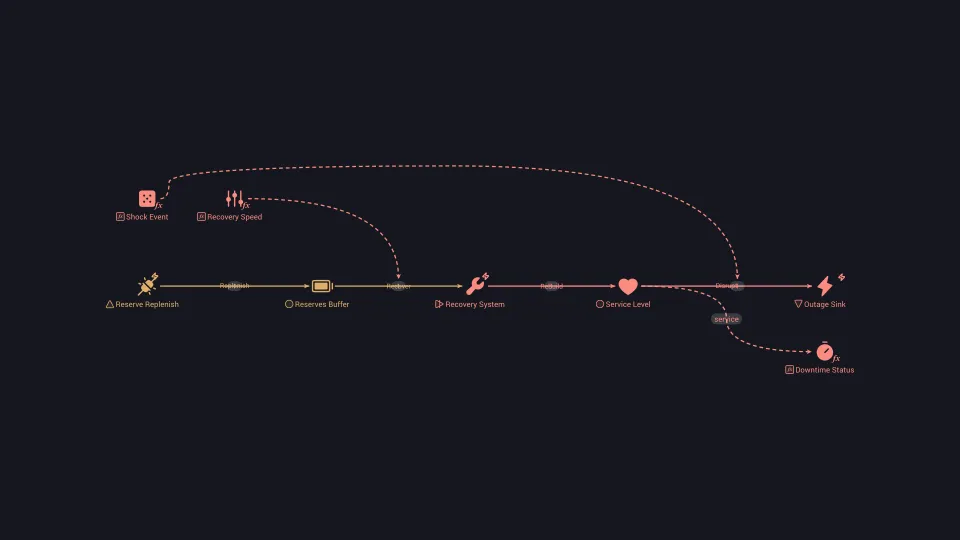
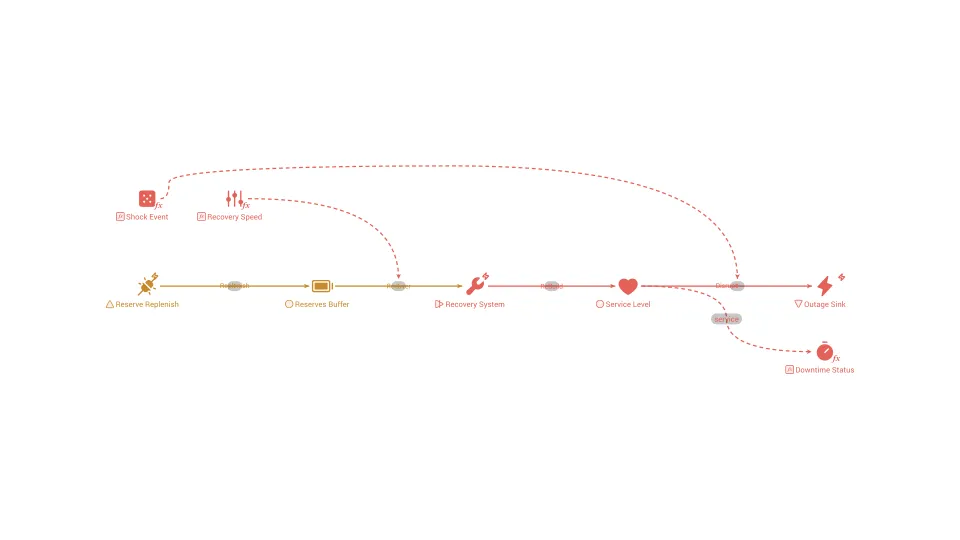
Resilience
The ability of a system to absorb shocks and keep working, or to recover quickly to a working state after being disturbed.
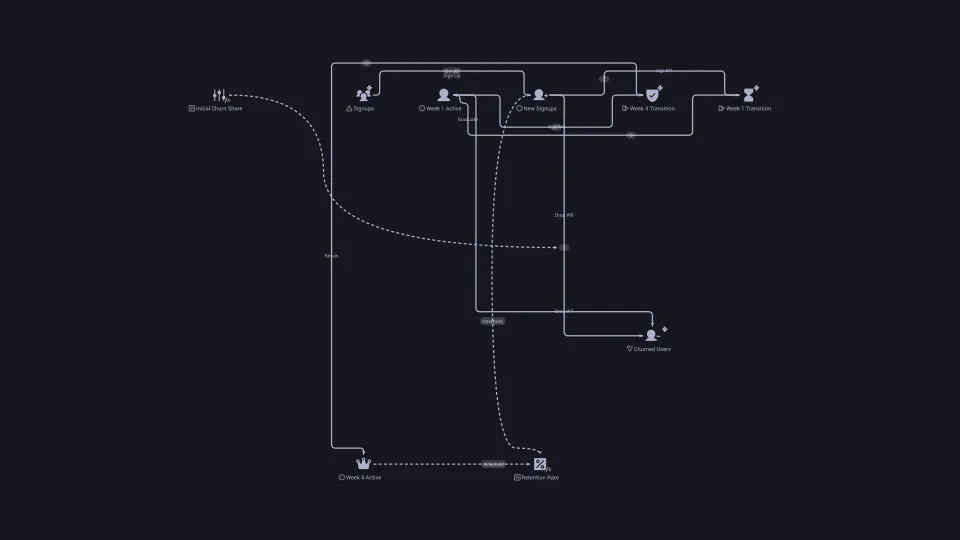
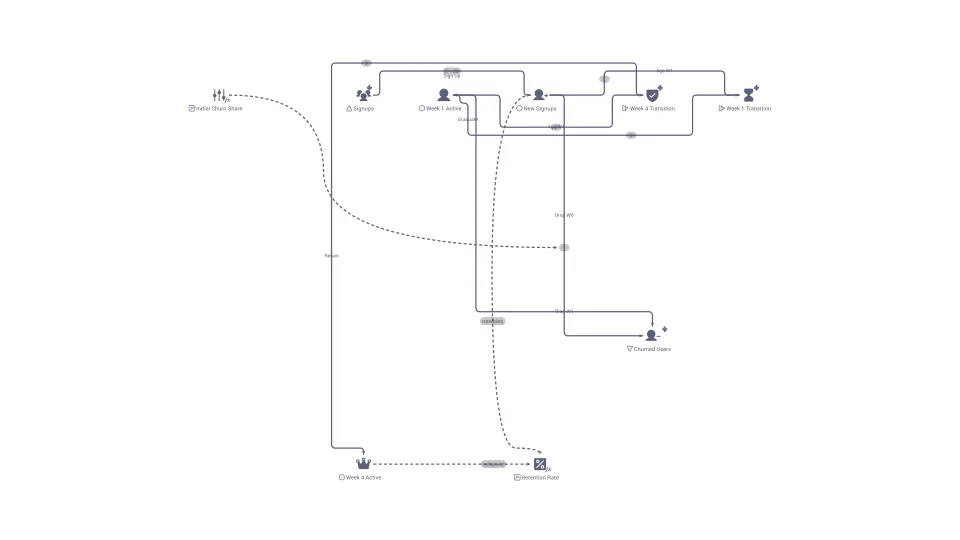
Retention curve
A chart of the share of a group of users or customers still active after each period since they started.
Return on investment
A ratio showing how much profit an investment earned relative to what it cost, usually given as a percentage.
Return to player
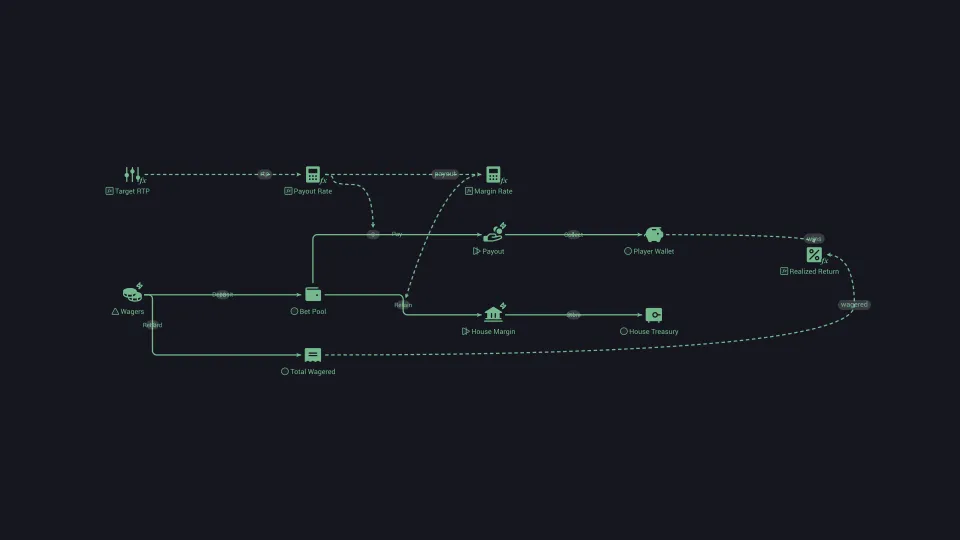
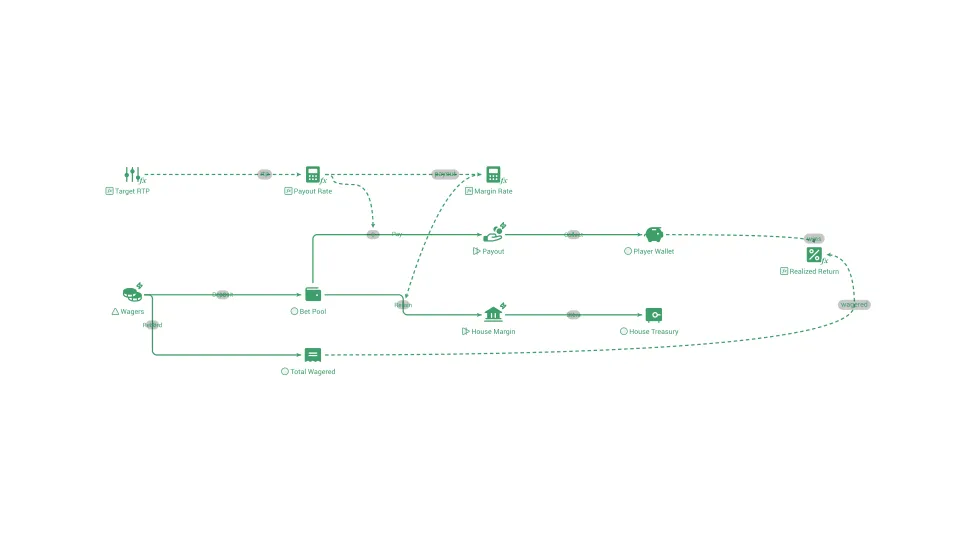
The percentage of all money wagered that a game pays back to players over the long run; the house edge is the remainder.
Reusable key
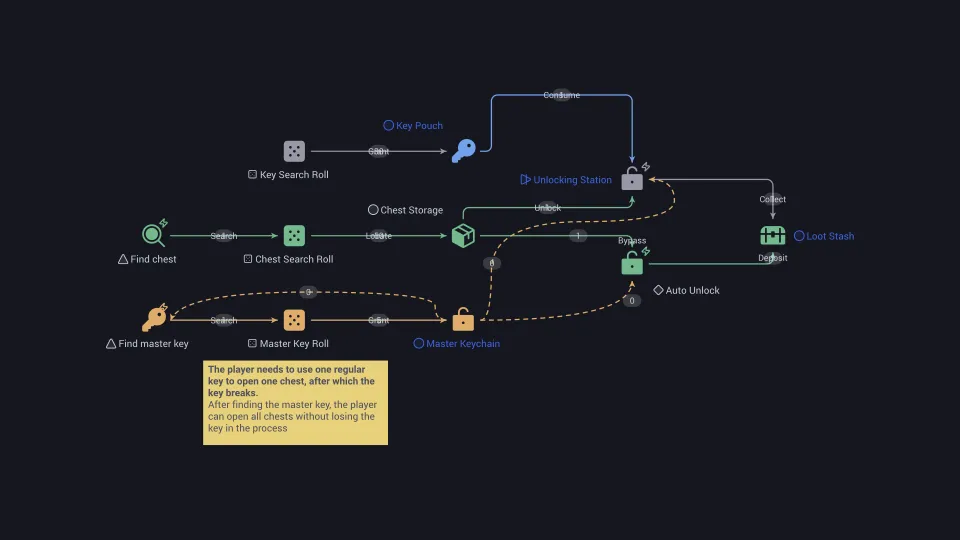
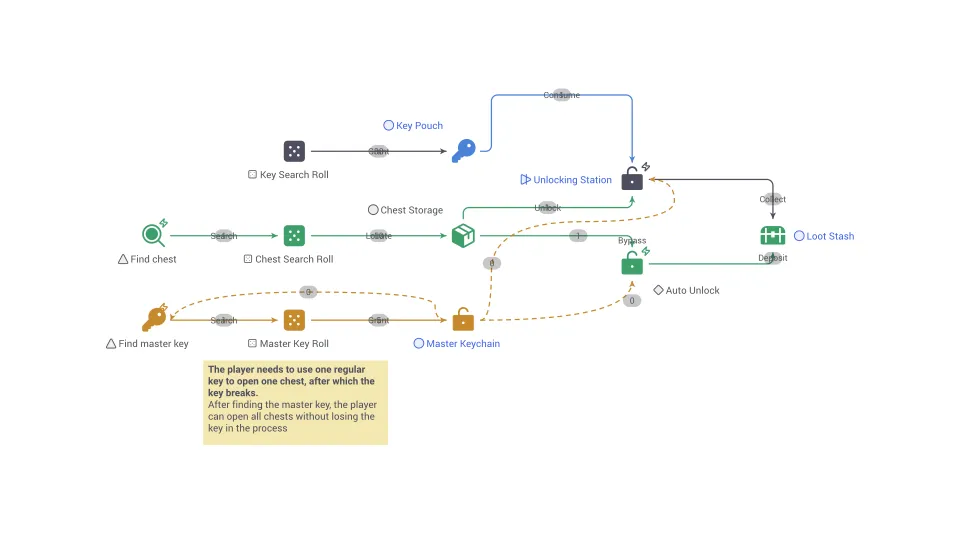
A reusable key refers to an item that can be used multiple times to unlock multiple doors or objects within the game.
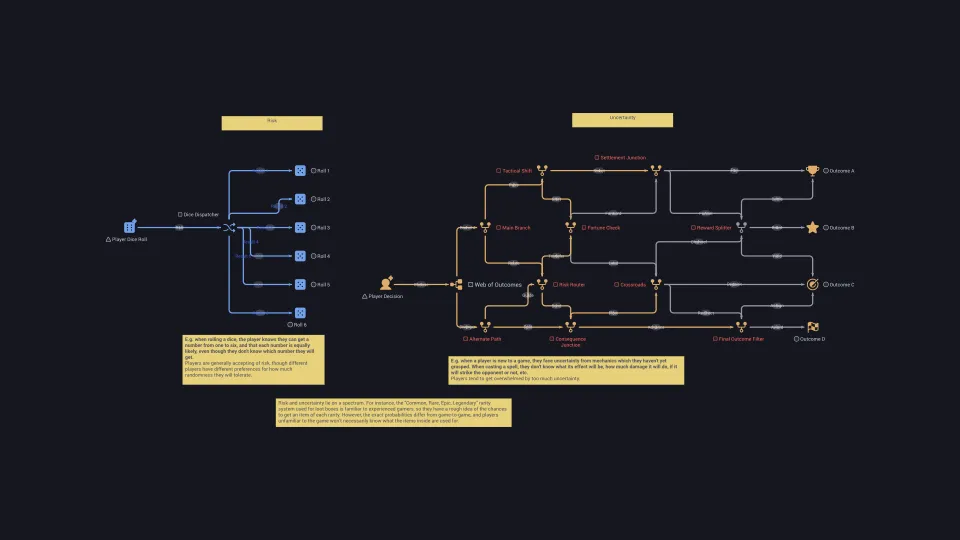
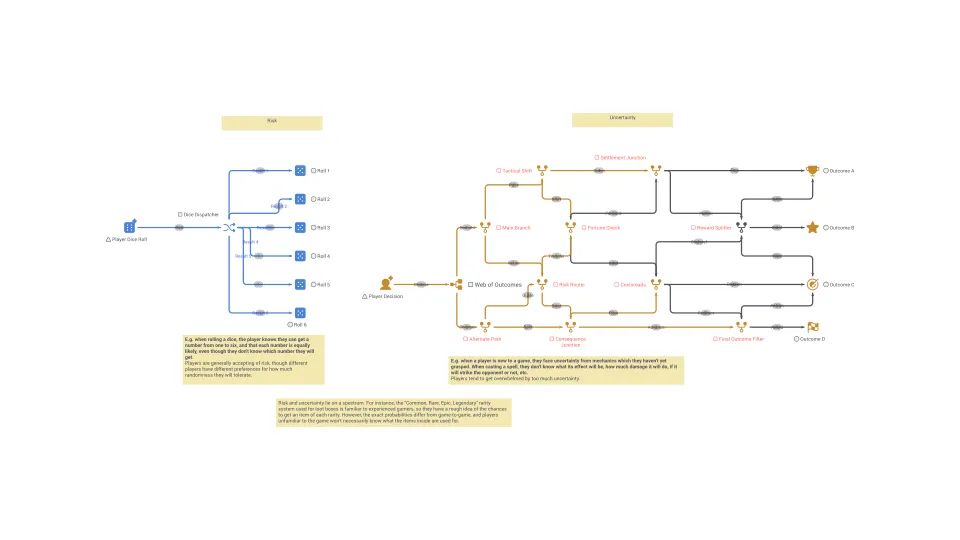
Risk
The chance that an outcome differs from what was expected, especially in a way that causes loss, with known odds.
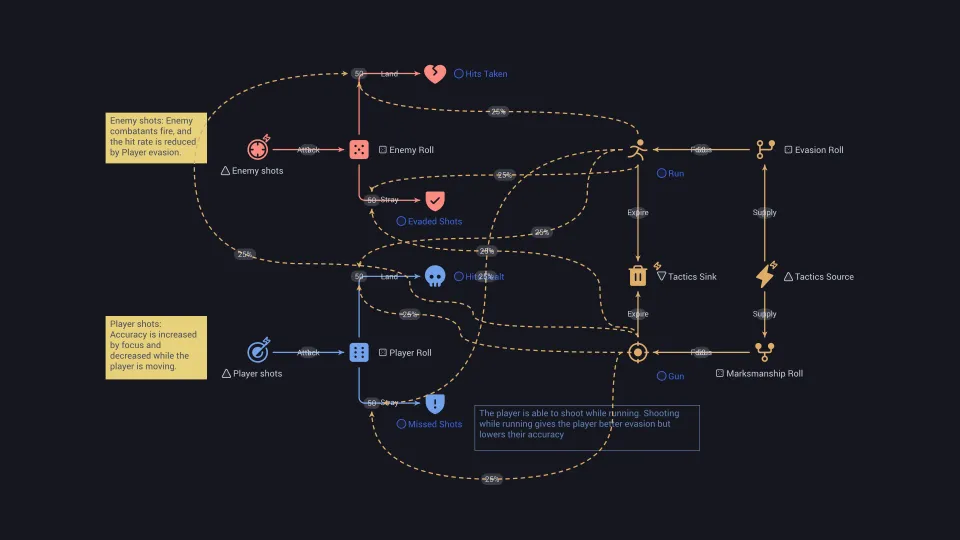
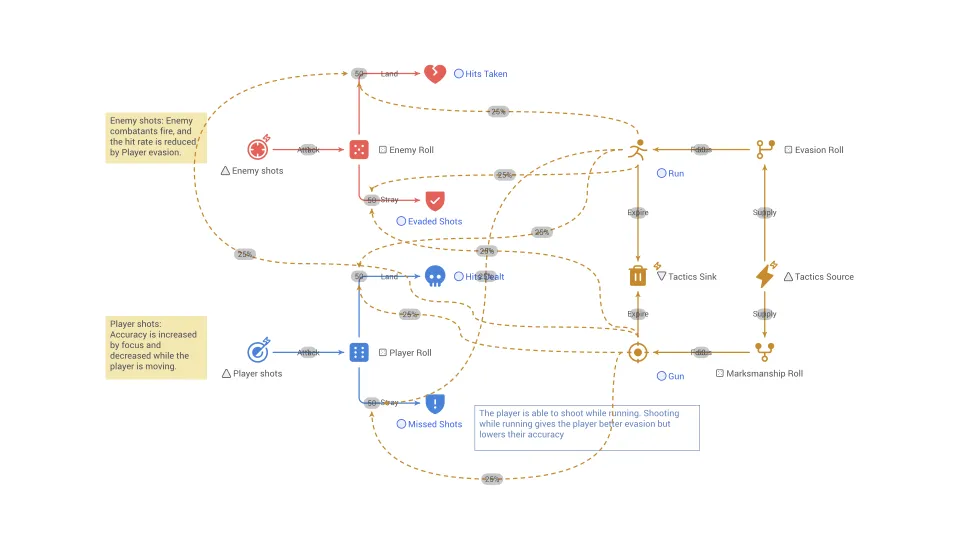
Run-And-Gun
Run and gun refers to a gameplay style characterized by fast-paced action and minimal emphasis on strategy or careful planning.
Runge-Kutta method
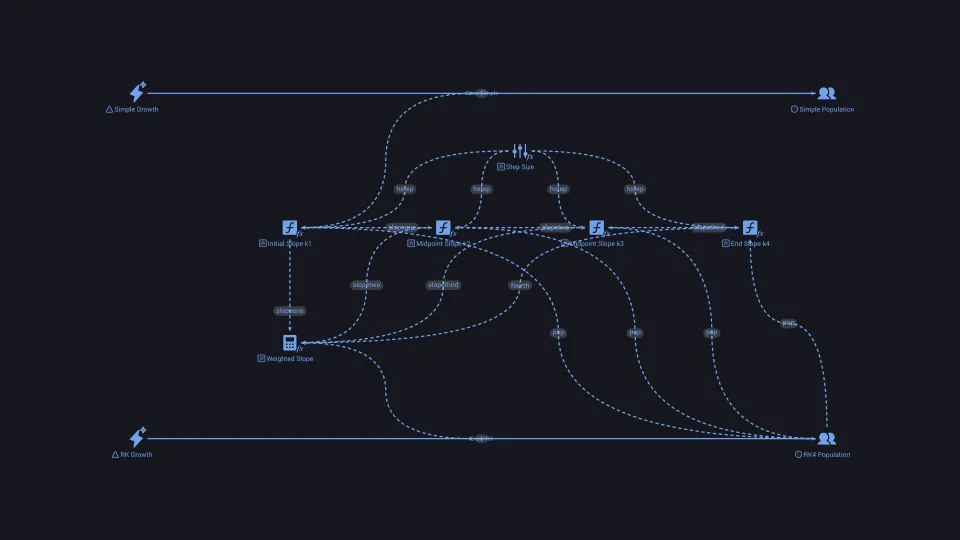
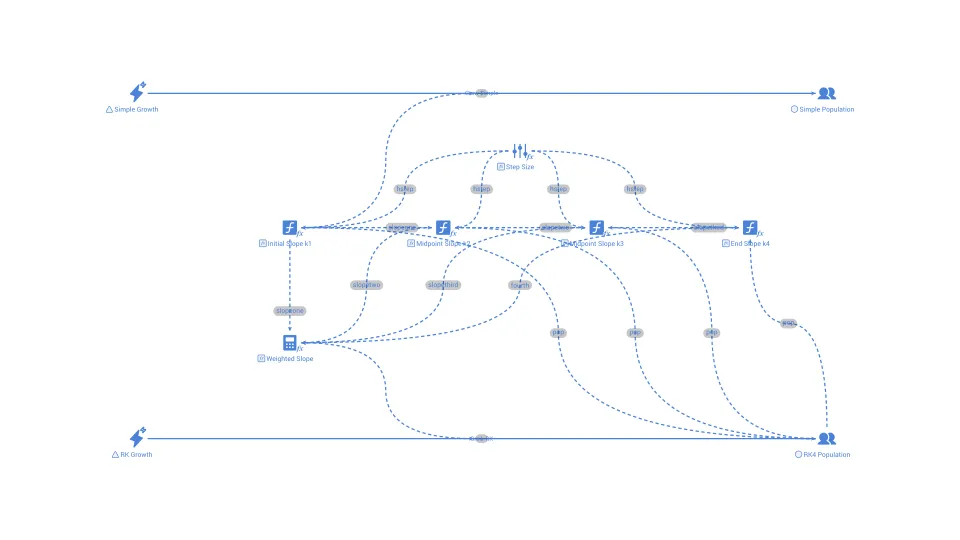
A family of numerical methods that gets a more accurate step in a simulation by sampling the rate of change several times within each step.
Runway
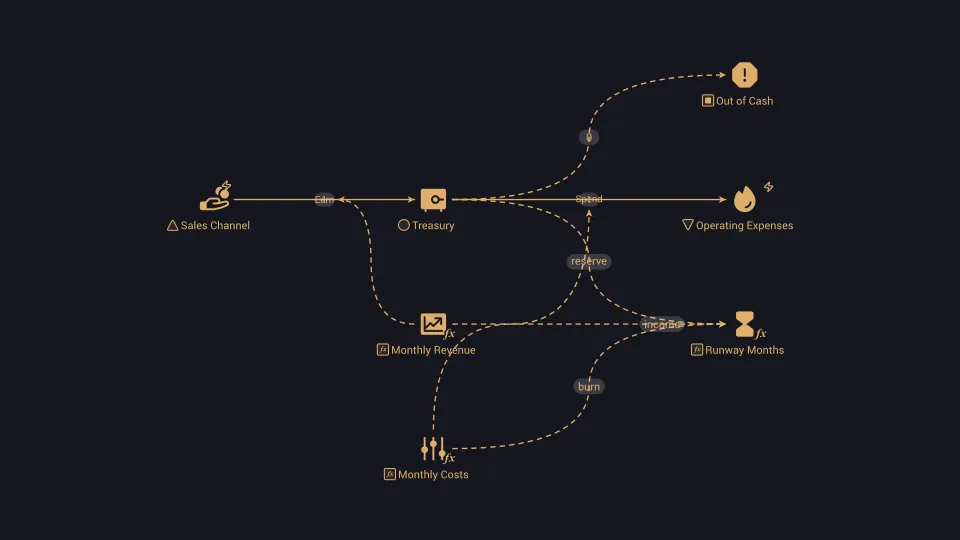
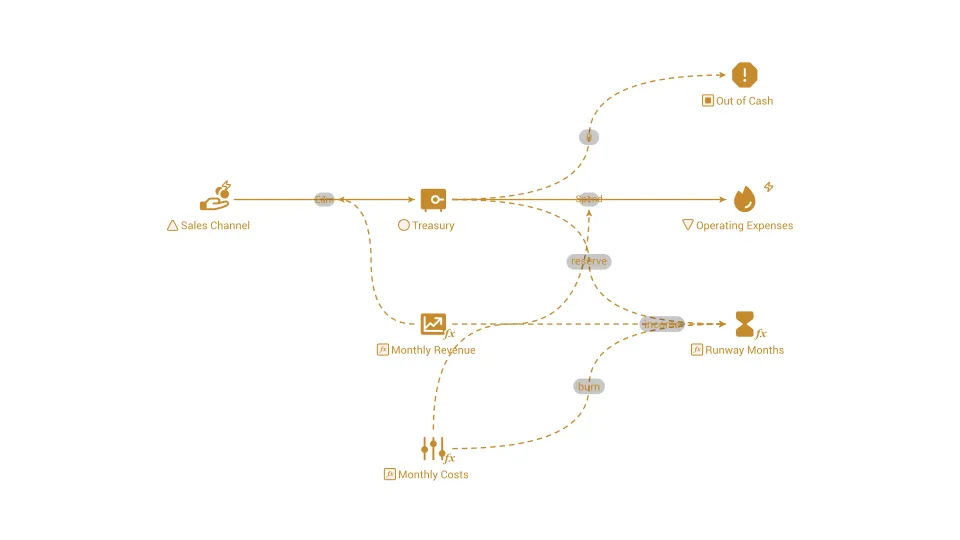
The number of months a company can keep operating before its cash runs out, given its current spending and income.
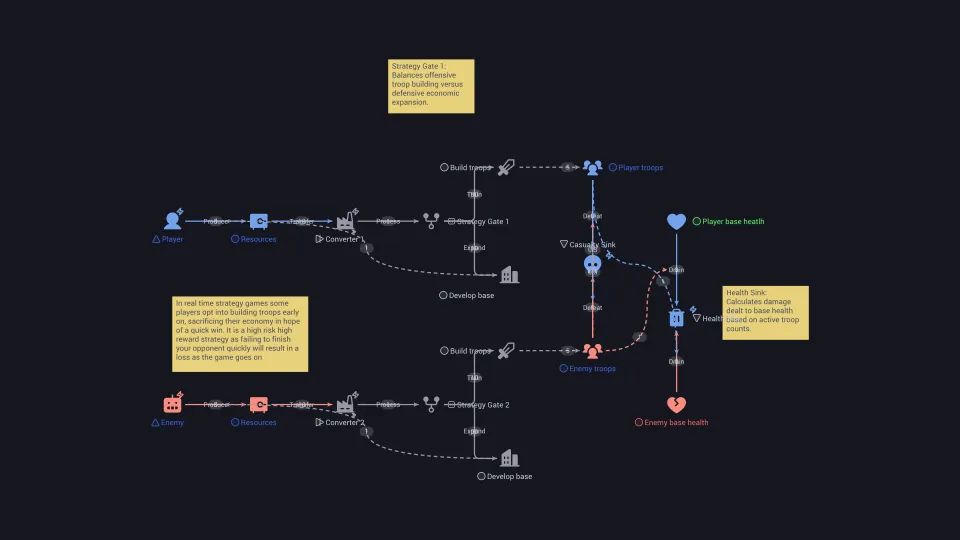
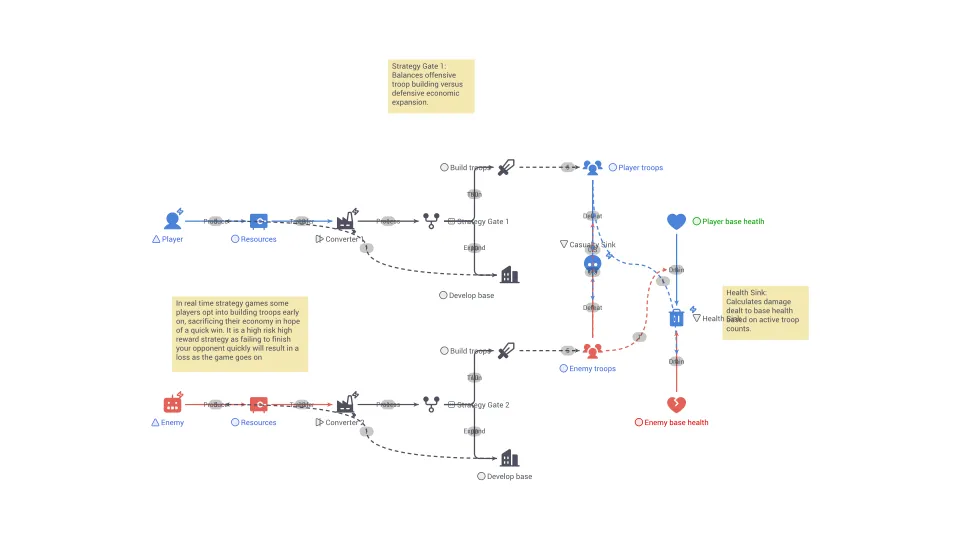
Rush down playstyle (same as aggressive playstyle)
A rush down playstyle is a strategy where a player relentlessly and aggressively pursues their opponent, typically with close-range attacks and pressure.
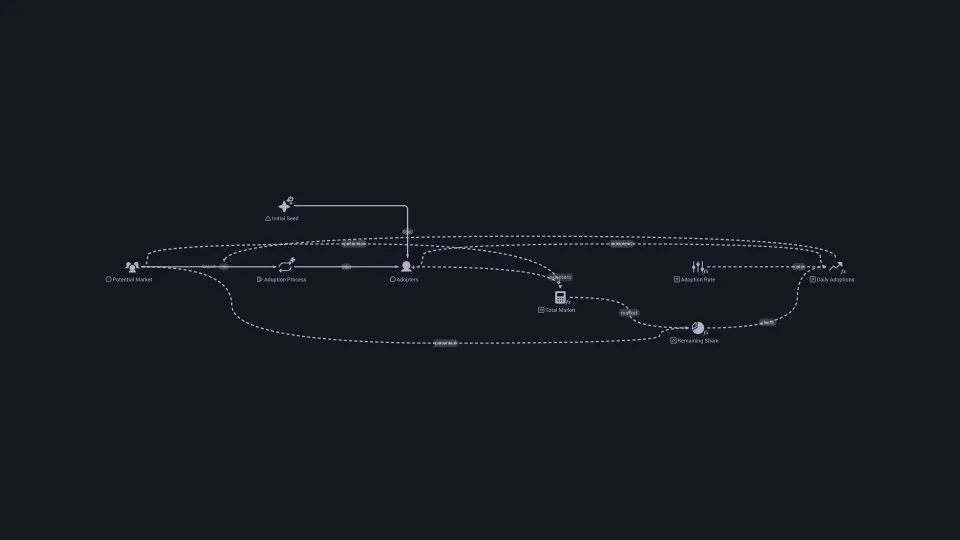
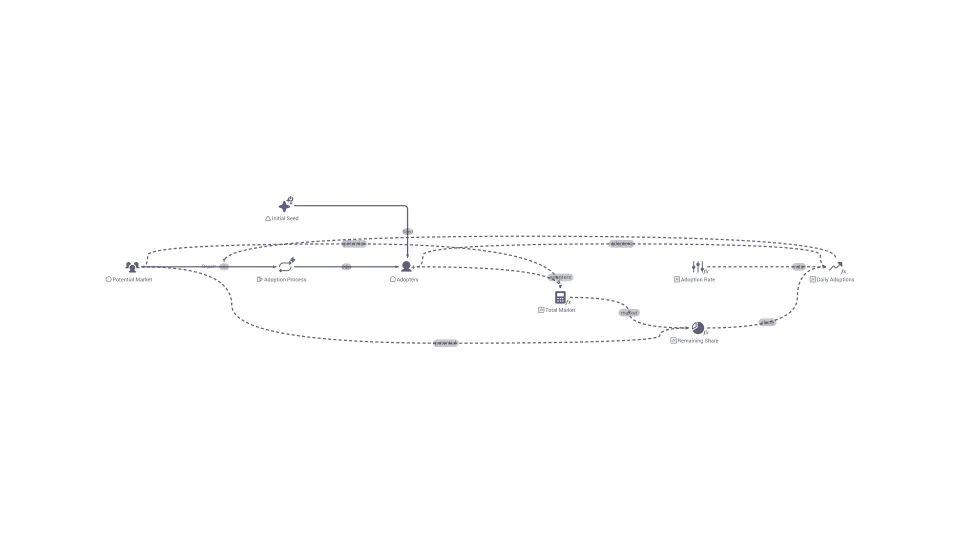
S-shaped growth
Growth that starts slowly, speeds up, and then slows down to level off at a limit, tracing a curve shaped like the letter S.
Safety stock
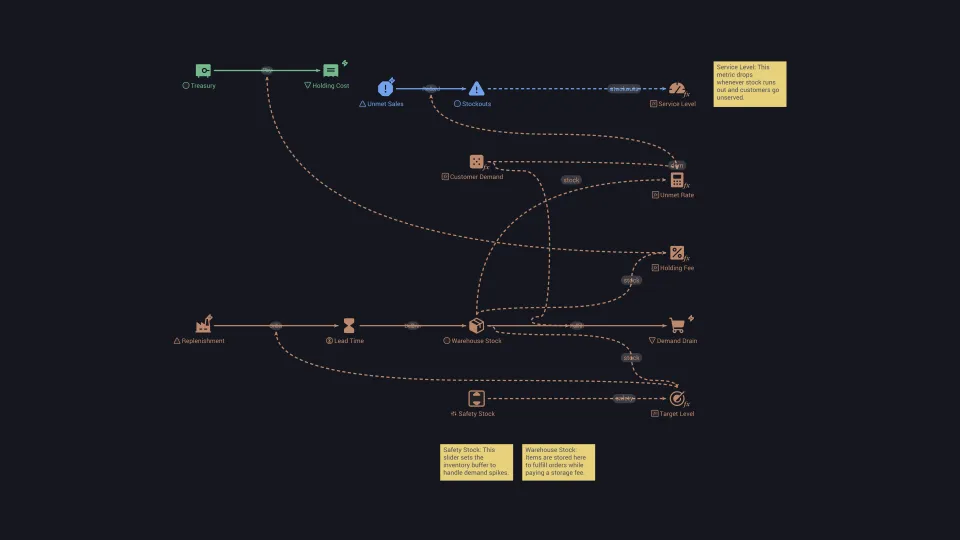
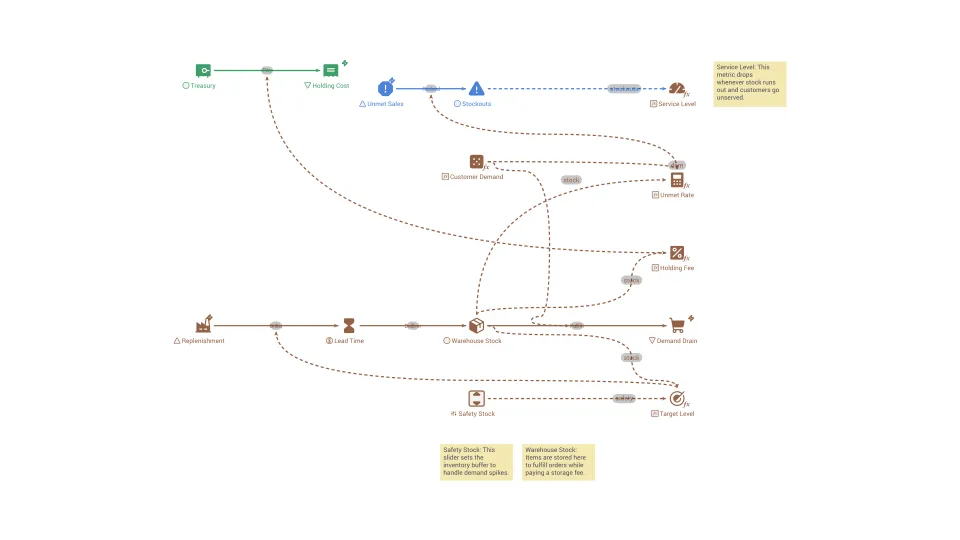
Extra inventory kept beyond expected demand to protect against surprises in demand or in delivery times.
Save abuse (save scumming)
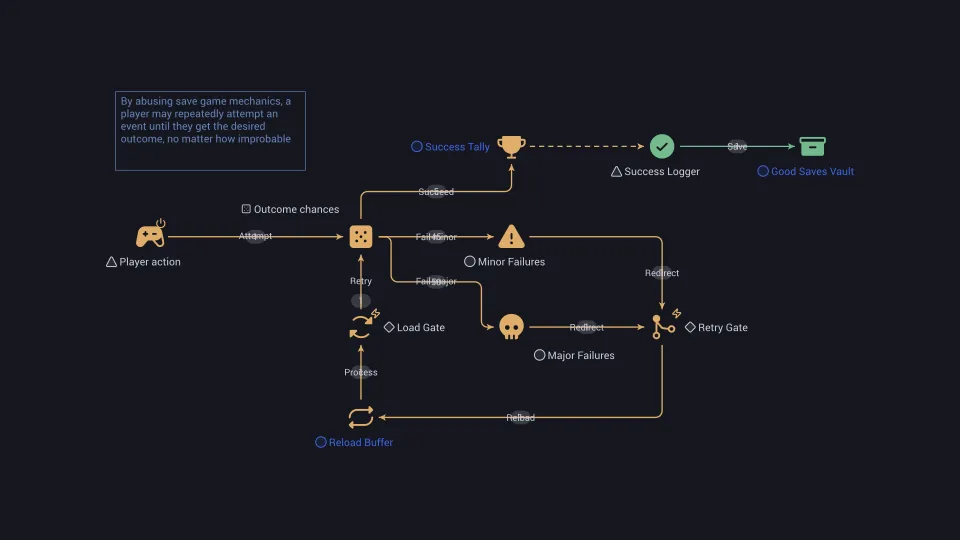
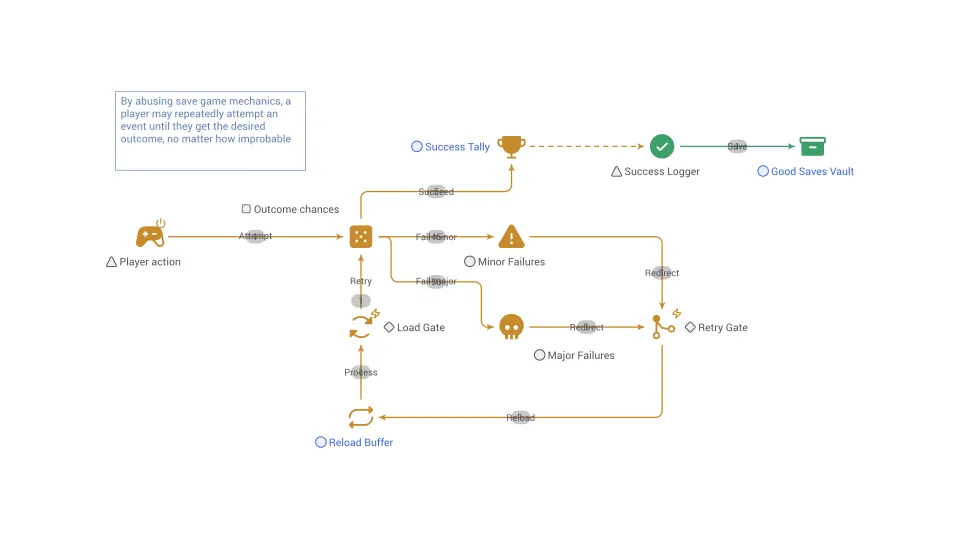
"Save abuse" refers to a gameplay strategy where a player frequently saves their progress in a game to avoid losing progress or avoid failure.
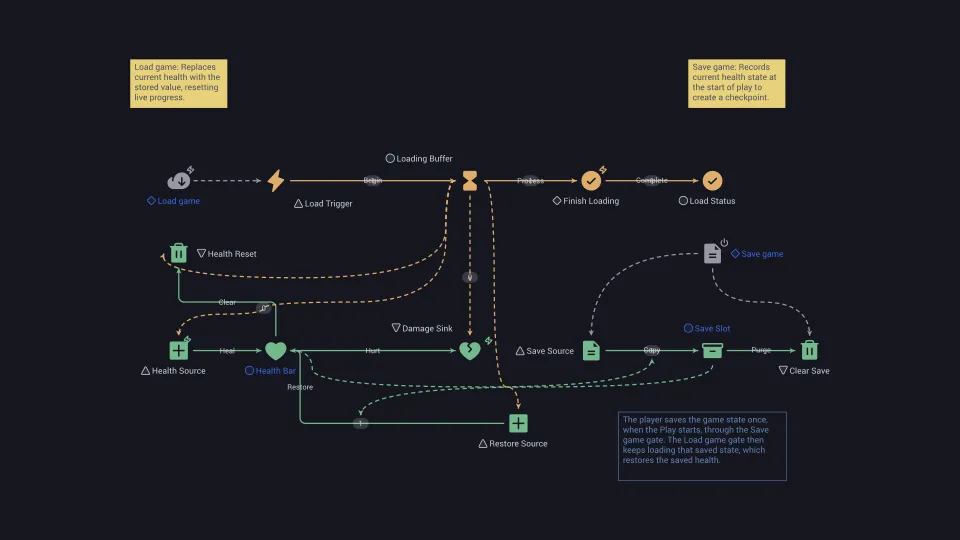
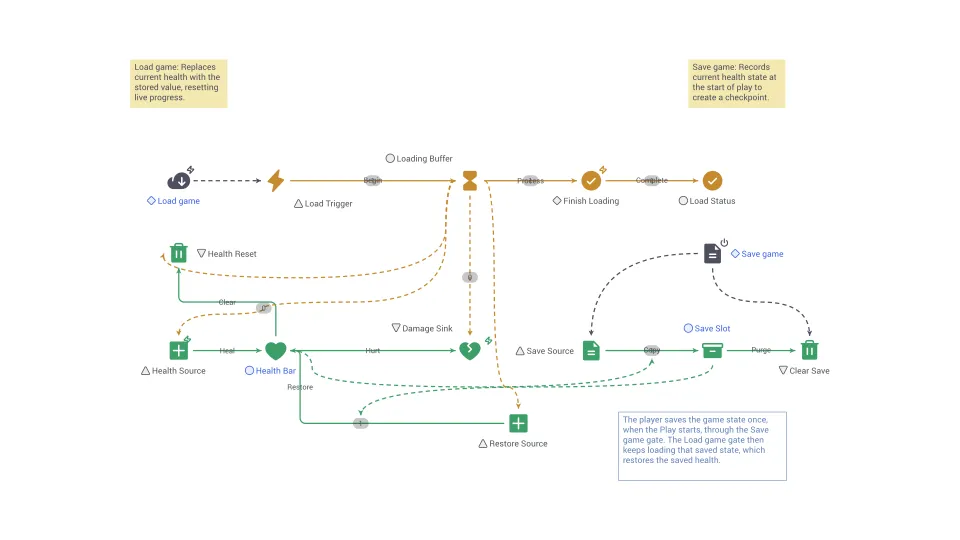
Save freedom
"Save Freedom" refers to the player's ability to control when and how their progress is saved within a game.
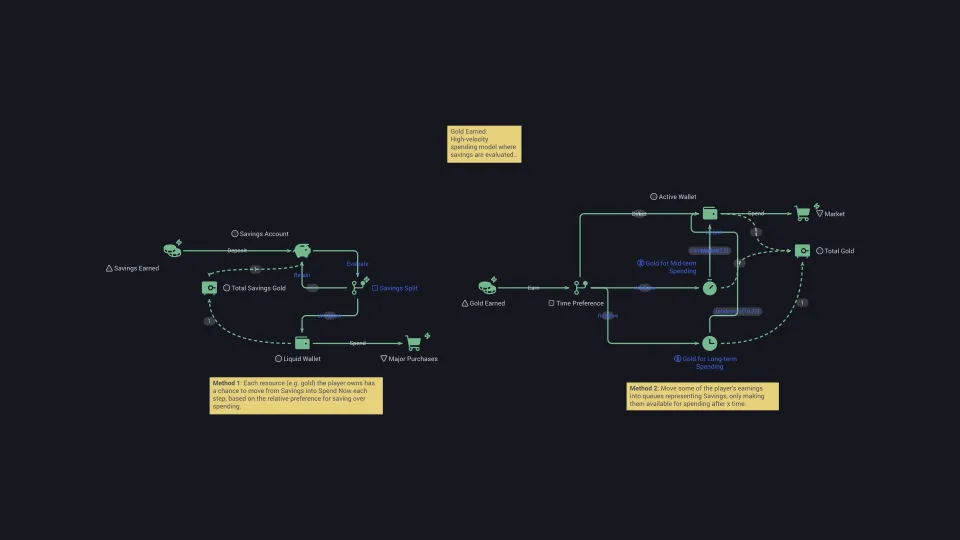
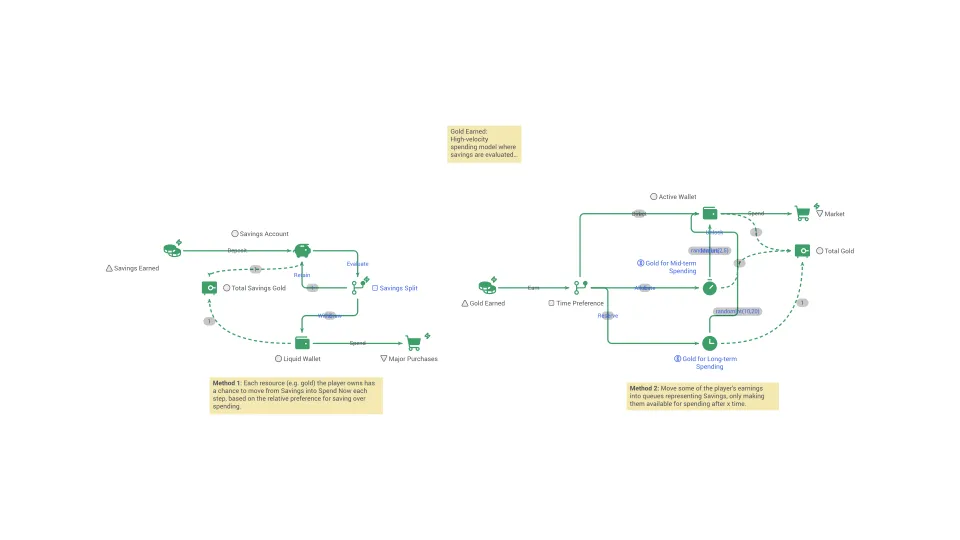
Savings / saving for the future
Setting aside part of current income instead of spending it, so that it can be used later.
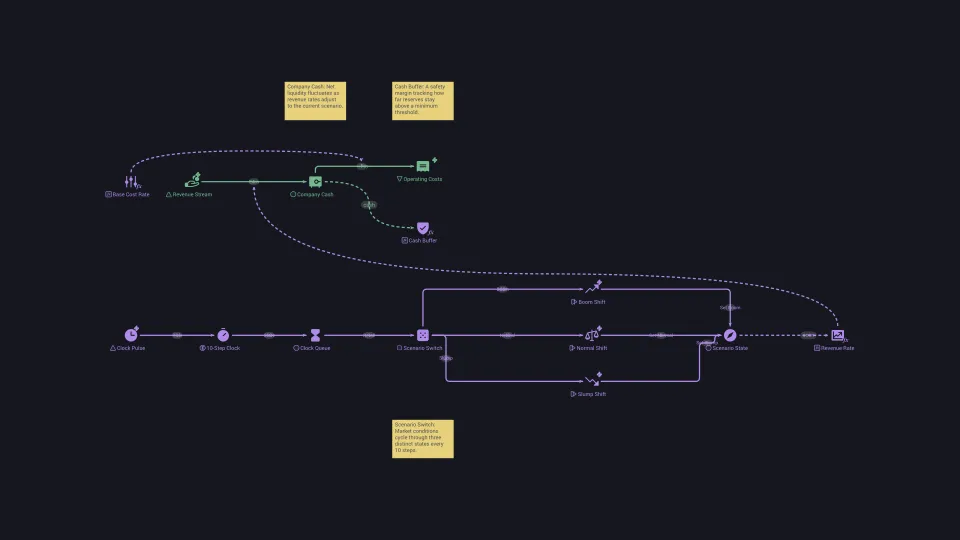
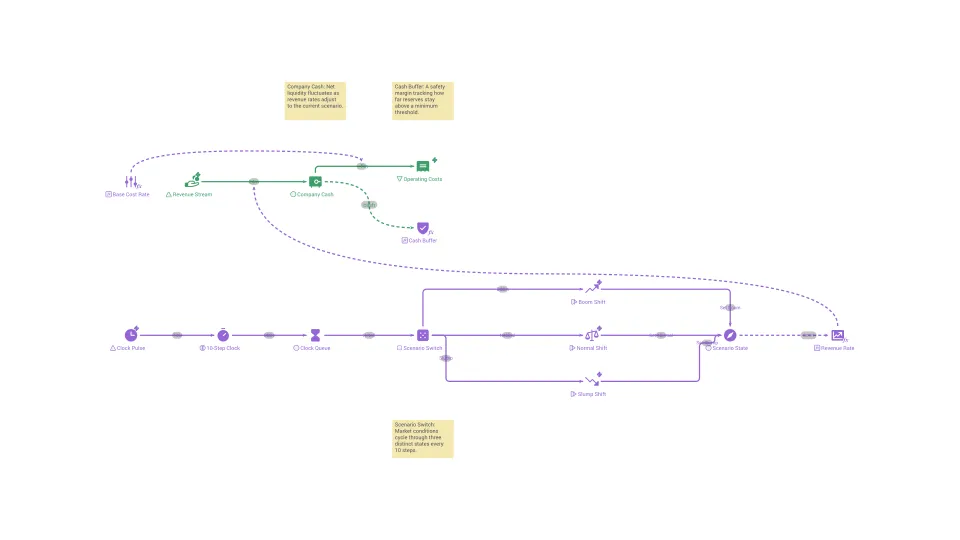
Scenario analysis
A method of exploring several distinct, internally consistent versions of the future and comparing how a plan performs in each.
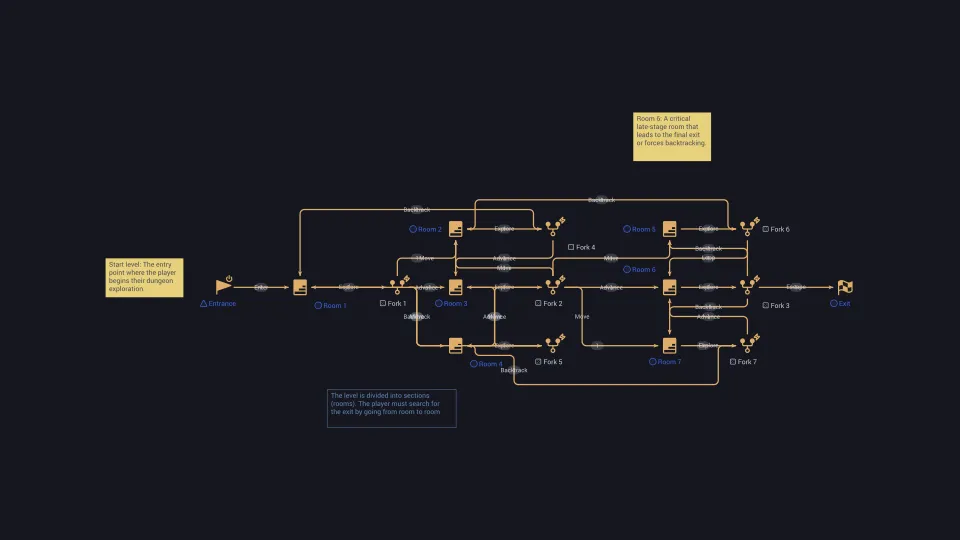
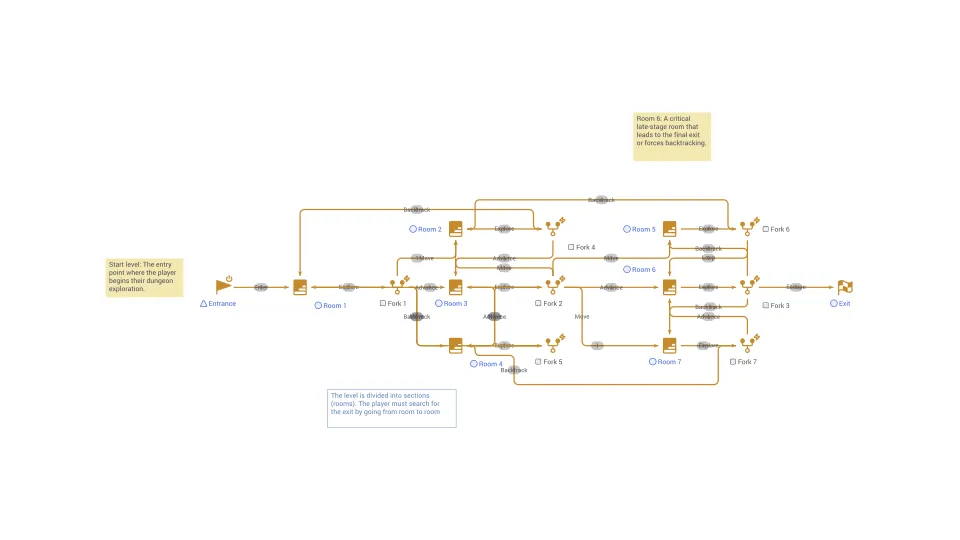
Sections (sub-sections)
Sections refer to distinct stages of a game that are separated by significant events, such as completing a level, defeating a boss, or reaching a checkpoint.
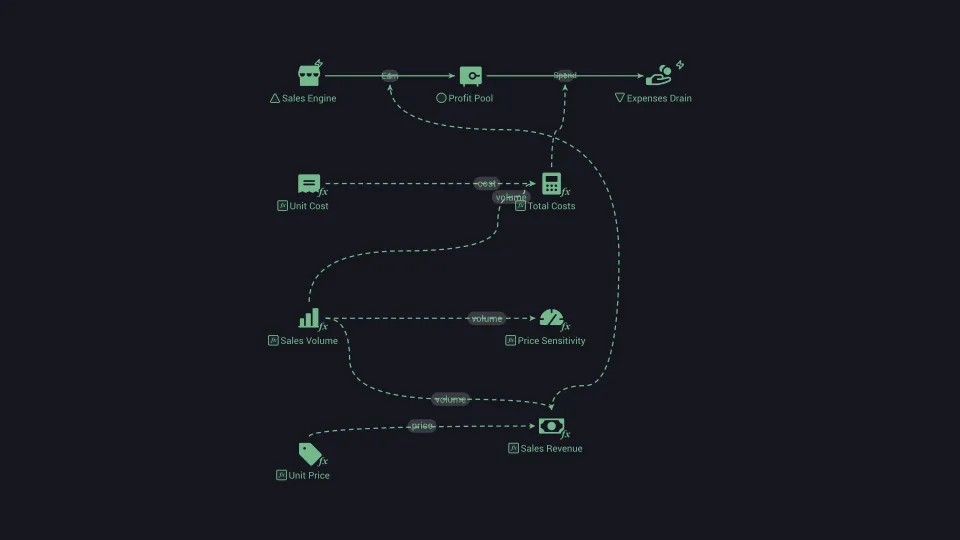
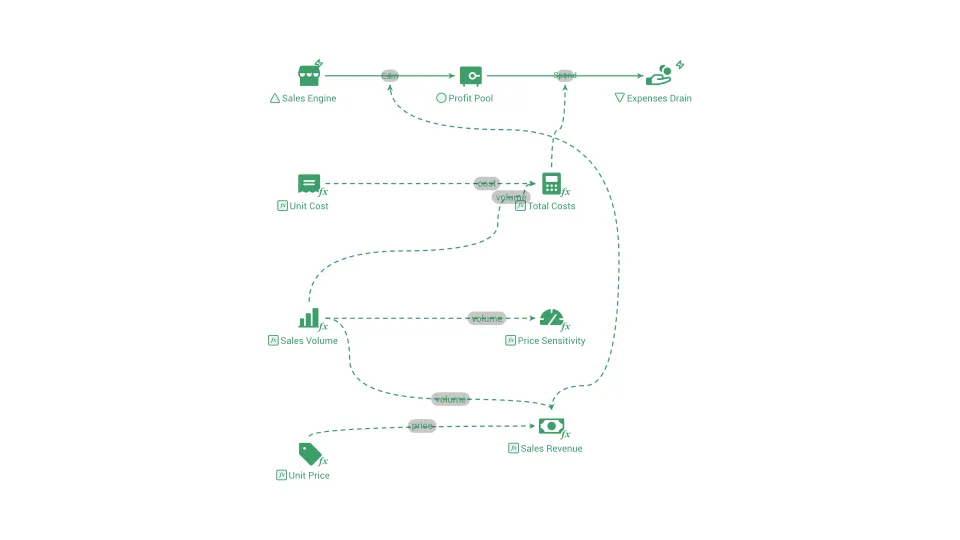
Sensitivity analysis
A way of finding which inputs most affect a model's result by changing them one at a time or together and measuring the change in output.
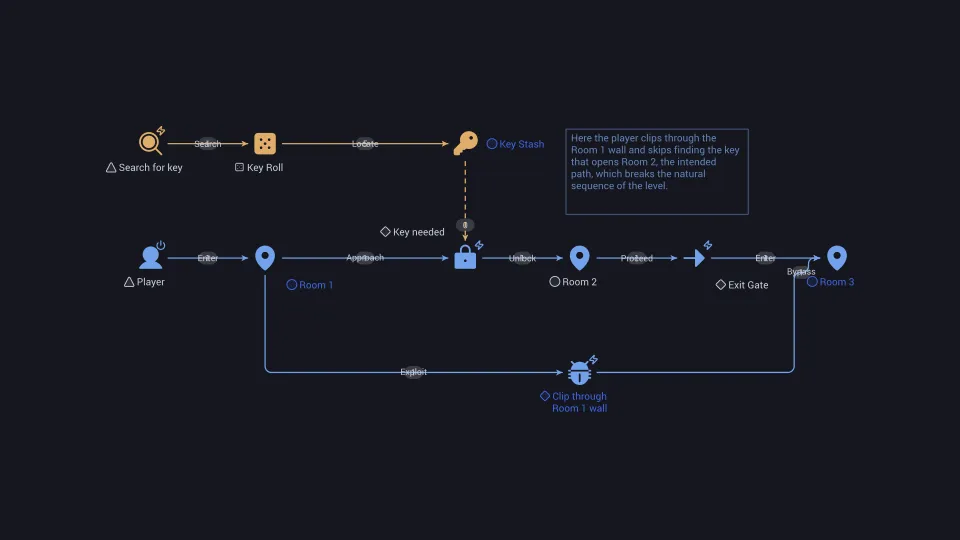
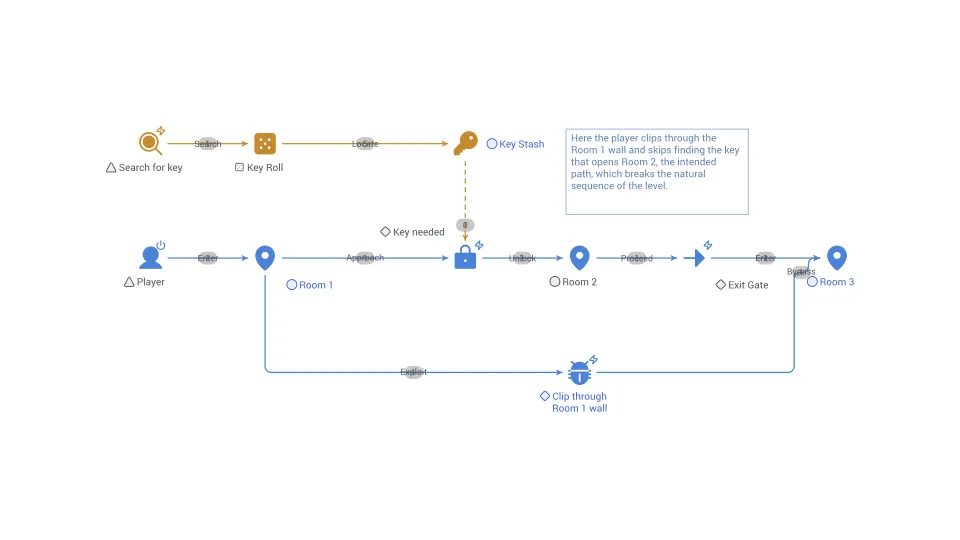
Sequence breaking
Sequence breaking in game design refers to the player intentionally deviating from the intended order or progression of events within a game.
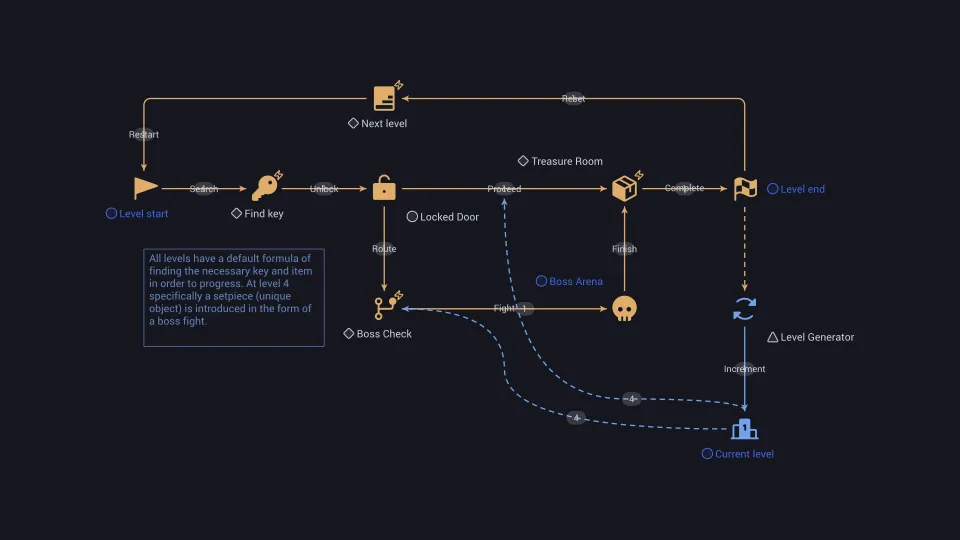
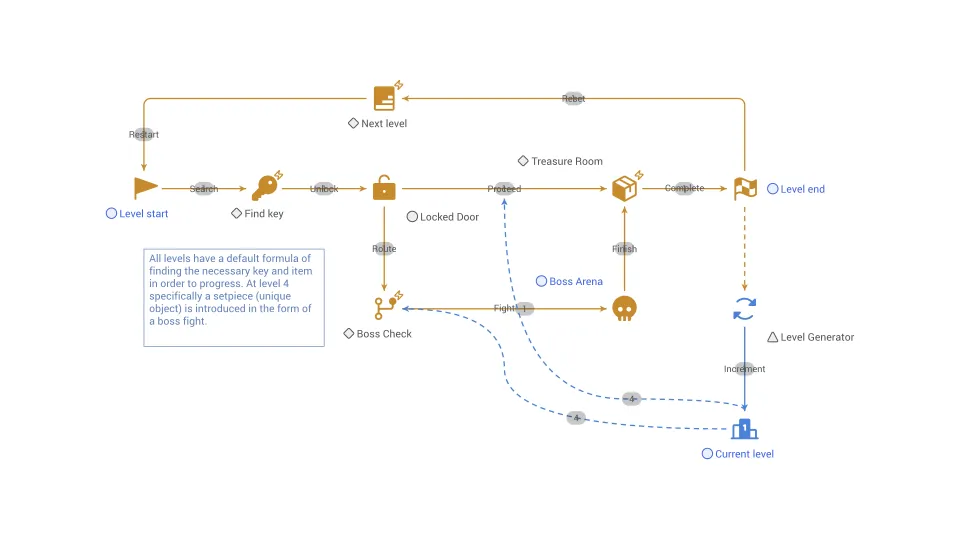
Setpiece
A Setpiece is a carefully crafted and scripted sequence within a game, designed to be visually striking, emotionally impactful, and often highly memorable.
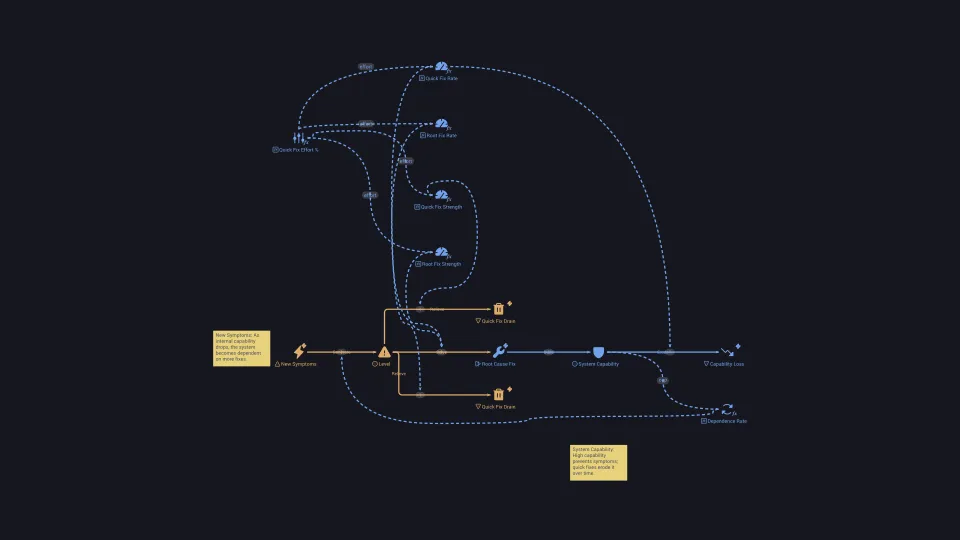
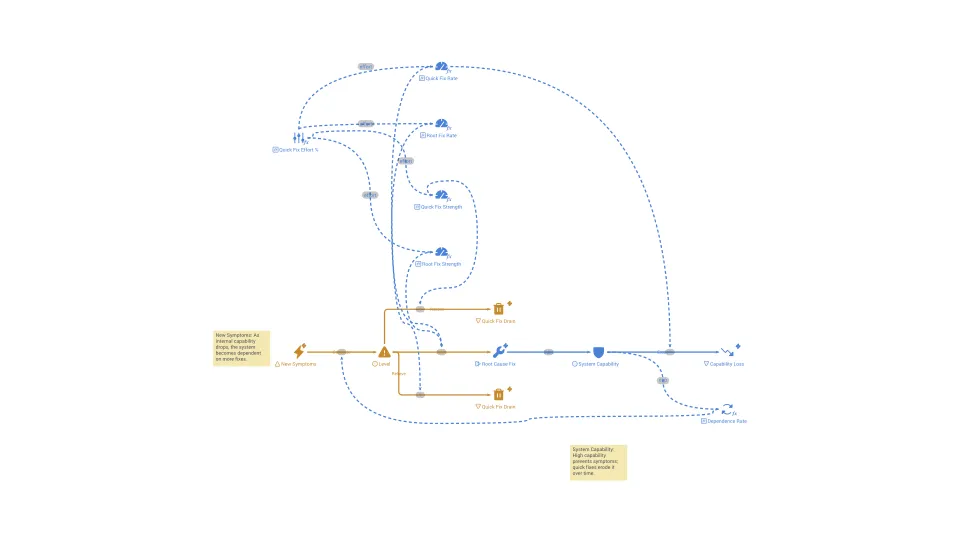
Shifting the burden
A pattern in which a quick fix relieves a symptom, weakens the effort to fix the root cause, and leaves the system more dependent on the quick fix.
Shortage and surplus
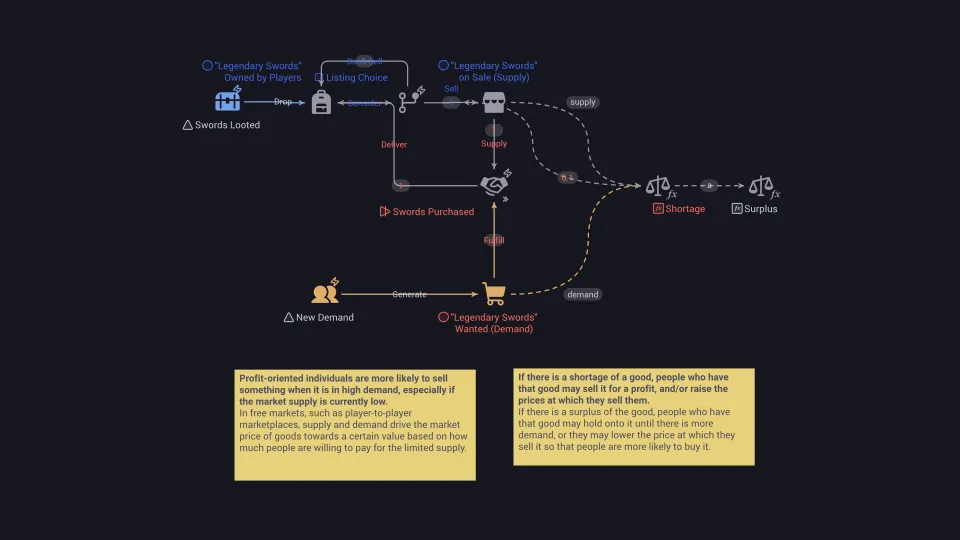
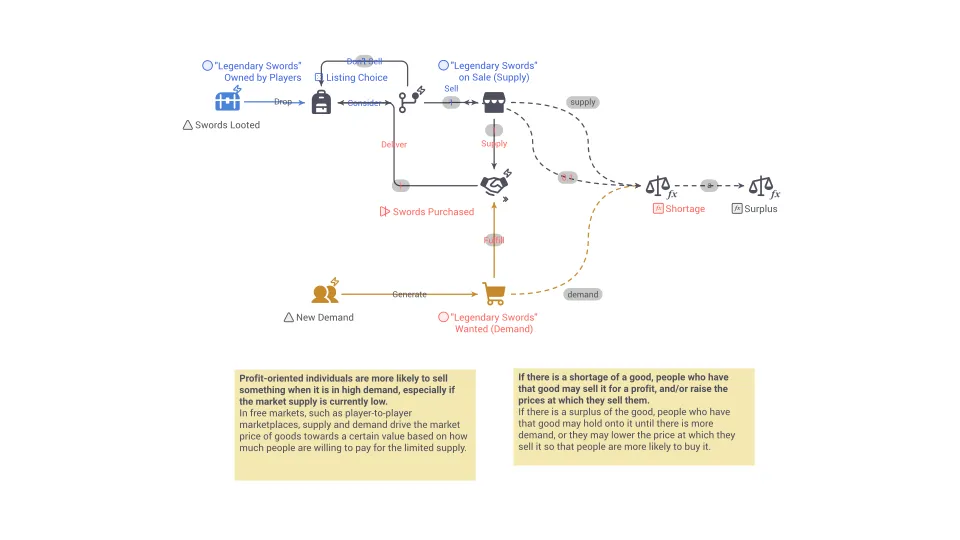
A shortage is when buyers want more than is available at the current price, and a surplus is when more is offered than buyers want.
Simulation optimization
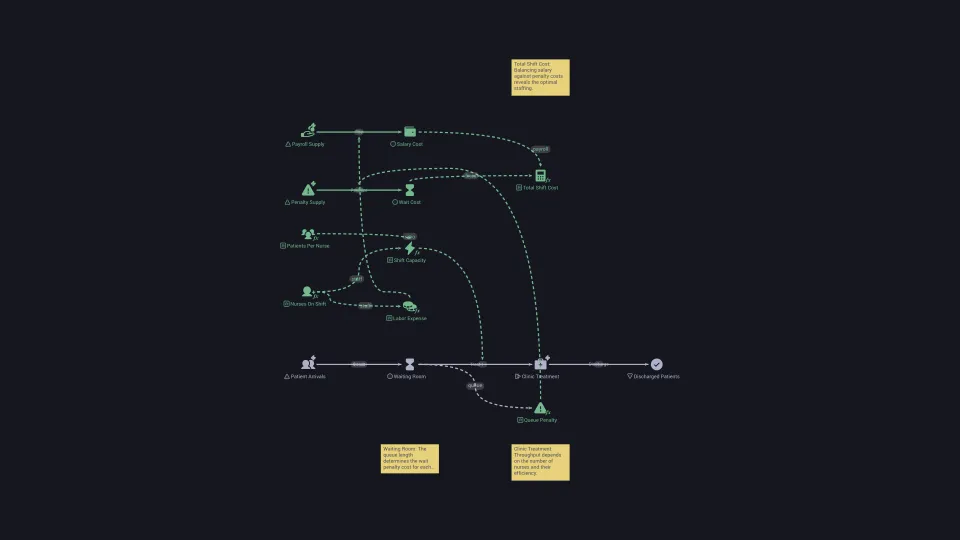
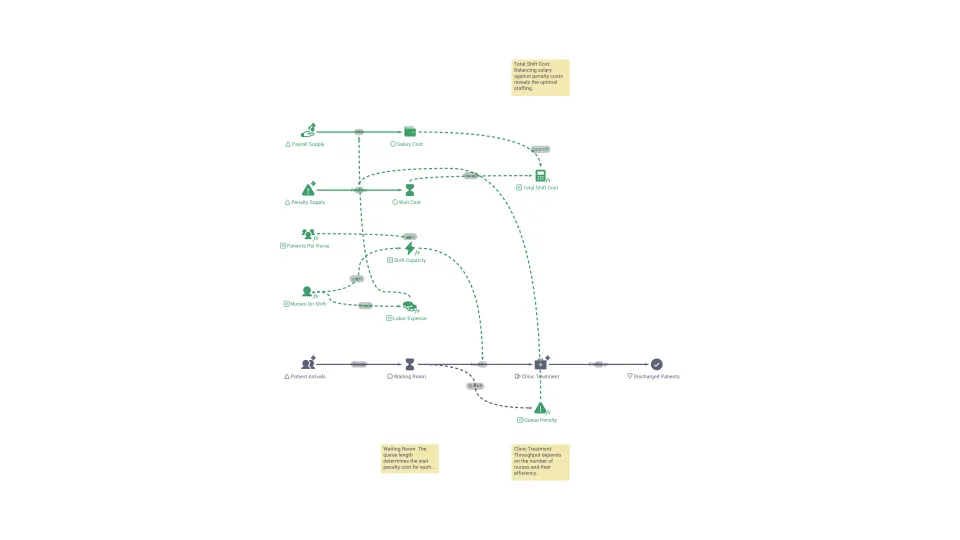
Searching for the best settings of a model's decisions by repeatedly running the simulation and comparing the results.
SIR model
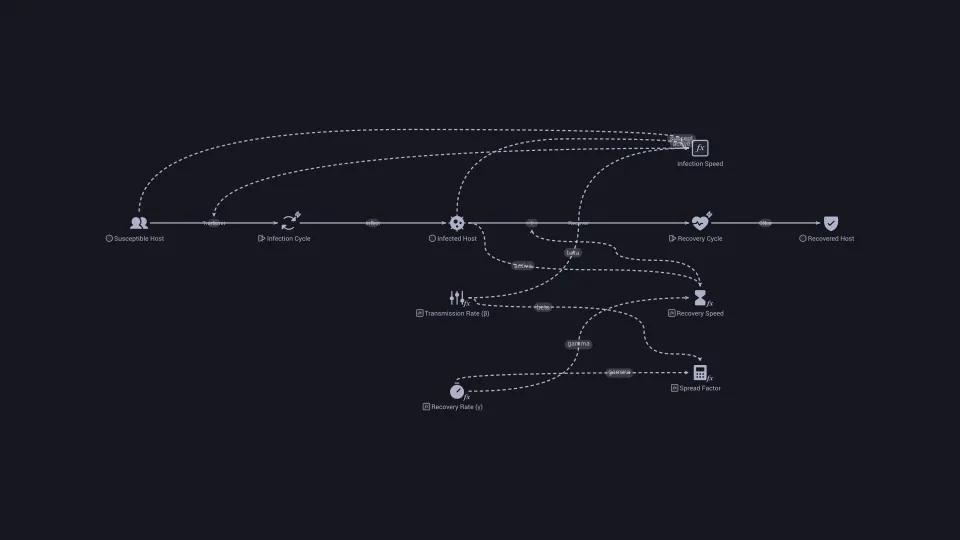
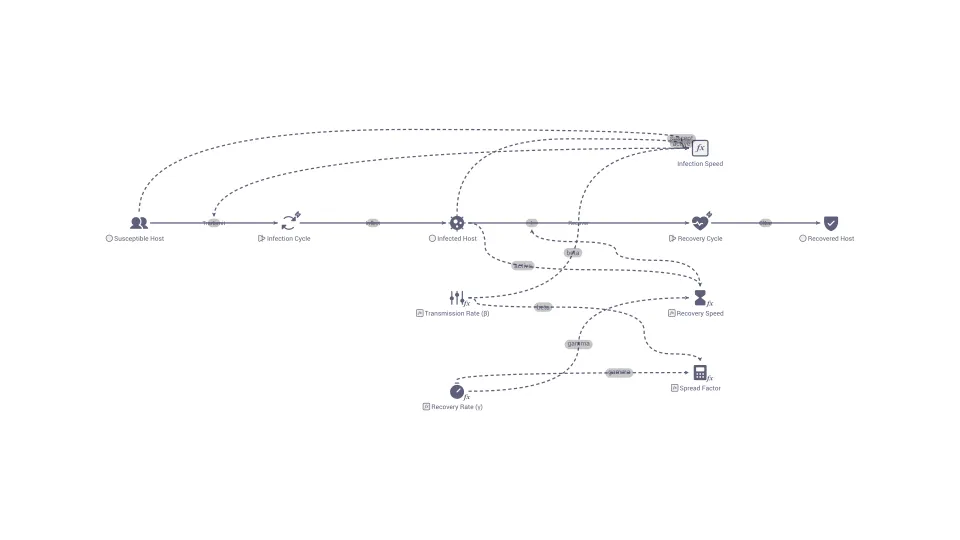
A model that splits a population into susceptible, infected, and recovered groups to show how an infection spreads and fades.
Slippery slope (same as positive feedback loop)
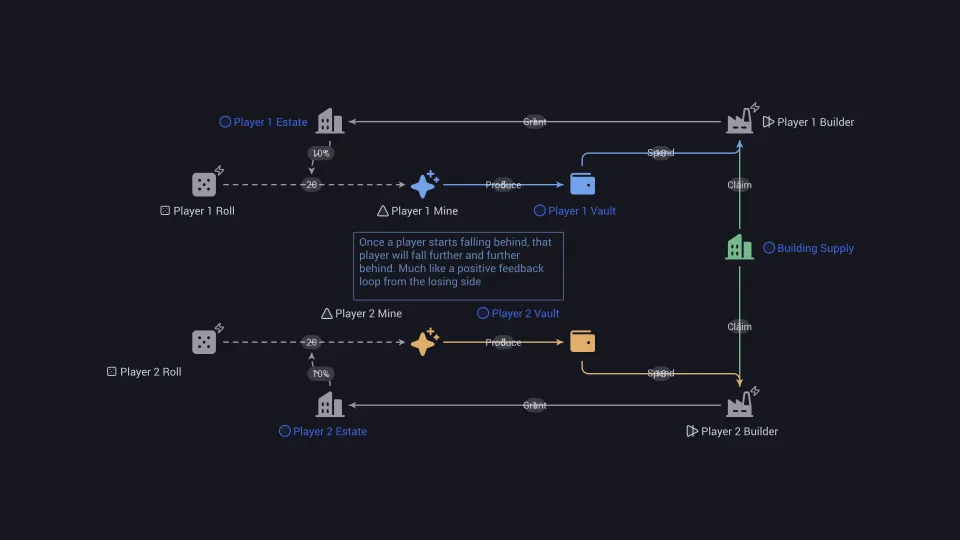
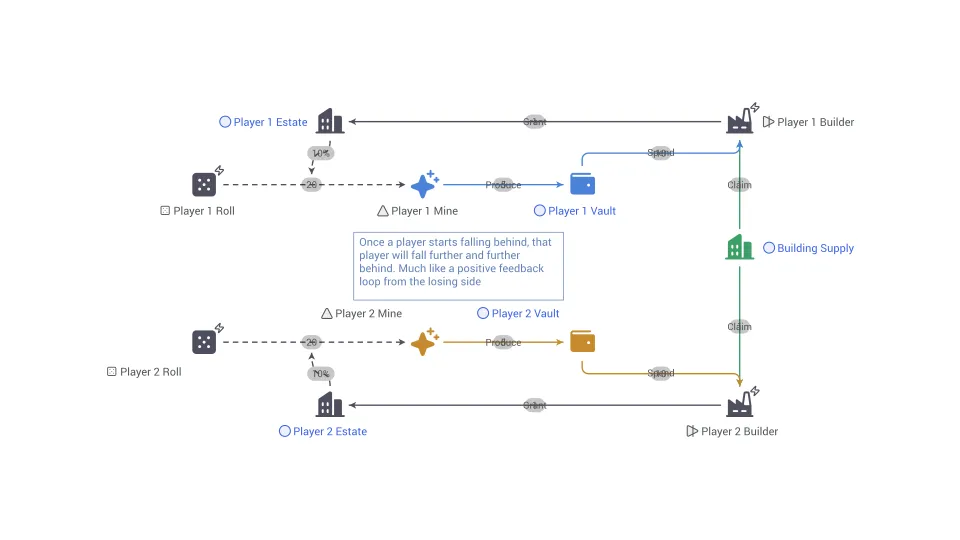
A Slippery Slope is a design concept where a small initial disadvantage or mistake can lead to a progressively worsening situation for a player.
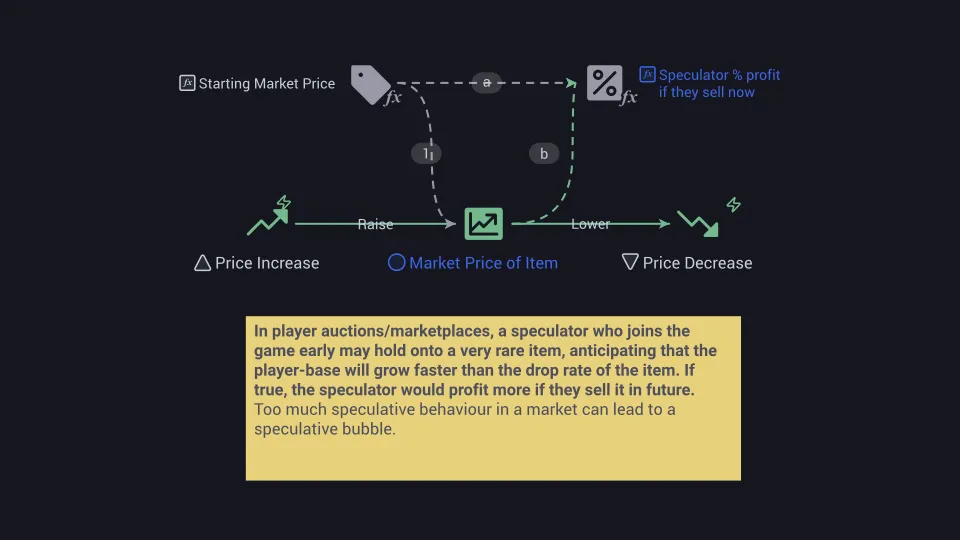
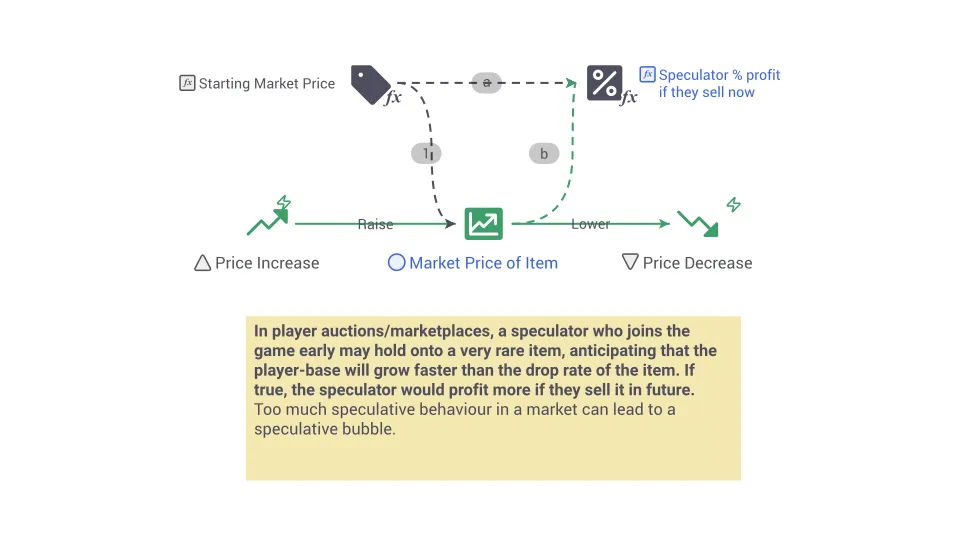
Speculation
Buying an asset mainly to profit from a change in its price, not from the use or income it provides.
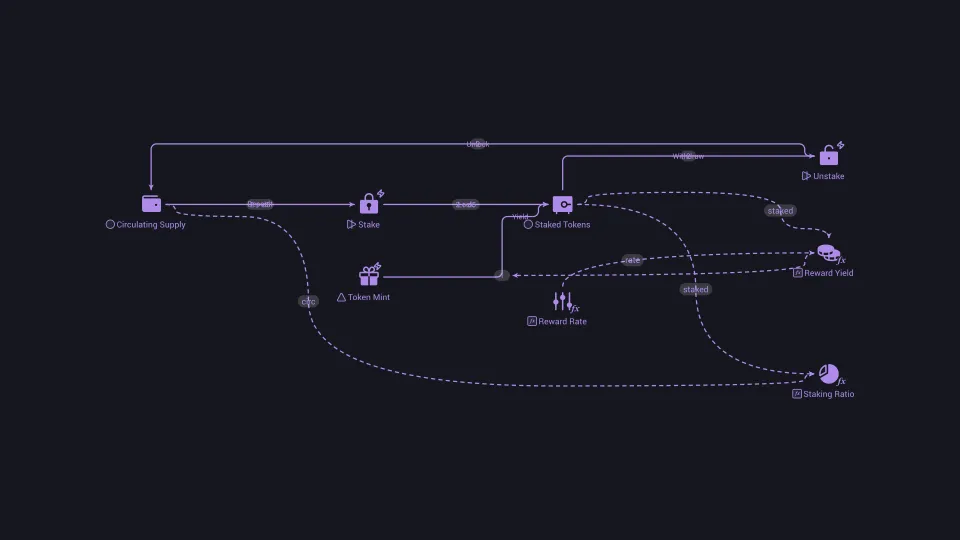
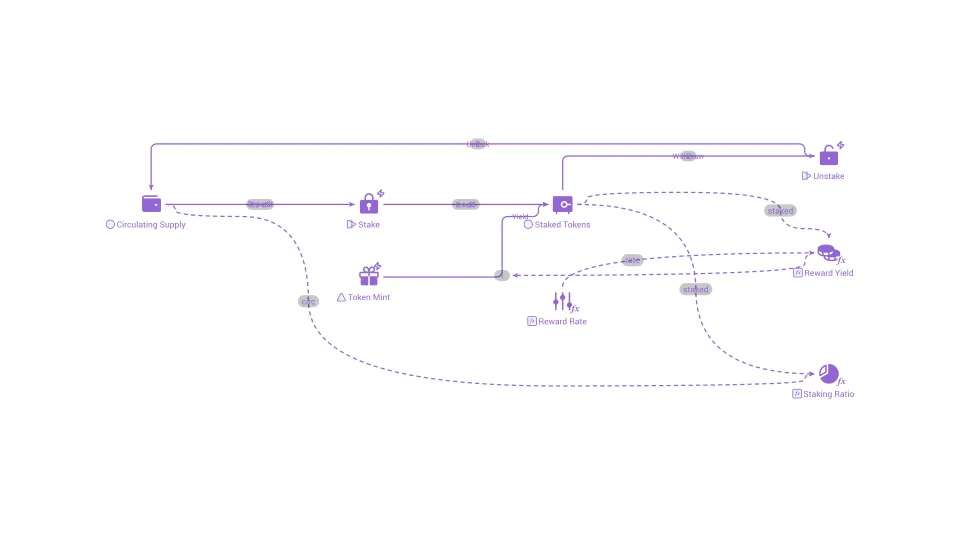
Staking
Locking tokens for a period in return for rewards or rights, which takes them out of circulation while they are locked.
Stochastic simulation
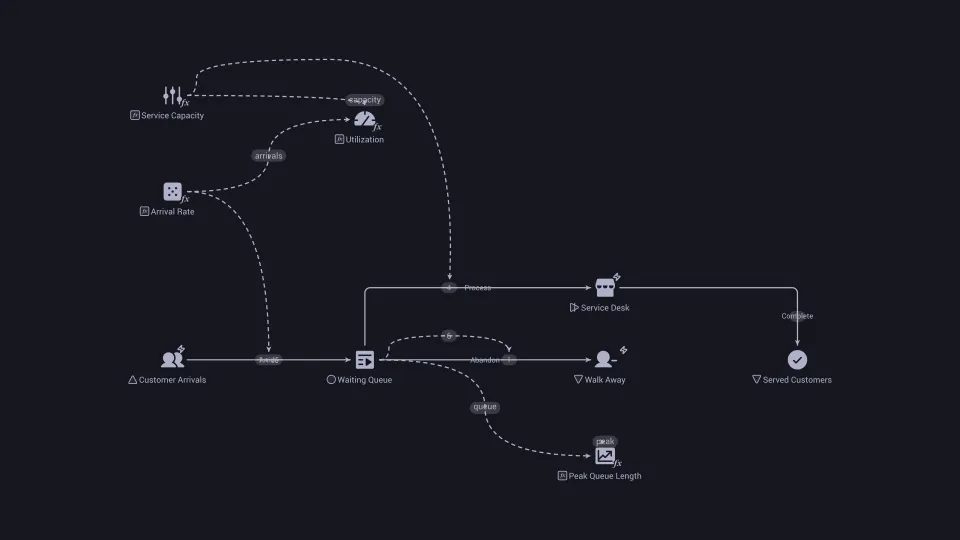
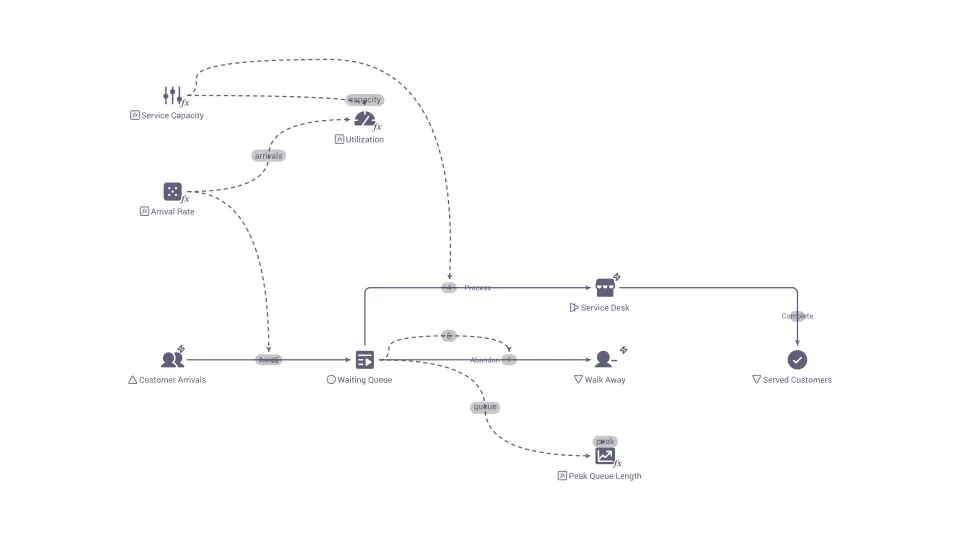
A simulation in which some inputs are random, so each run gives a different result and many runs are needed to see the range.
Stock and flow
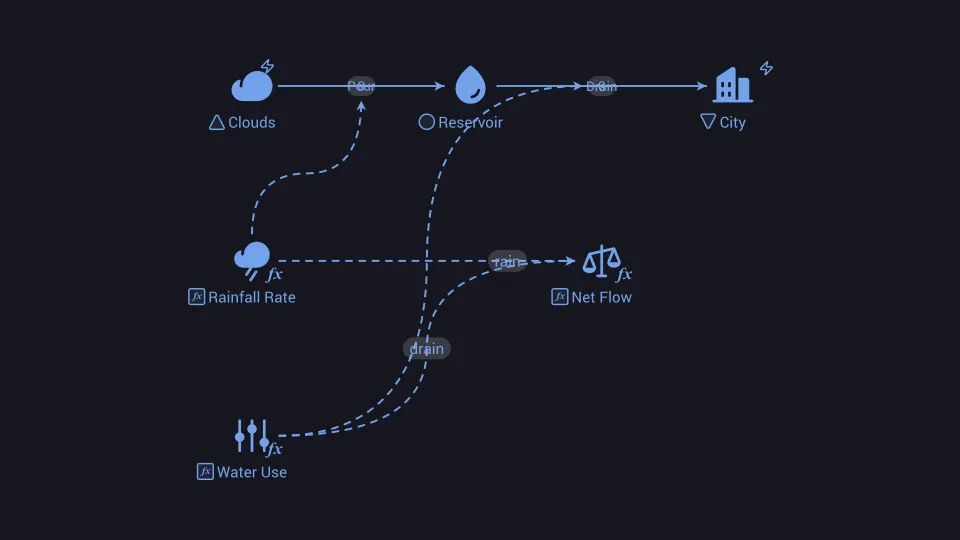
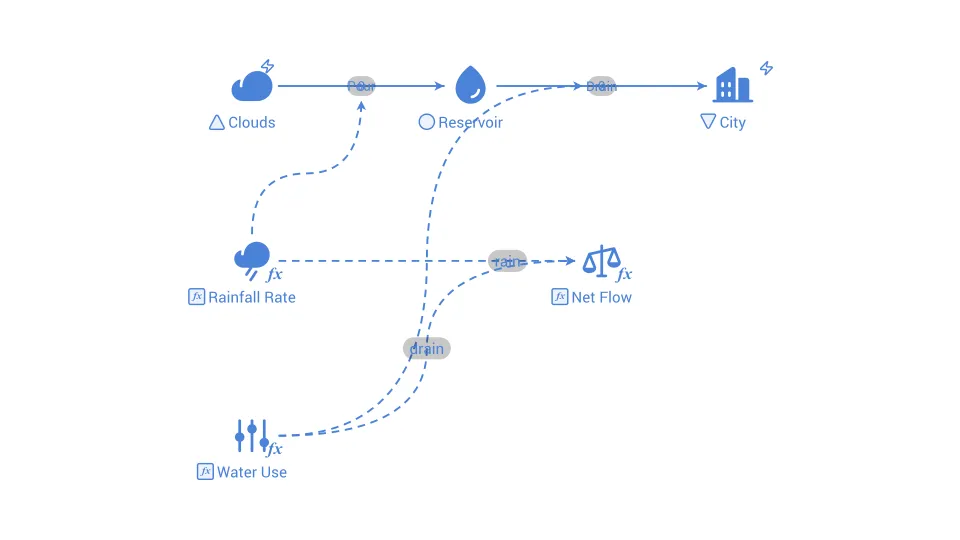
A way of describing a system by what it accumulates (stocks) and the rates that fill or drain those accumulations (flows).
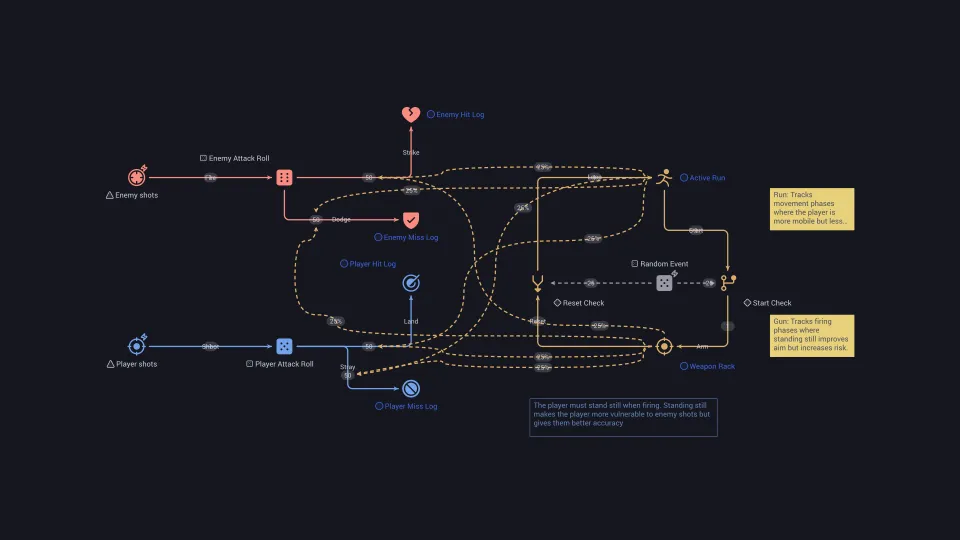
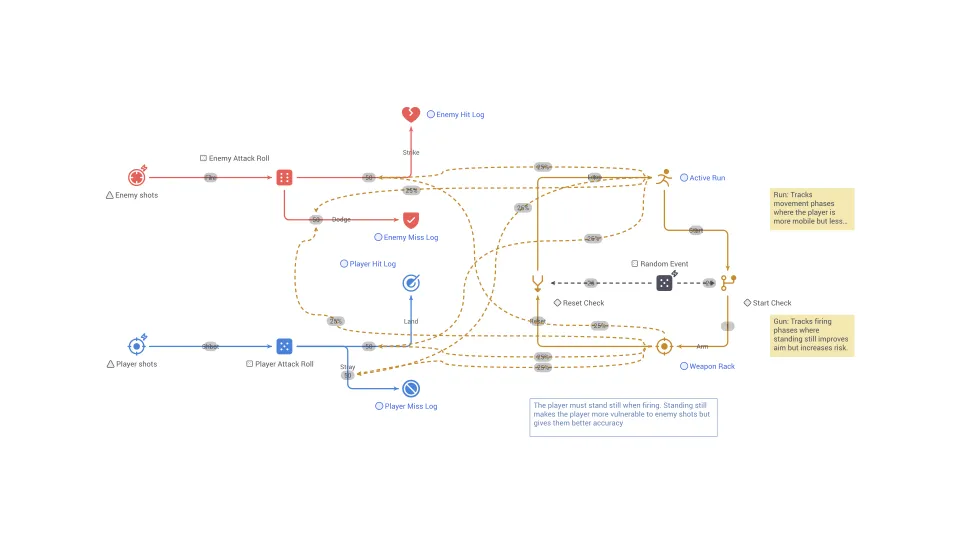
Stop-And-Pop (similar to stand-And-Strike)
In shooter games, Stop-And-Pop is a gameplay mechanic that doesn't allow players to fire a type of weapon while moving.
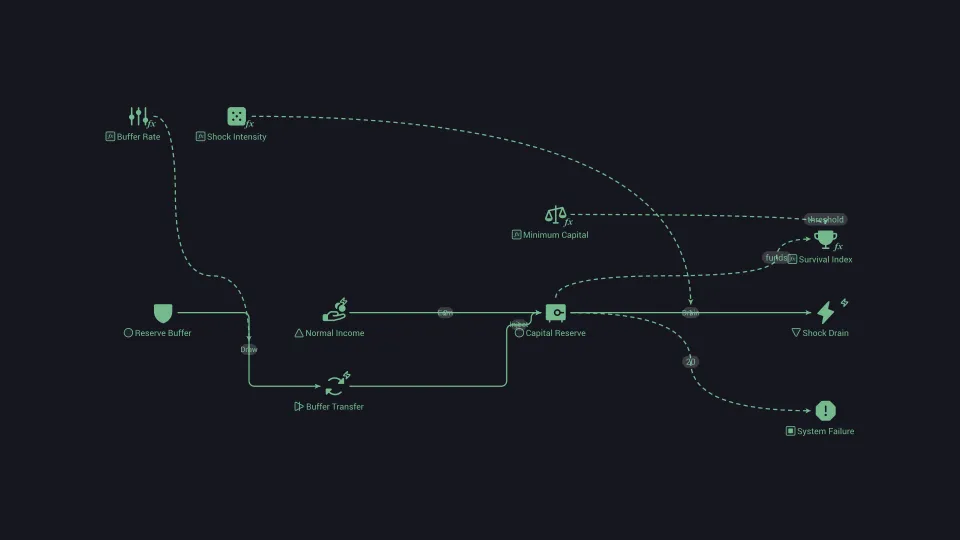
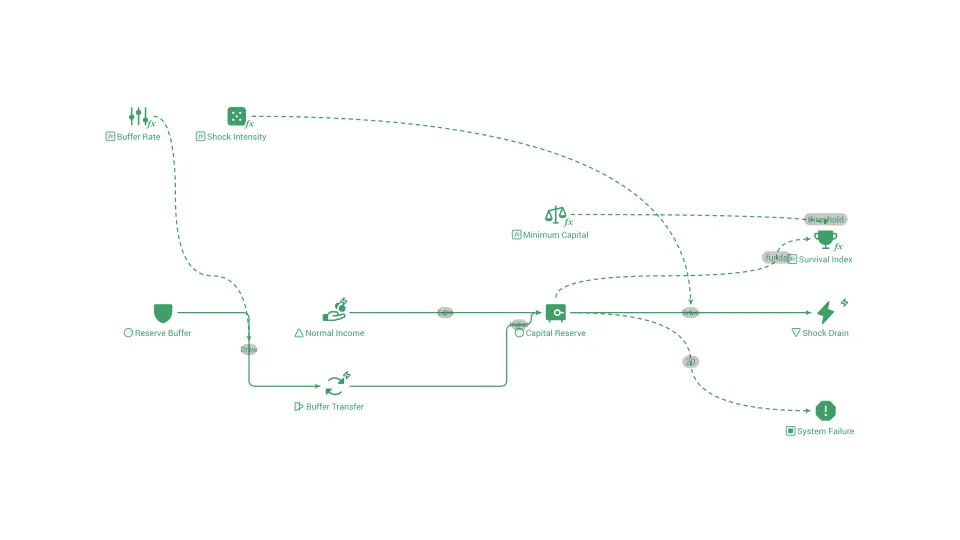
Stress test
A test that applies extreme but plausible shocks to a system to see whether it holds up and where it breaks first.
Substitutable good
A good that can replace another because it serves the same need, so a rise in one price shifts demand to the other.
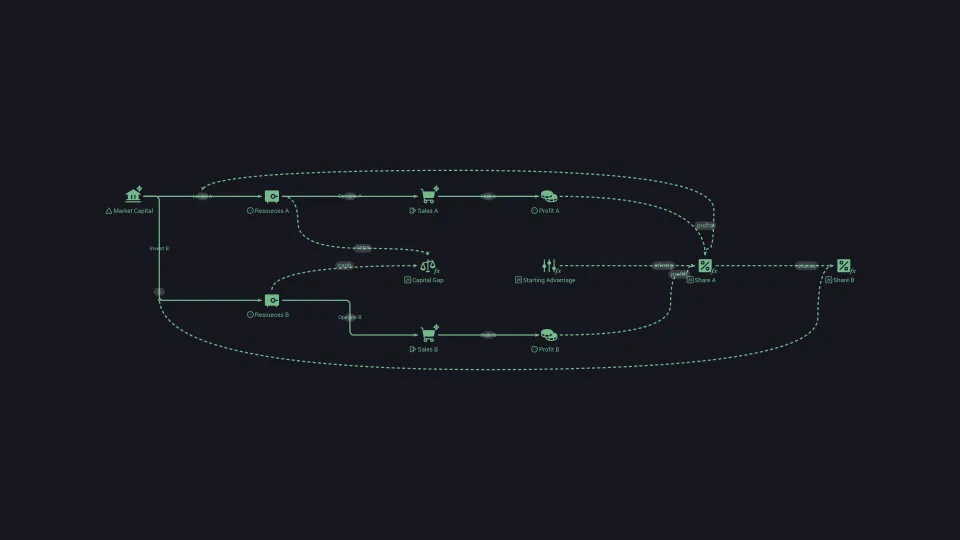
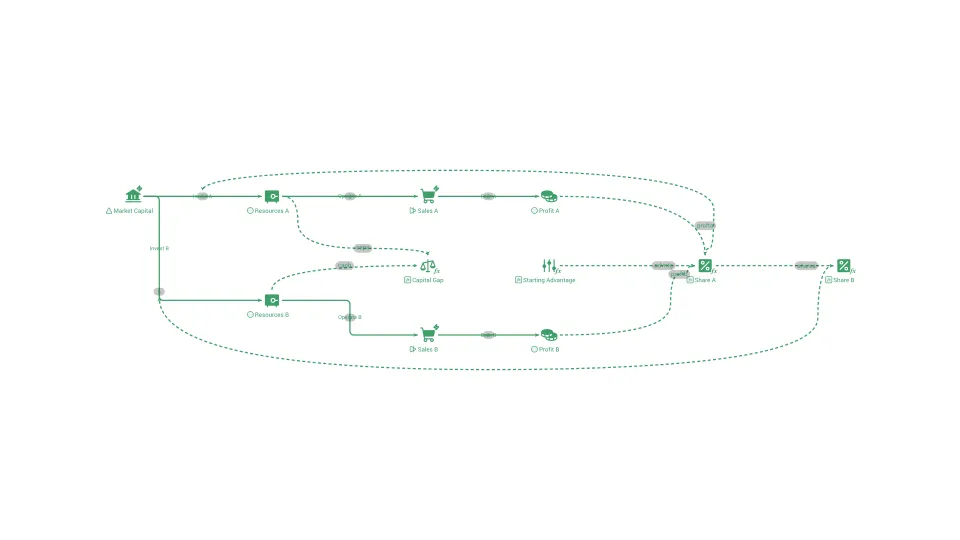
Success to the successful
A pattern in which the winner of an early advantage receives more resources, which makes it win again, starving its competitors.
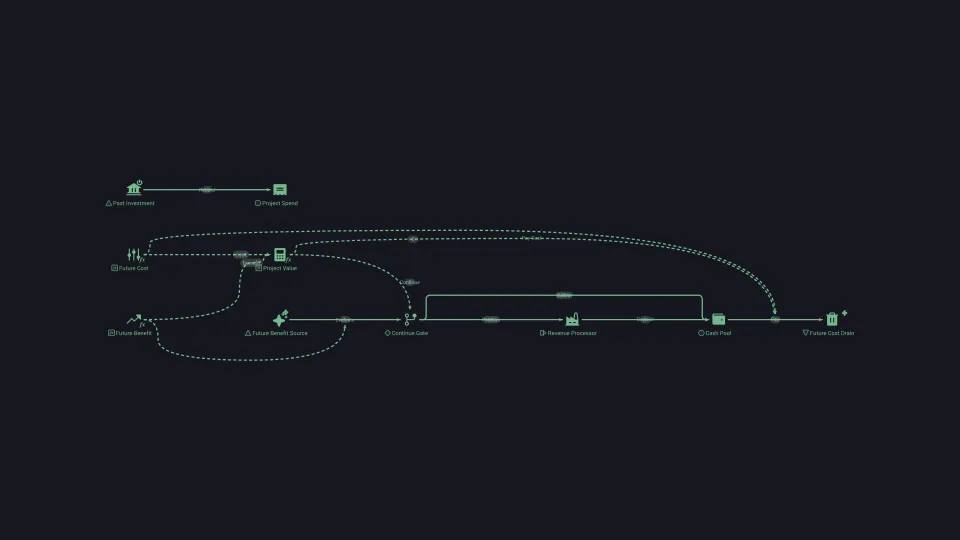
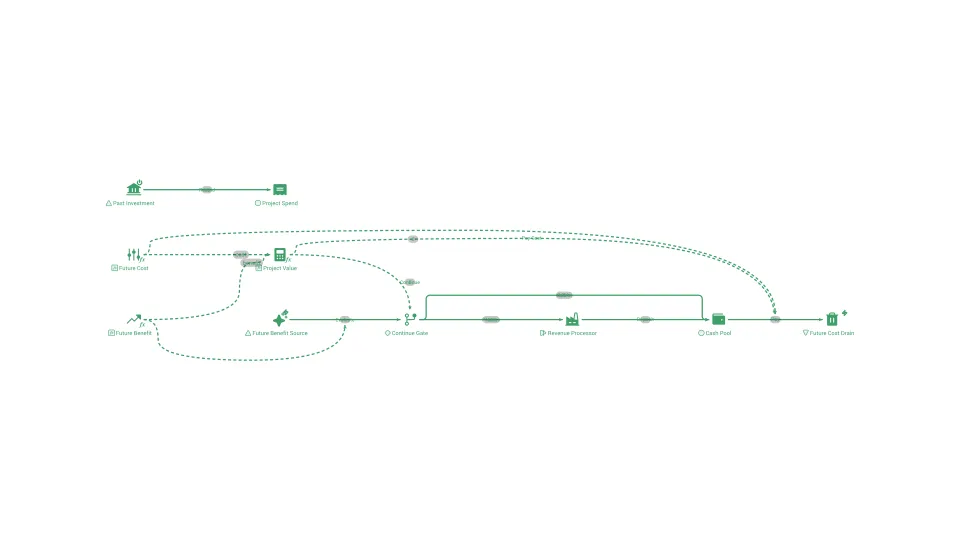
Sunk cost
Money or effort already spent that cannot be recovered, and so should not change what you decide to do next.
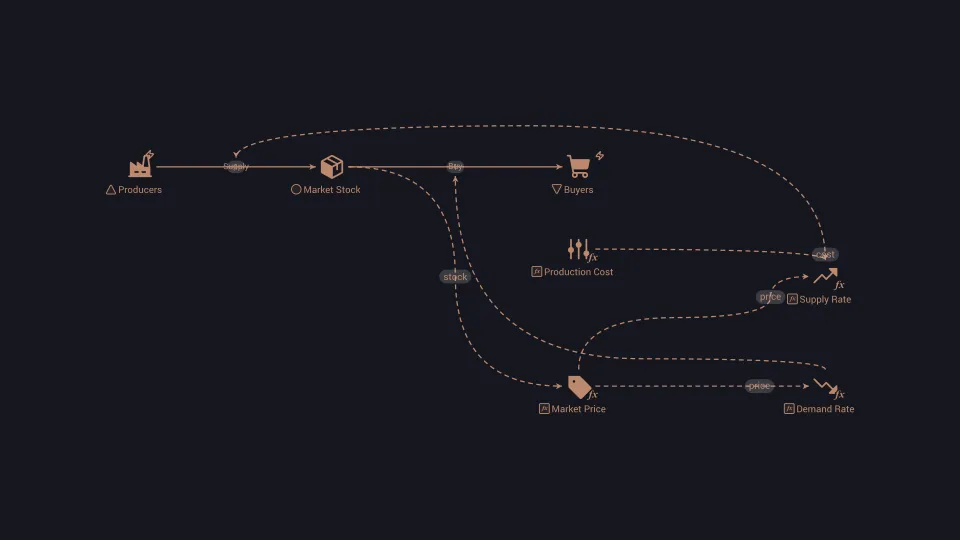
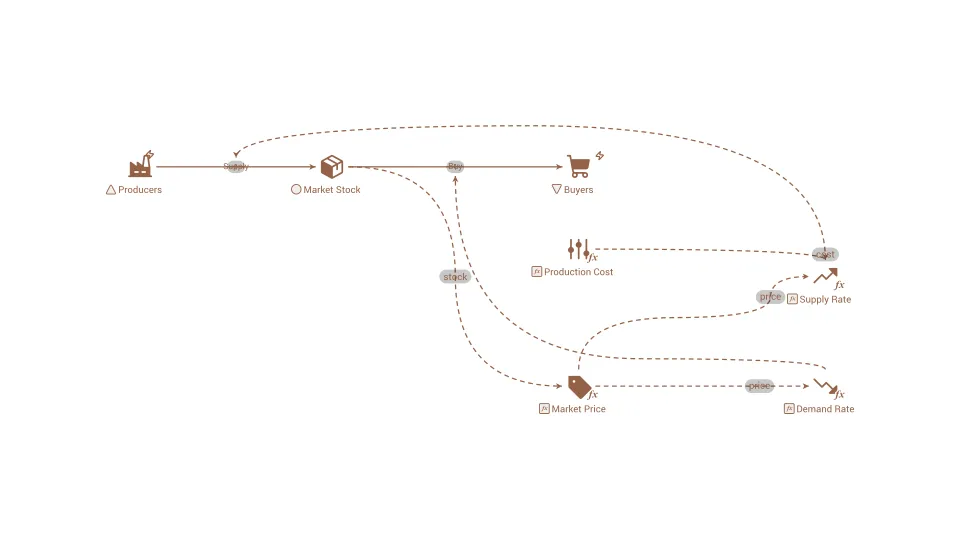
Supply and demand
The model in which a market price settles where the quantity buyers want equals the quantity sellers offer.
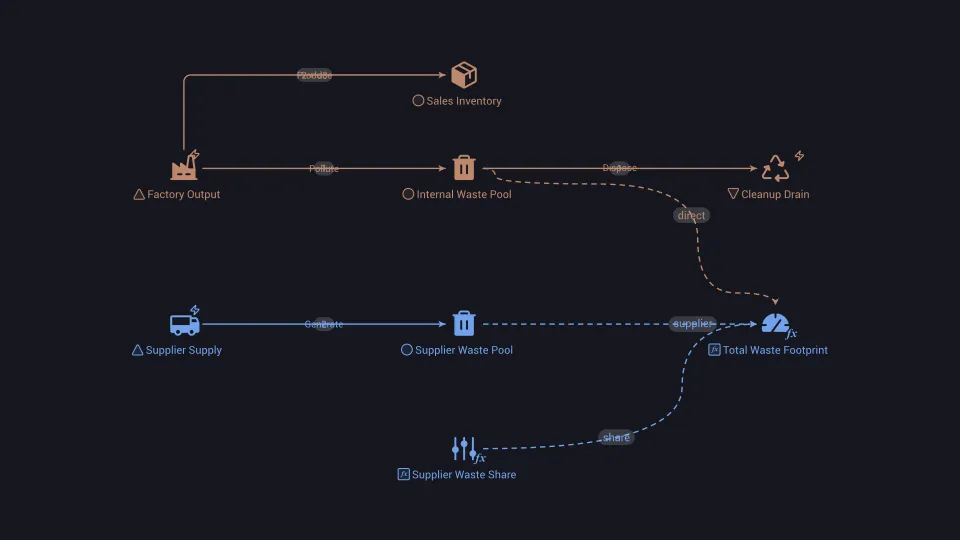
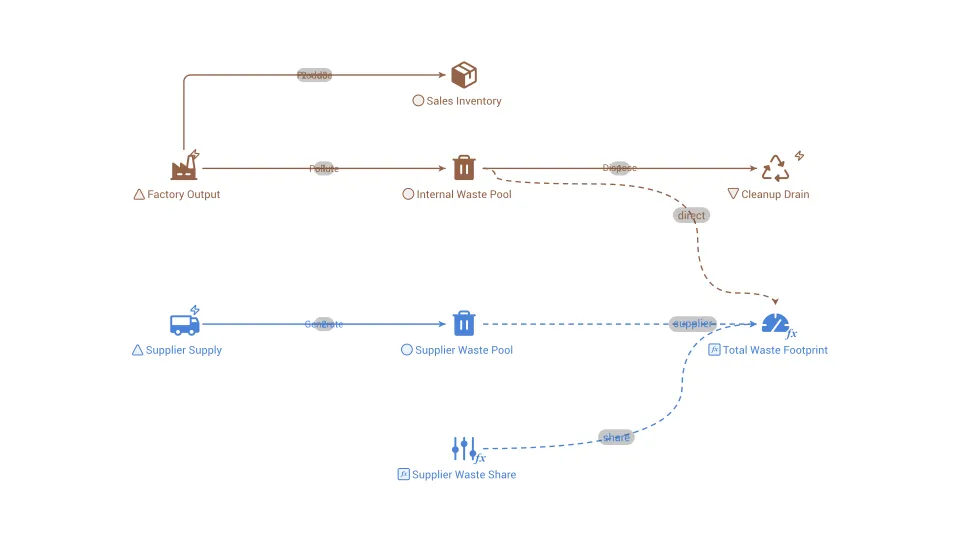
System boundary
The line that separates what a model includes from what it leaves out, which decides what questions the model can answer.
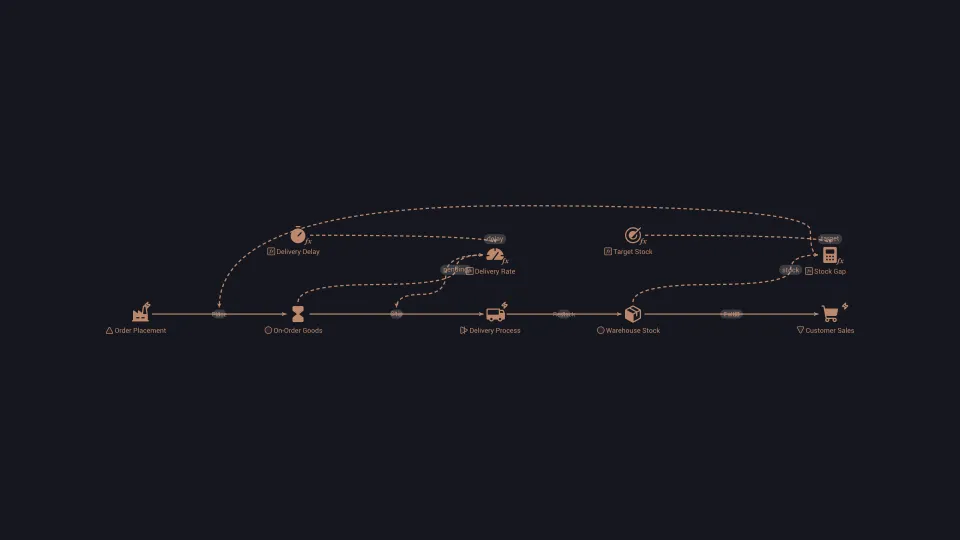
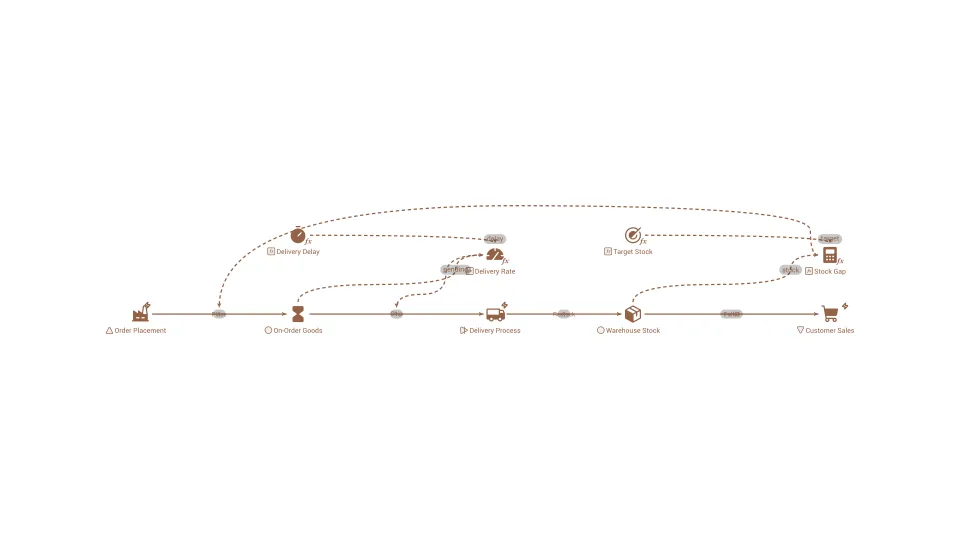
System delay
A time gap between an action and its visible effect in a system, which makes correction hard and often causes overshoot and oscillation.
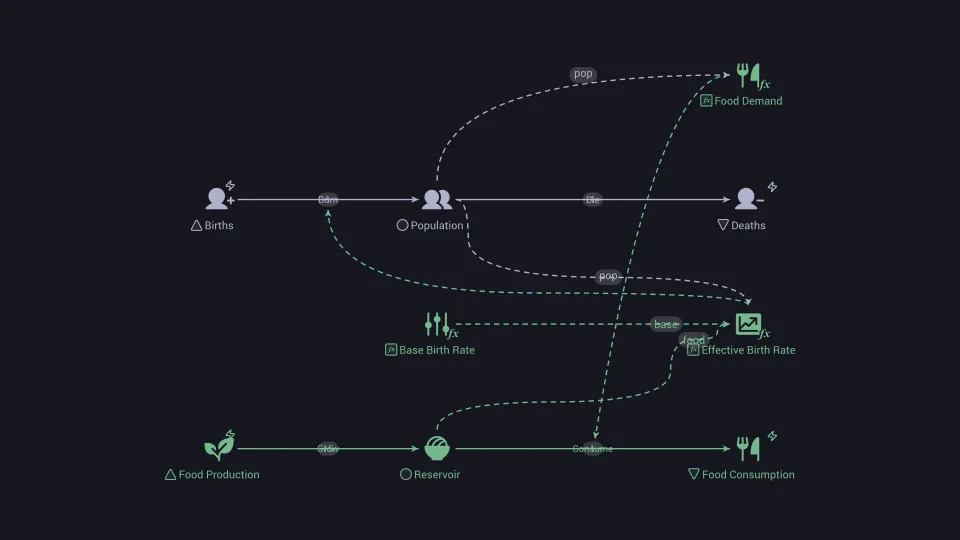
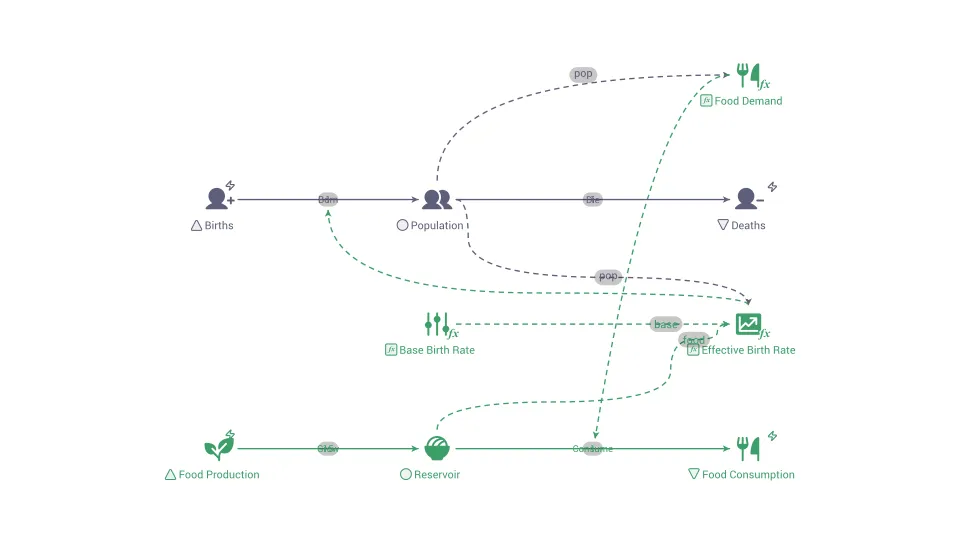
System dynamics
A method for studying how a system changes over time by modeling its stocks, flows, feedback loops and delays with equations.
Tail risk
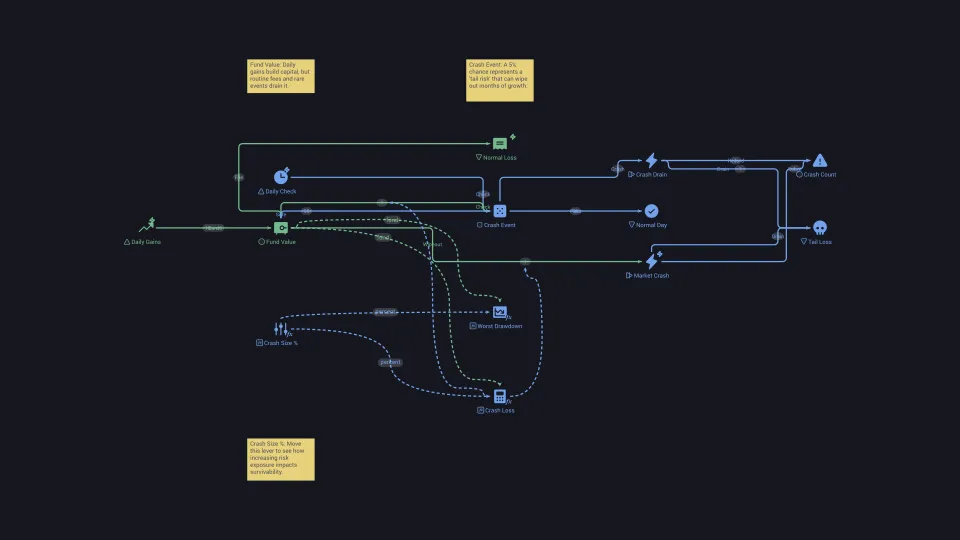
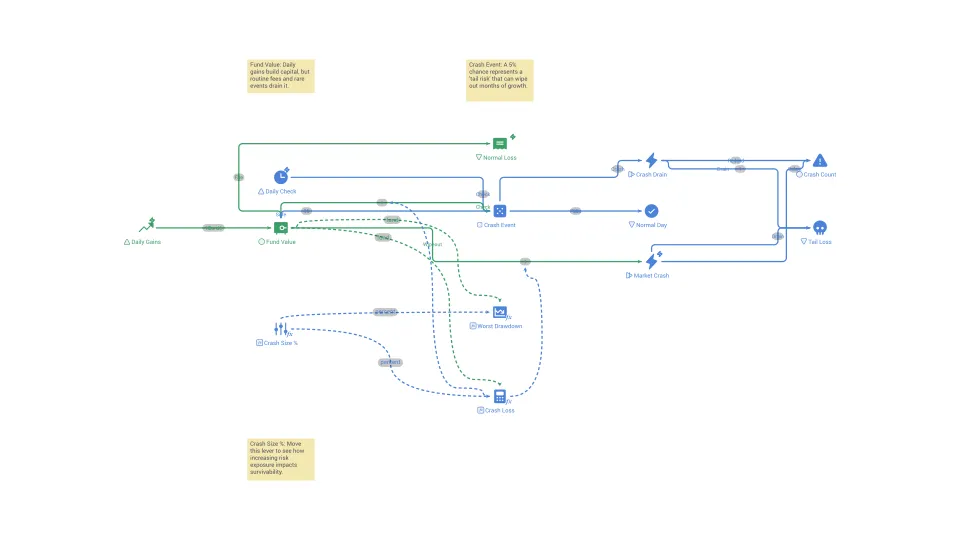
The chance of a rare, extreme outcome far from the average, whose consequences can outweigh many ordinary results combined.
Tax / commission fee
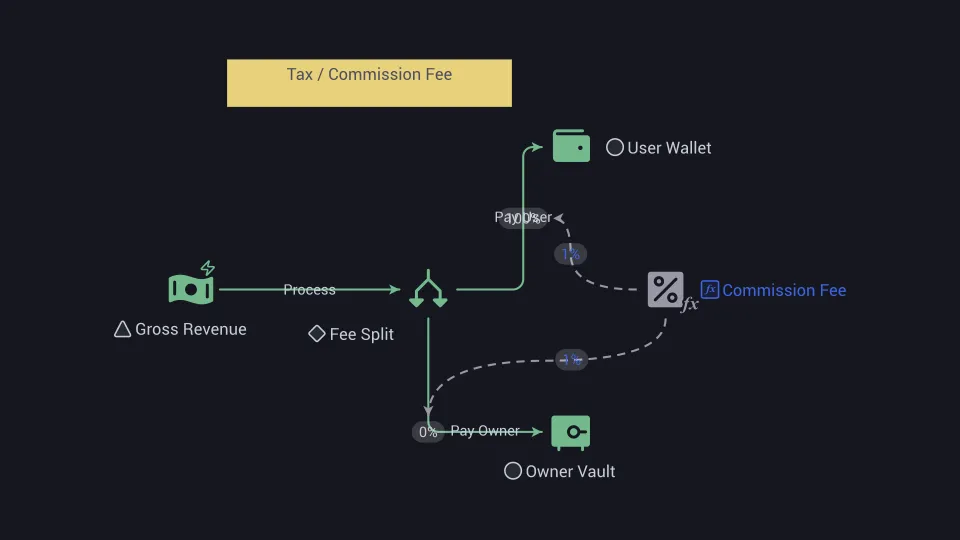
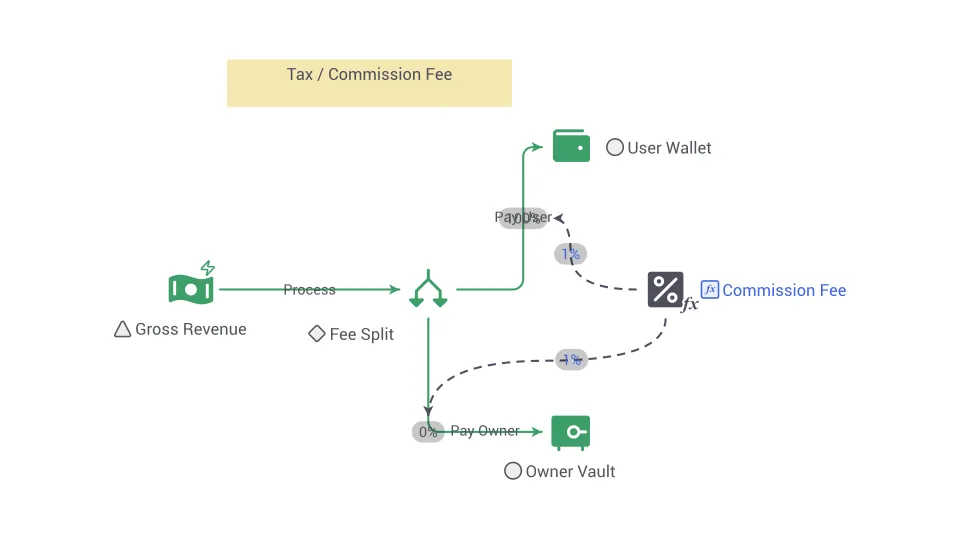
A percentage of a transaction or an earning that is sent to a third party such as a government, platform or asset owner.
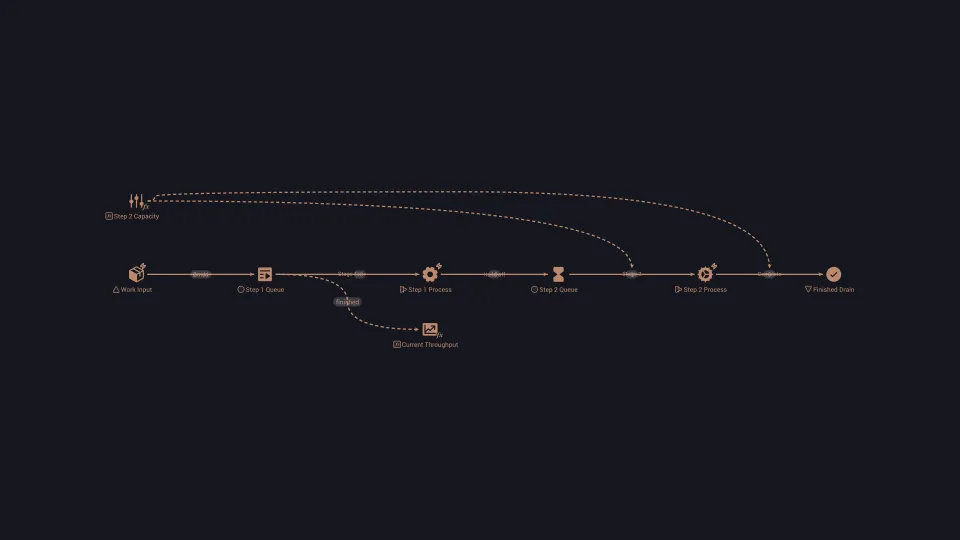
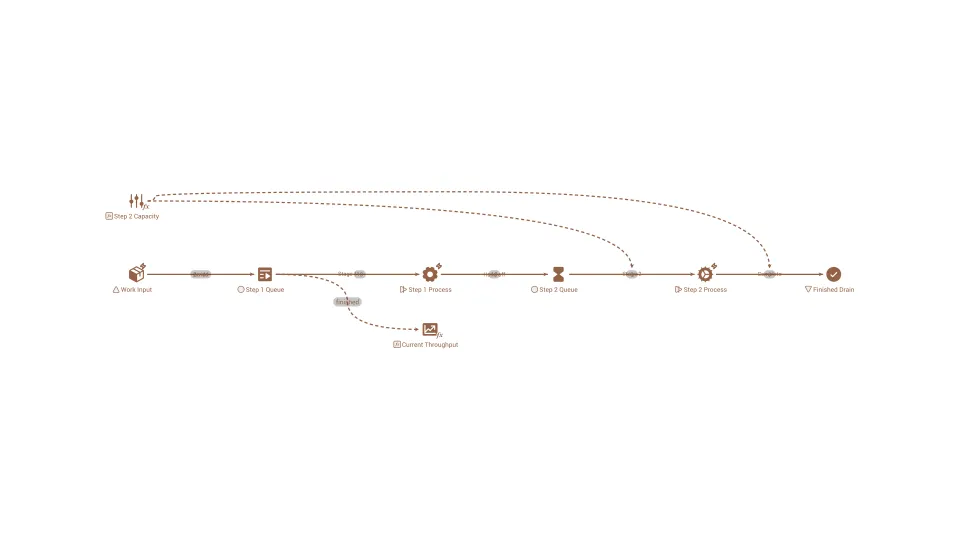
Throughput
The amount of work, goods or customers a process actually completes in a given period, such as per hour.
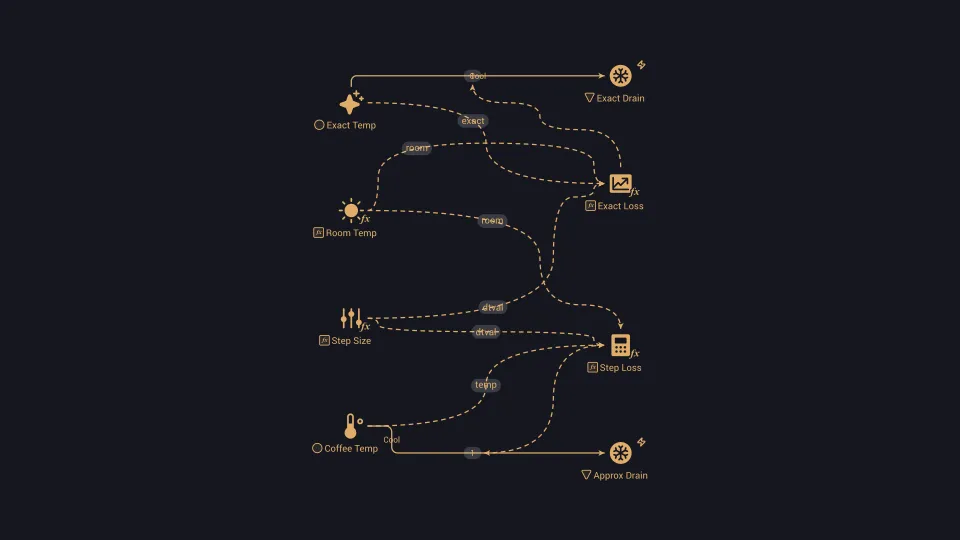
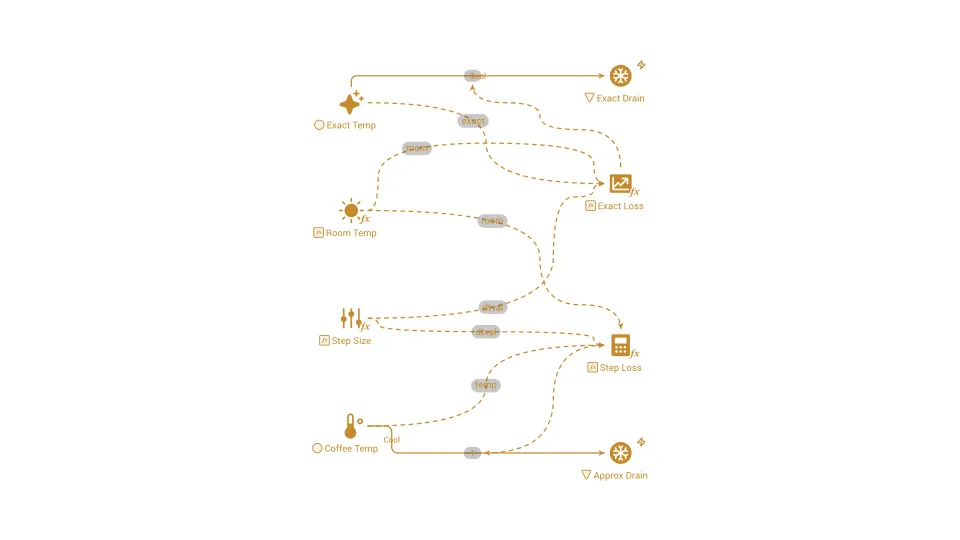
Time step (DT)
The length of the small interval of time by which a simulation advances each time it recalculates the state of the system.
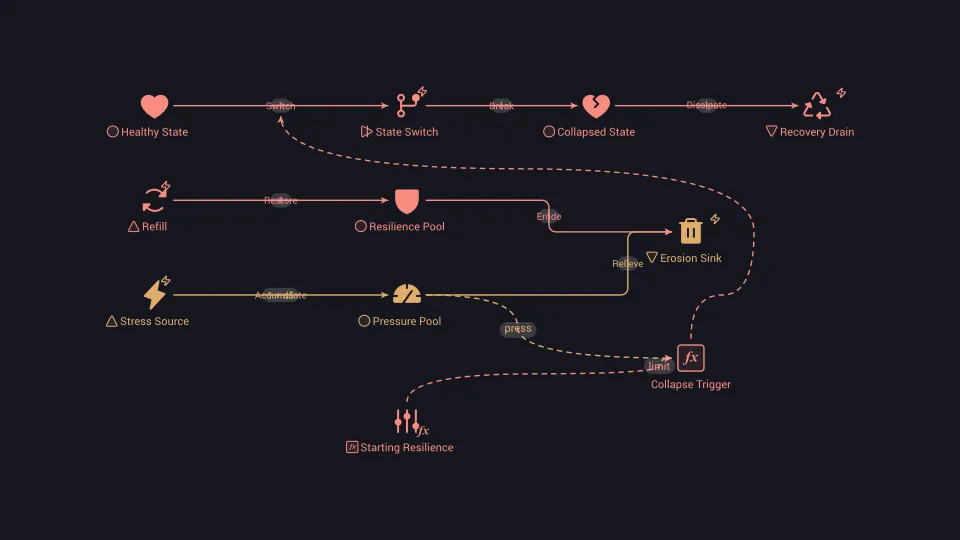
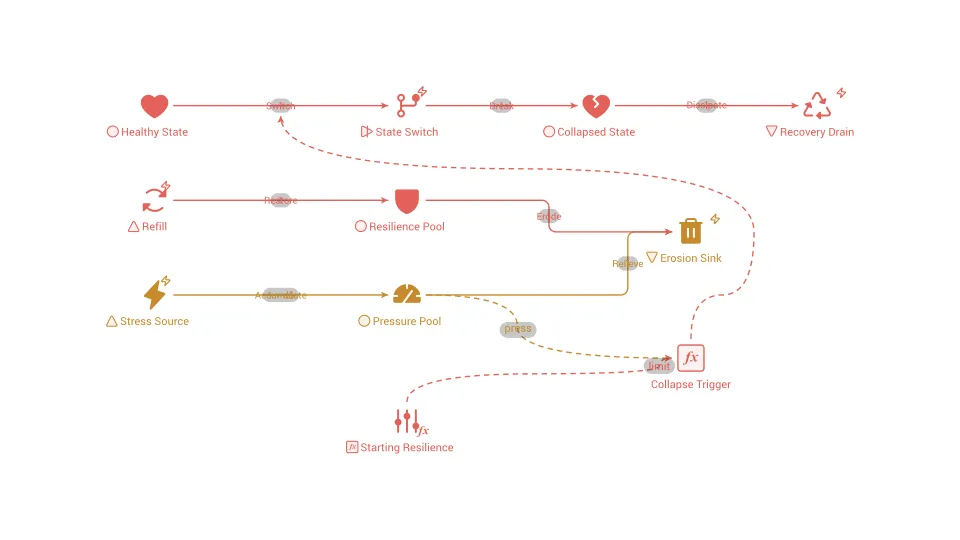
Tipping point
The threshold at which a small additional change pushes a system into a new state that is hard to reverse.
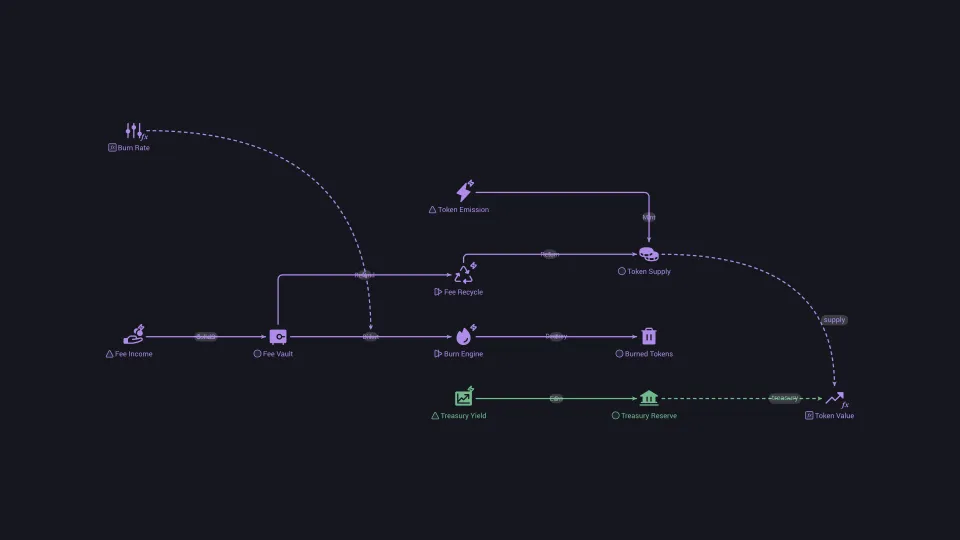
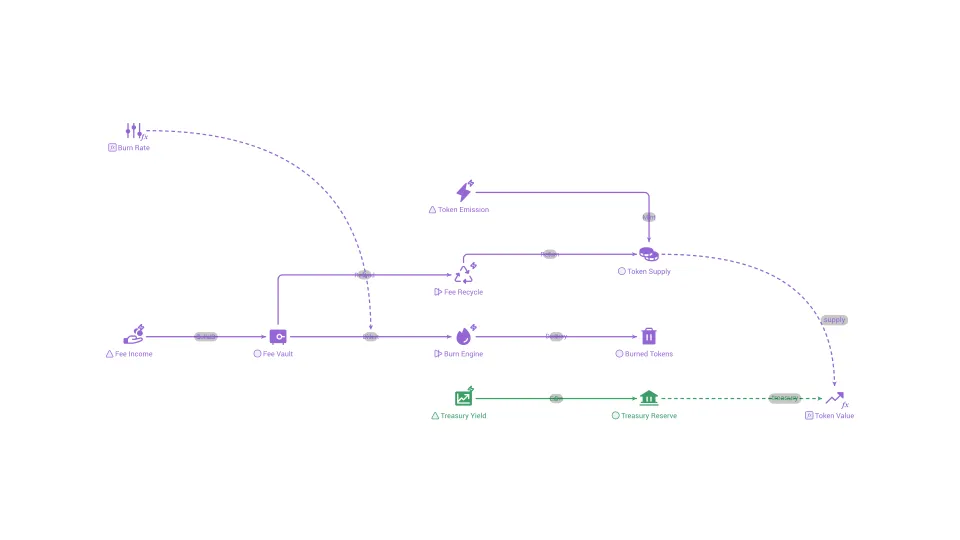
Token burn
The permanent destruction of tokens by sending them to an address that no one can use, reducing total supply.
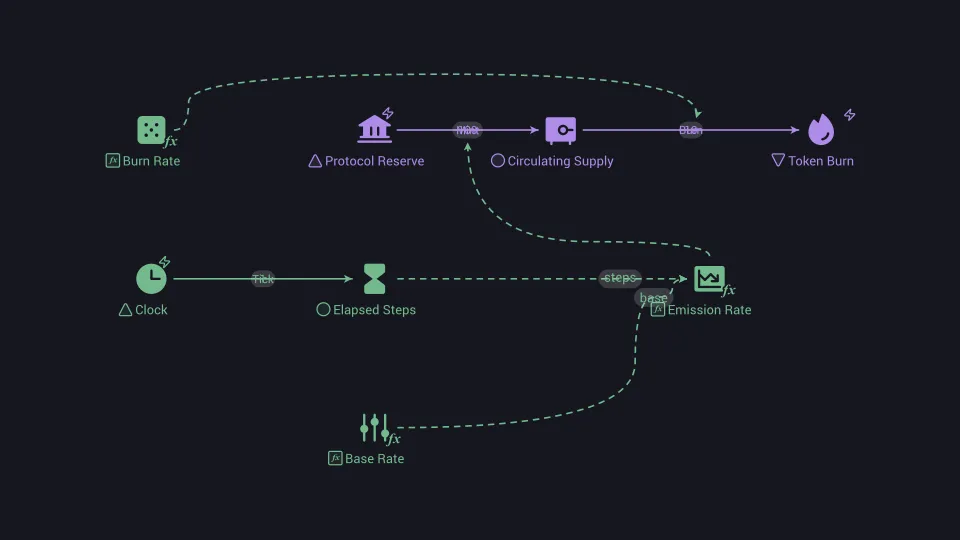
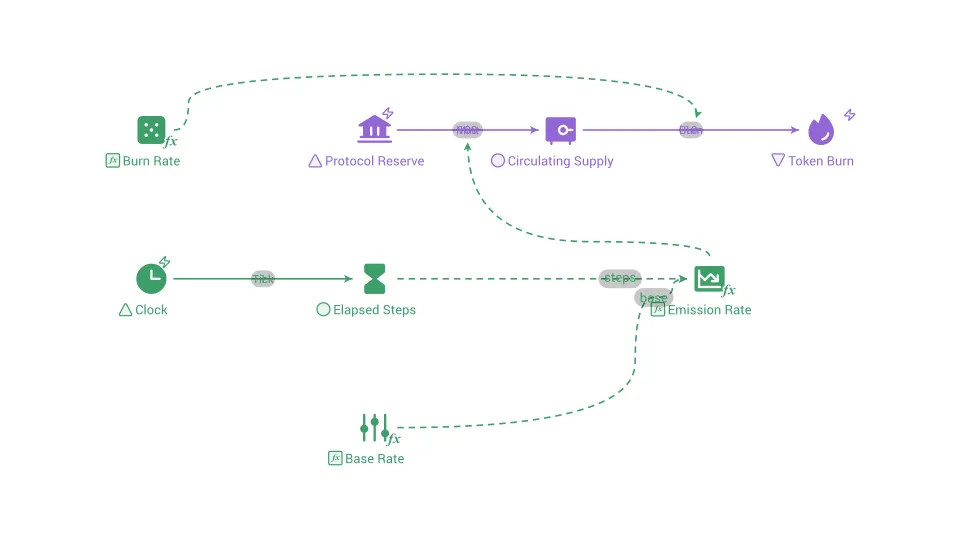
Token emission schedule
The planned timetable that sets how many new tokens are created and released into circulation, and when.
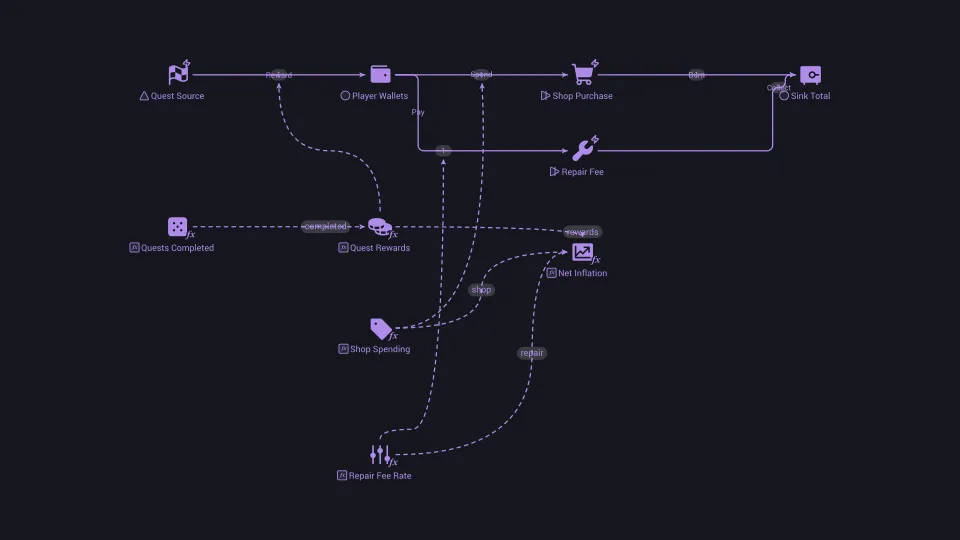
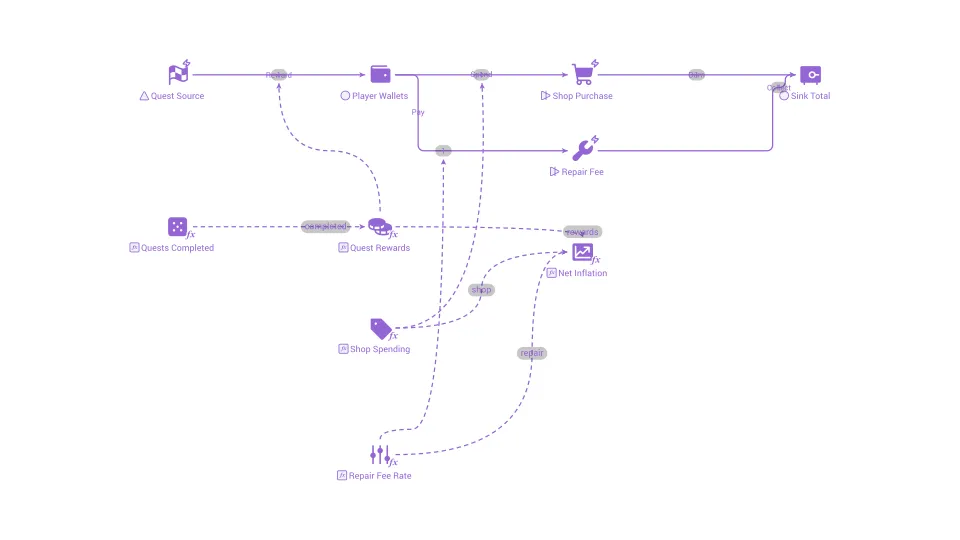
Token sink
Any mechanism that takes tokens out of circulation or out of users' hands, such as fees, purchases, burns or locks.
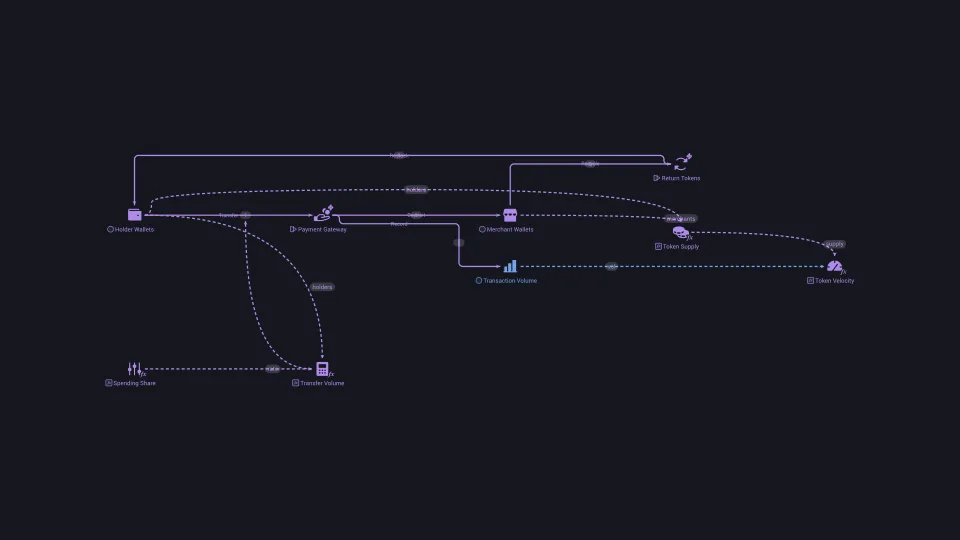
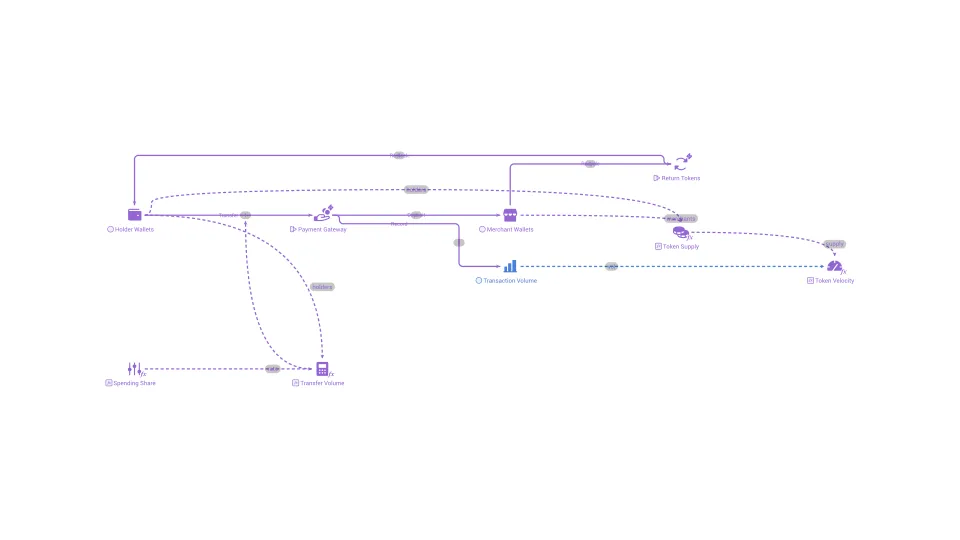
Token velocity
How many times the average token changes hands in a period, which affects how much value each token can hold.
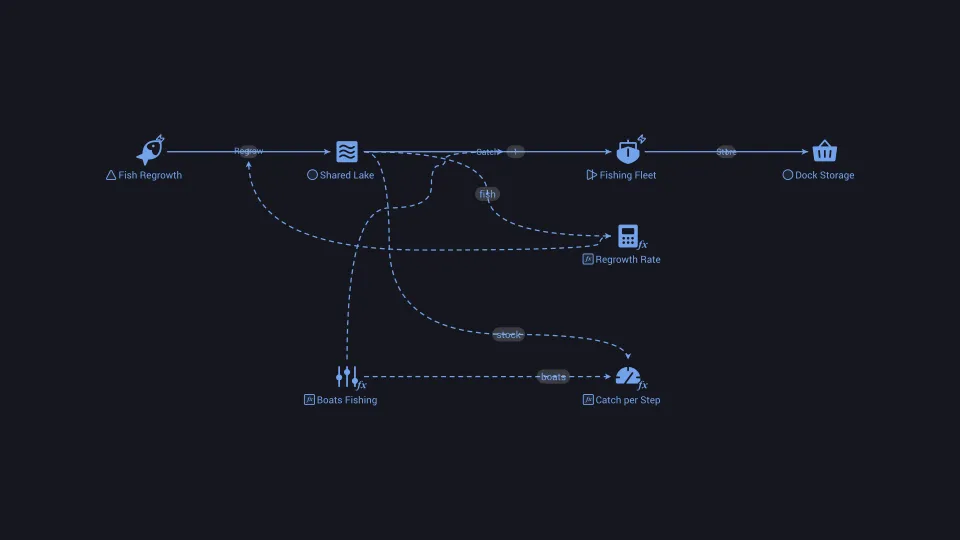
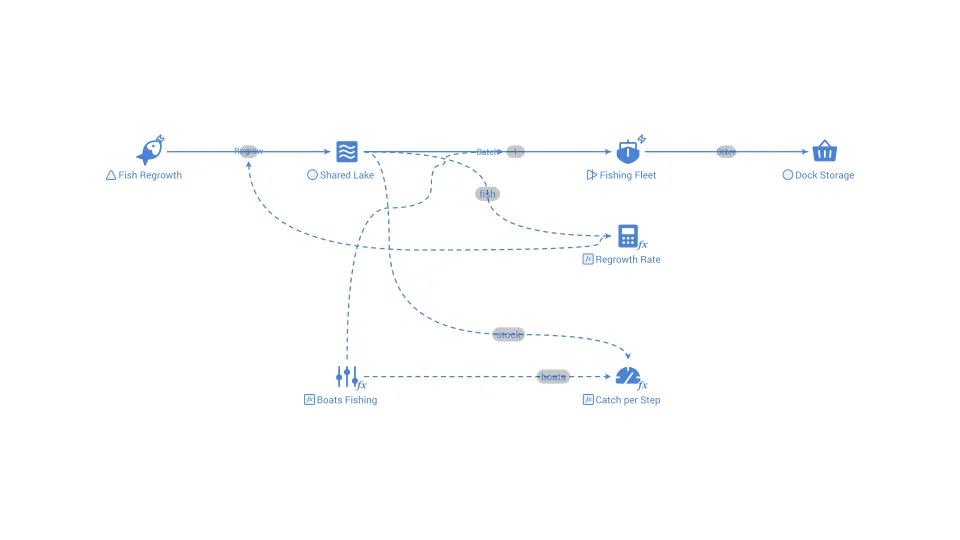
Tragedy of the commons
A situation in which individuals, each acting in their own interest, overuse a shared resource until it is depleted for everyone.
Treasury management
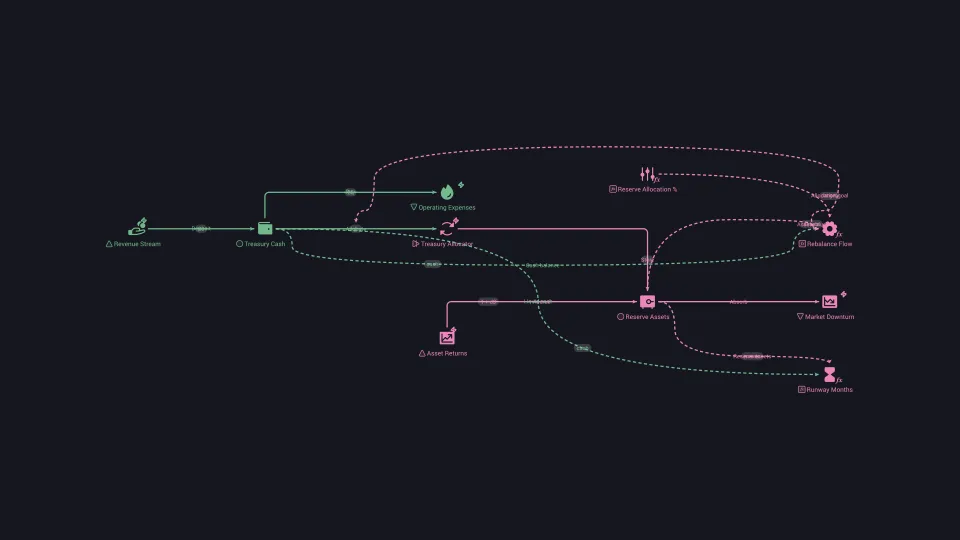
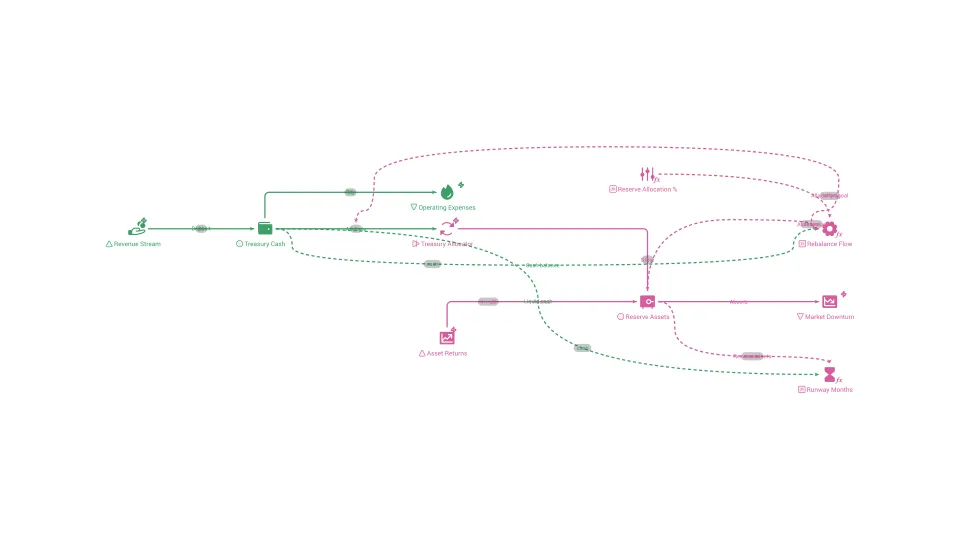
Deciding how a project or company holds, spends, diversifies and protects its reserve of assets to cover costs over time.
Triage
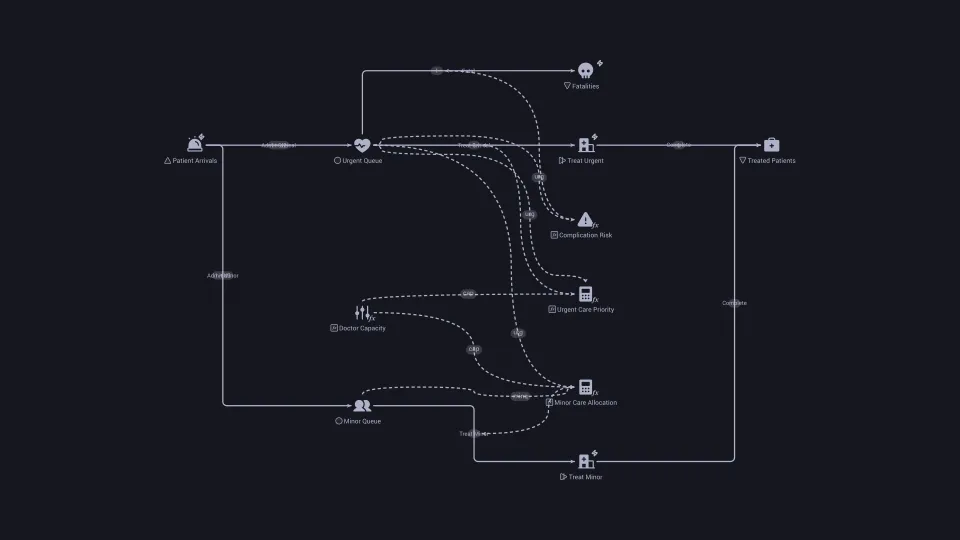
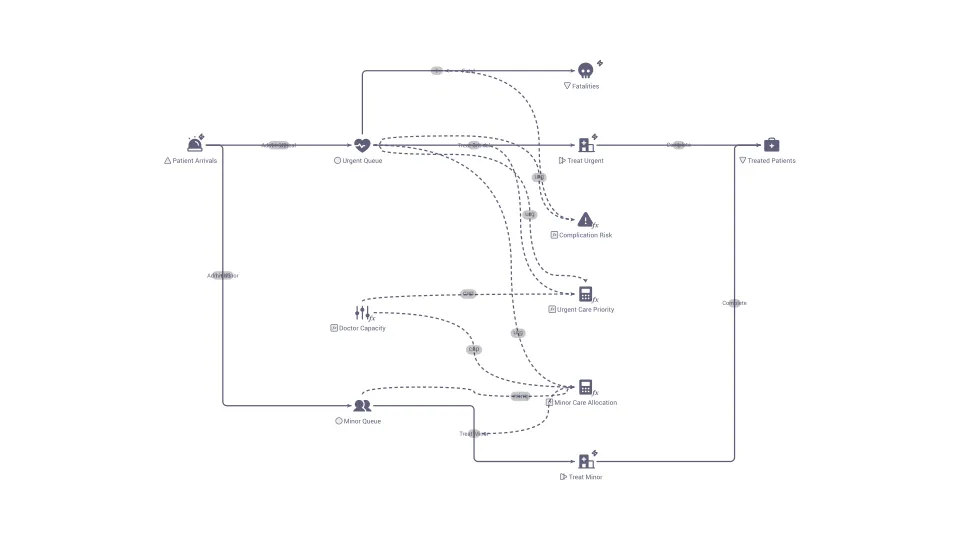
The sorting of patients by urgency so that those in most need are treated first when resources are limited.
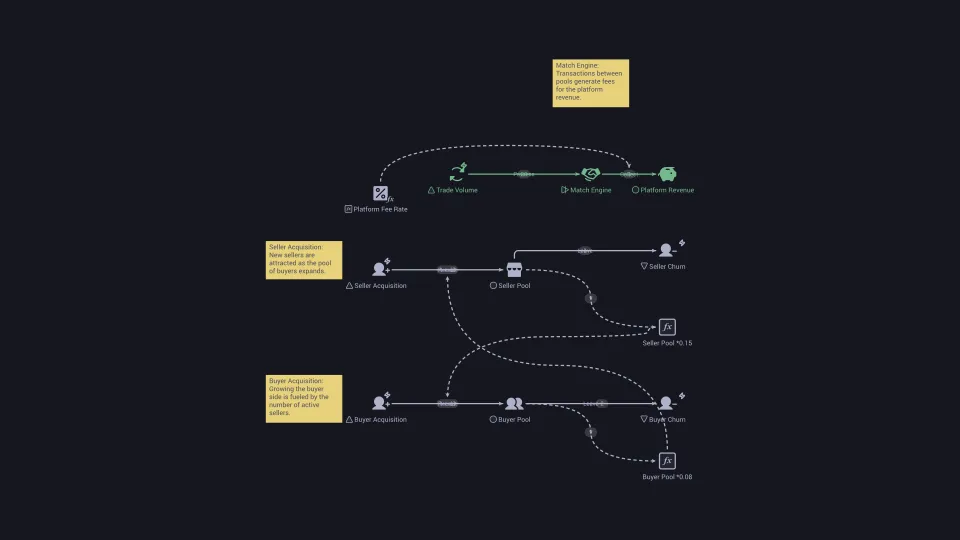
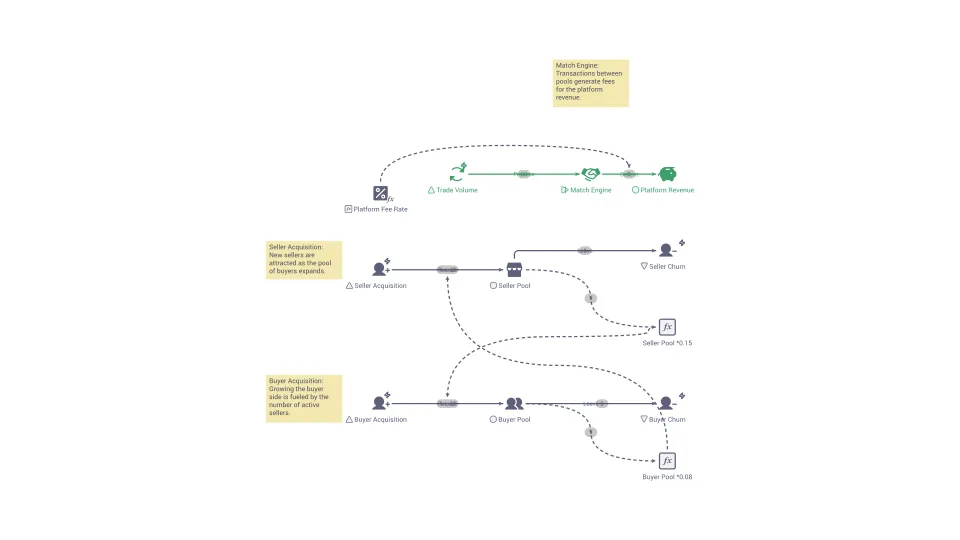
Two-sided market
A market where a platform serves two groups that each need the other, such as buyers and sellers.
Uncertainty
A situation in which the possible outcomes or their probabilities are not fully known, so the future cannot be predicted with confidence.
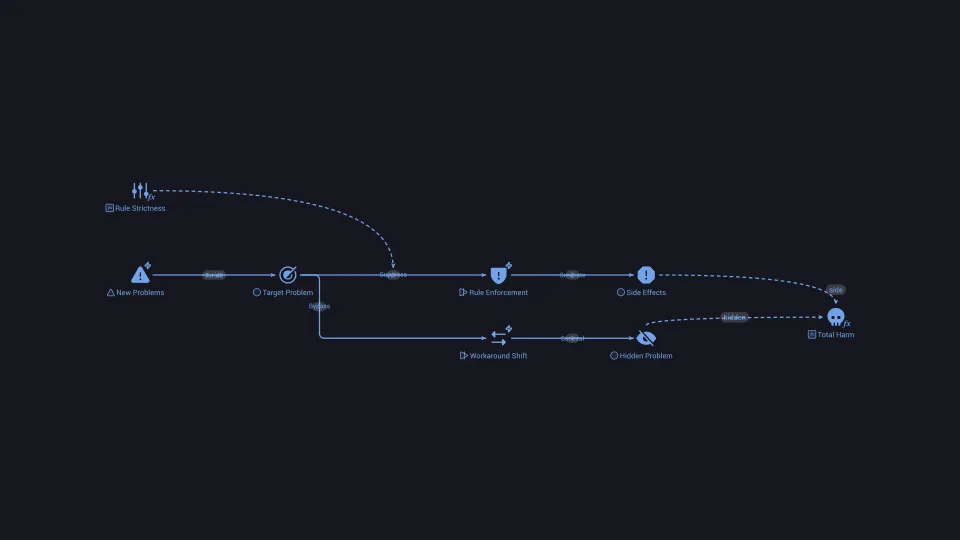
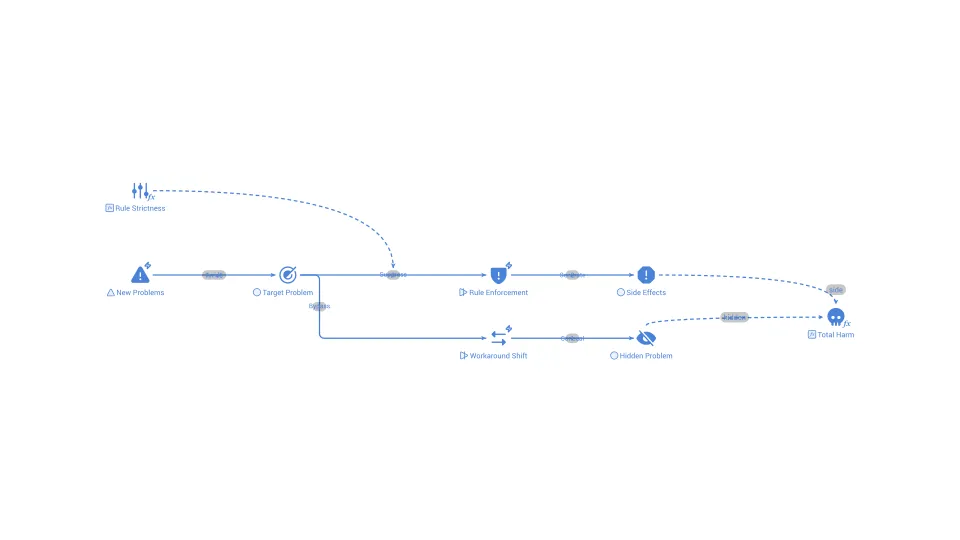
Unintended consequences
Results of an action that were not intended or foreseen, caused by the way the parts of a system interact and respond.
Utility
A measure of the satisfaction or benefit a person gets from a choice, used to compare options that cannot be priced directly.
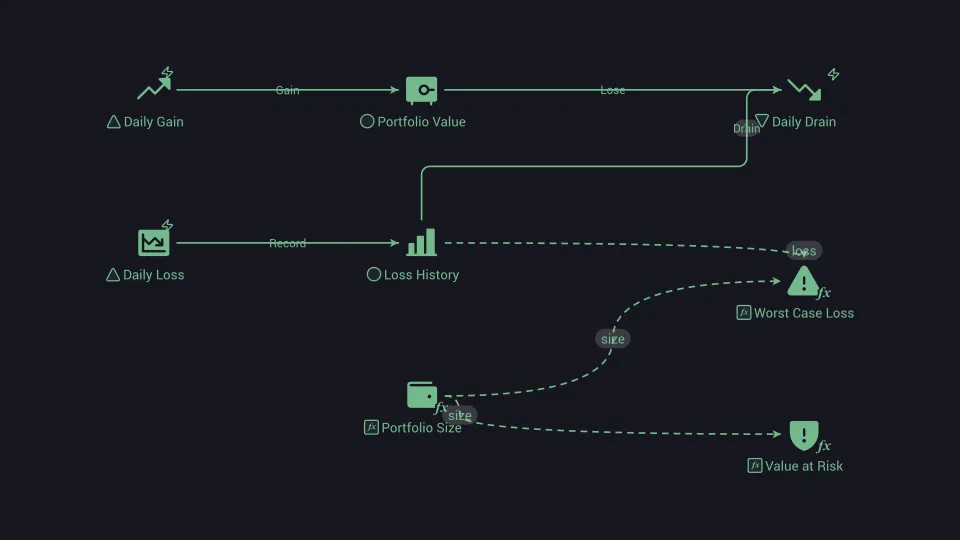
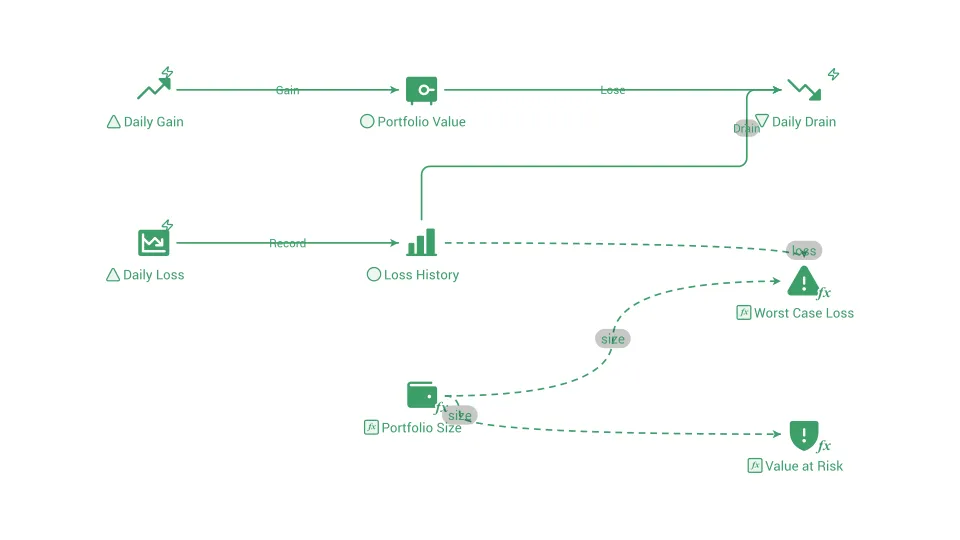
Value at risk
The loss that a portfolio is not expected to exceed over a set period with a given confidence, such as 95% over one day.
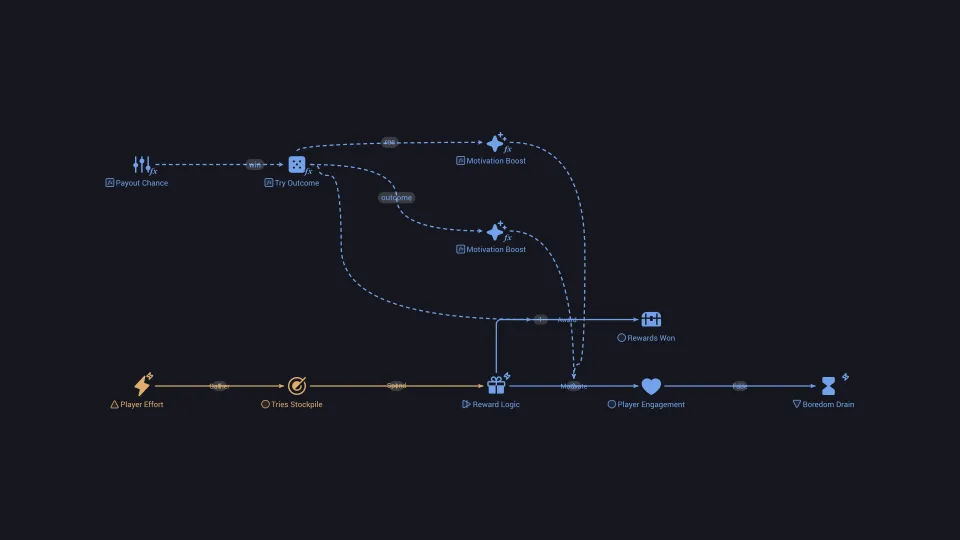
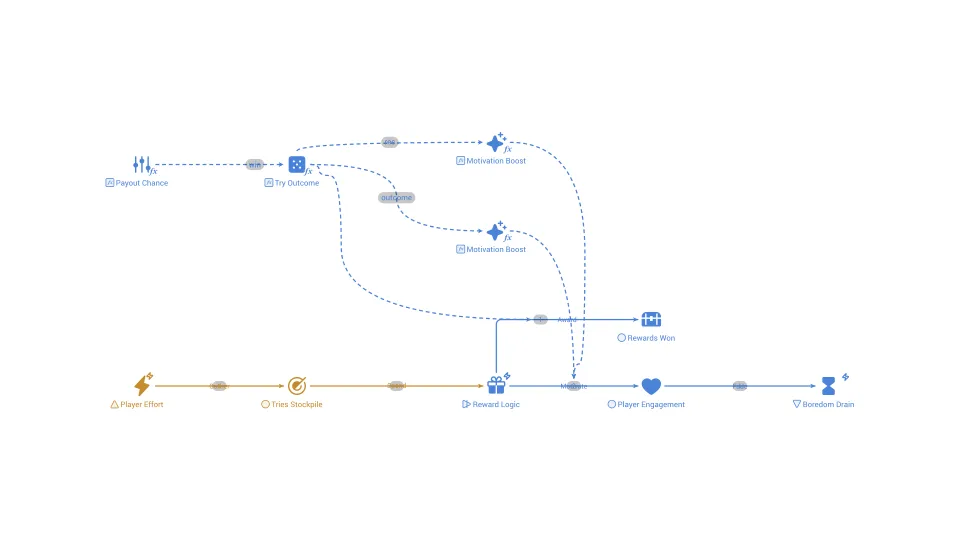
Variable reward schedule
A pattern in which rewards arrive after an unpredictable number of actions, which keeps people engaged longer than fixed rewards.
Variance
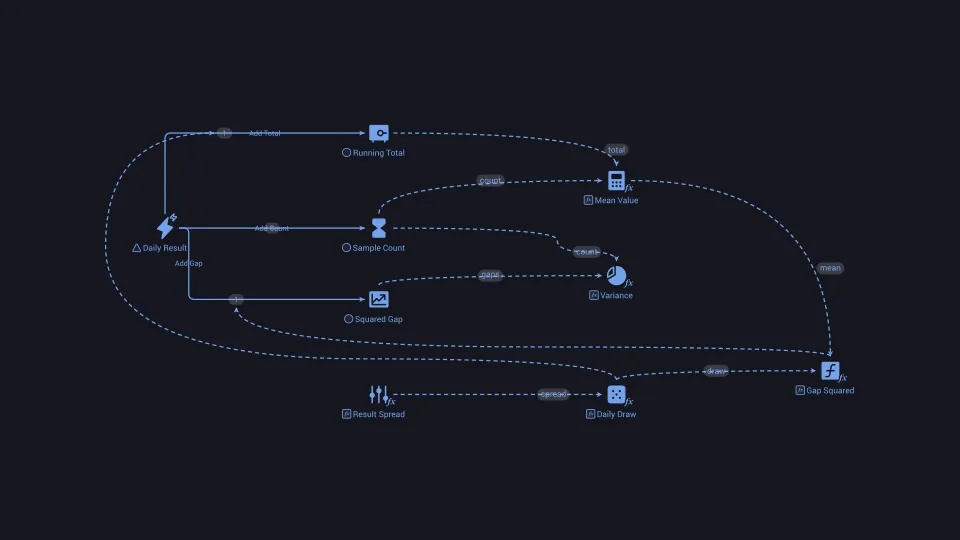
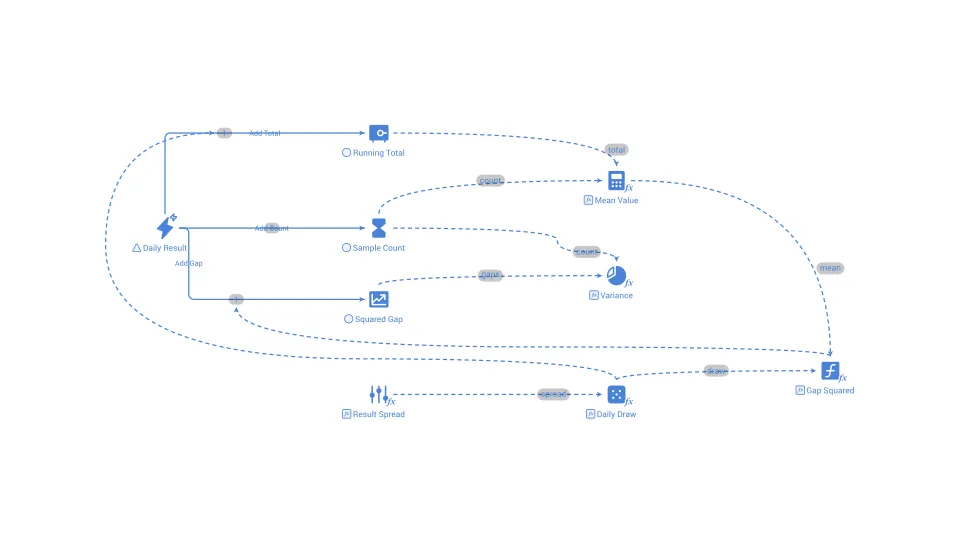
A measure of how widely outcomes are spread around their average, calculated as the average squared distance from the mean.
Velocity of money
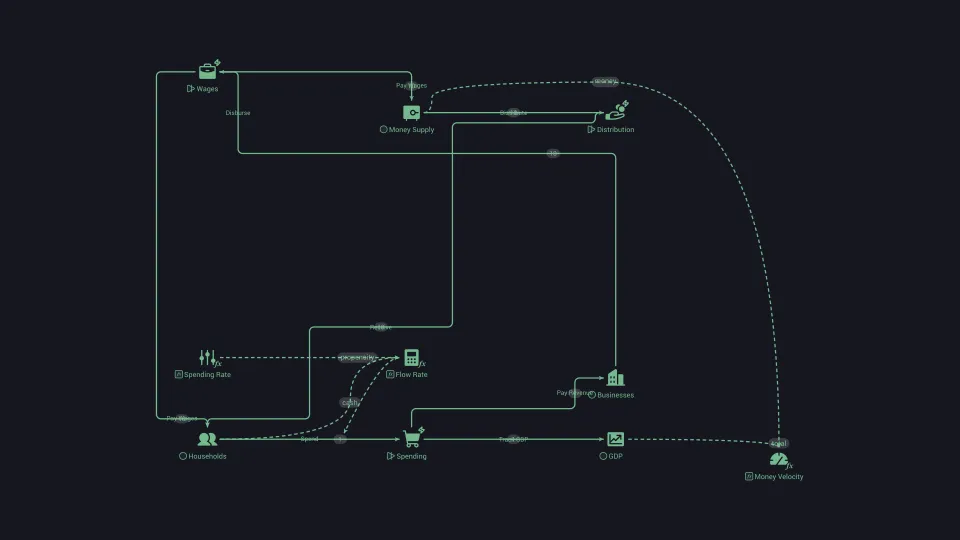
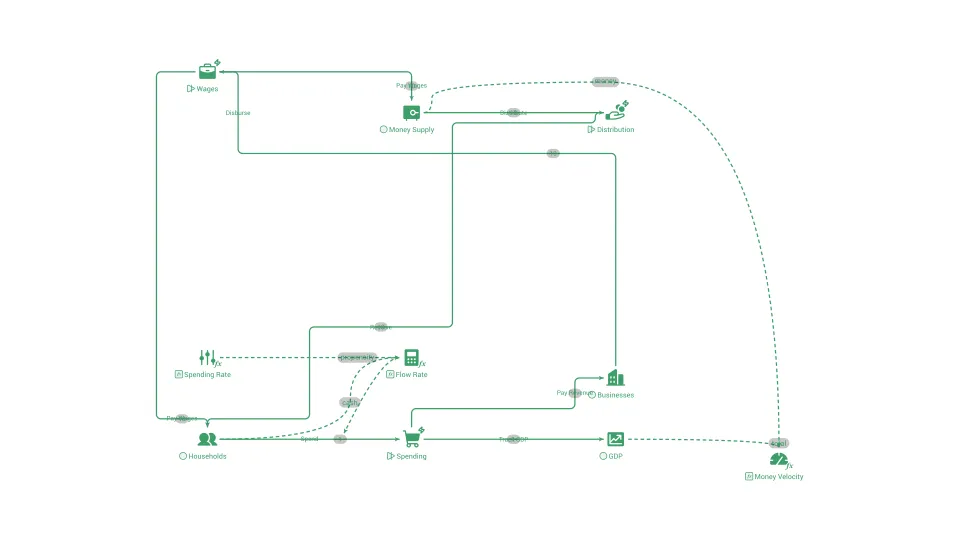
How many times, on average, a single unit of money is spent and received again within a given period of time.
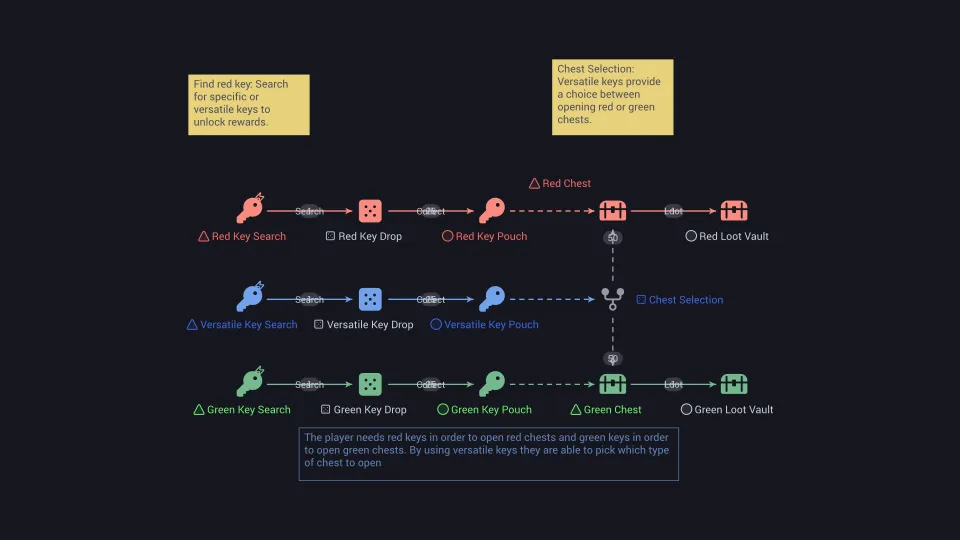
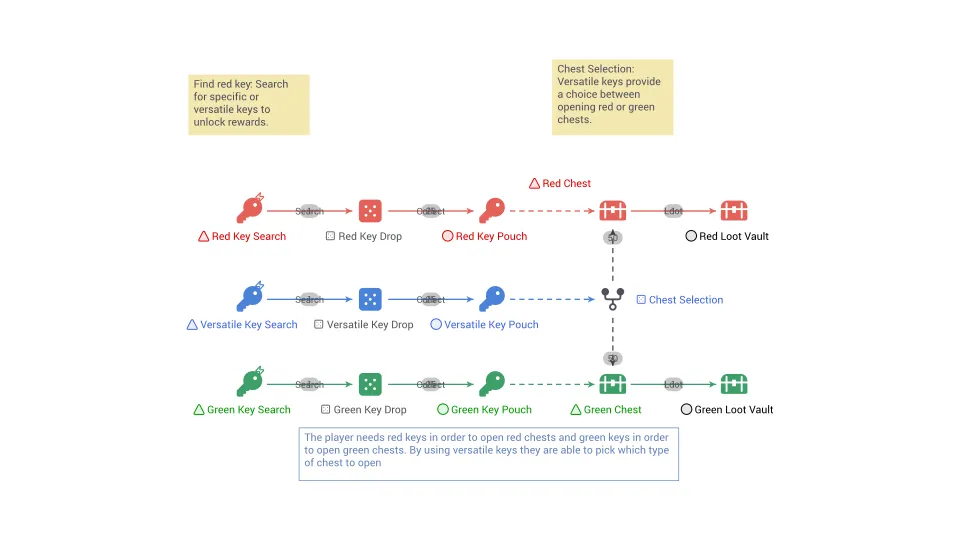
Versatile key
A Versatile Key is a gameplay mechanic, item, or element that serves multiple functions or purposes within a game.
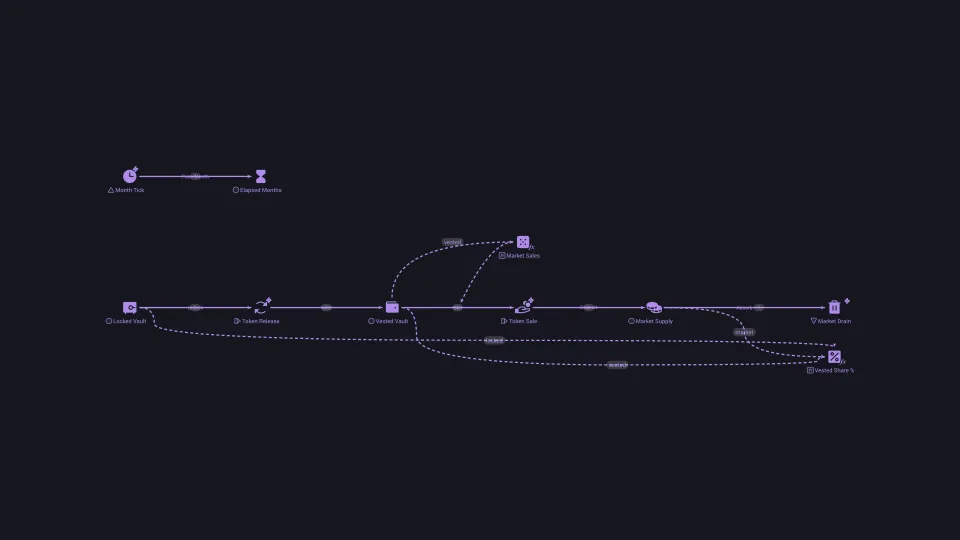
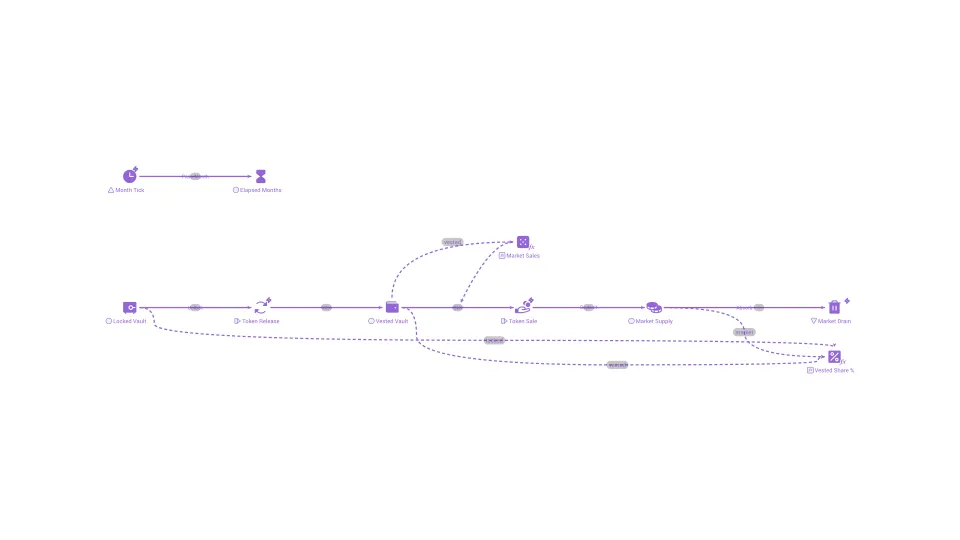
Vesting schedule
A timetable that releases earned tokens or shares to their owner gradually, often after an initial waiting period called a cliff.
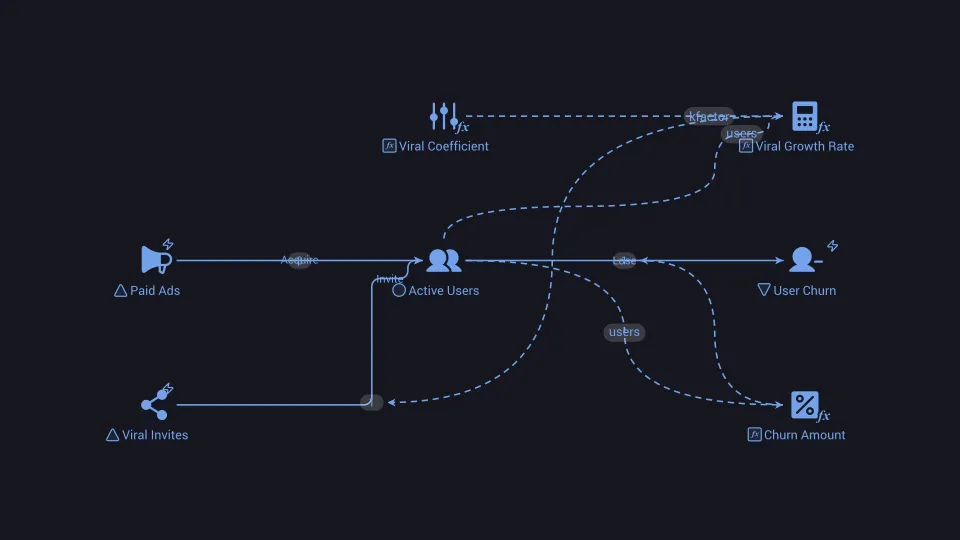
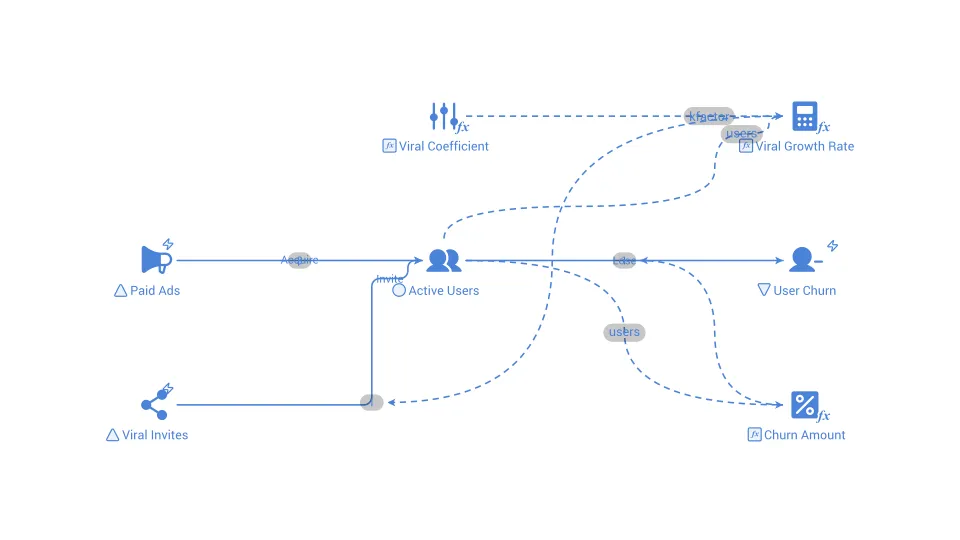
Viral coefficient
The average number of new users each existing user brings in, which decides whether word-of-mouth growth compounds or fades.
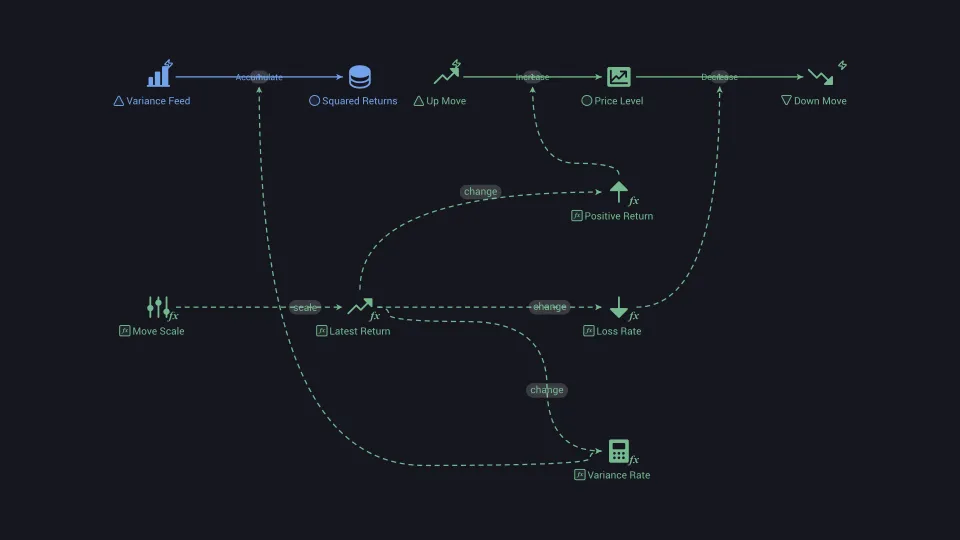
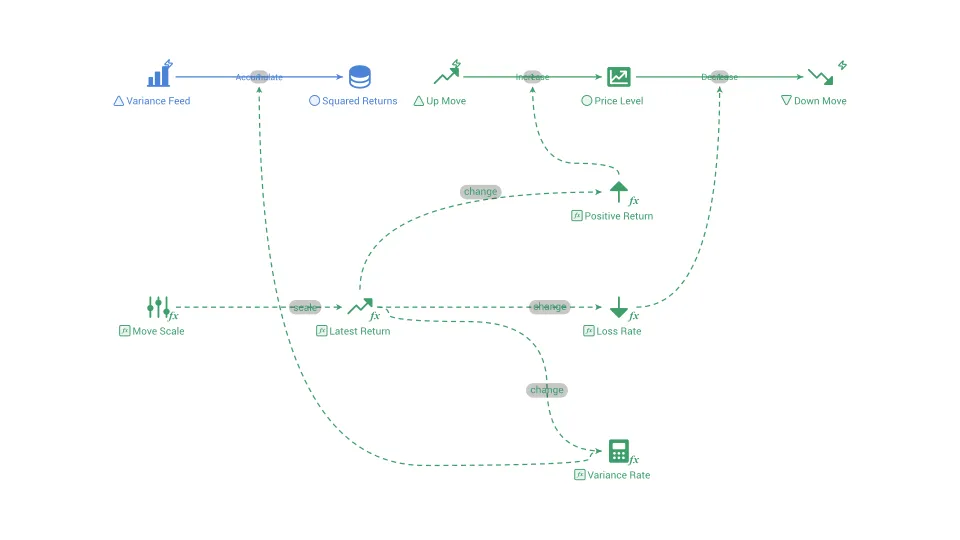
Volatility
A measure of how widely a price or value swings around its average over time, usually the standard deviation of returns.
Waiting list
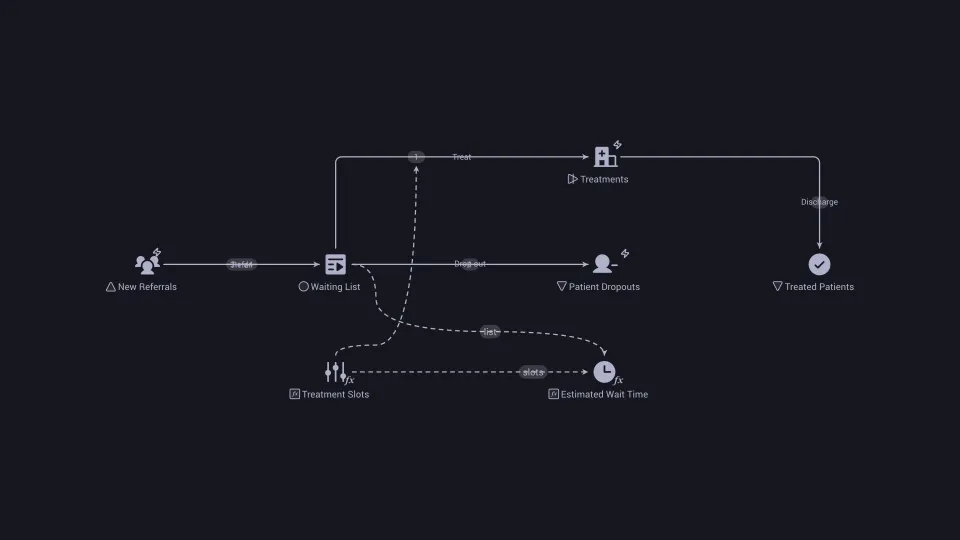
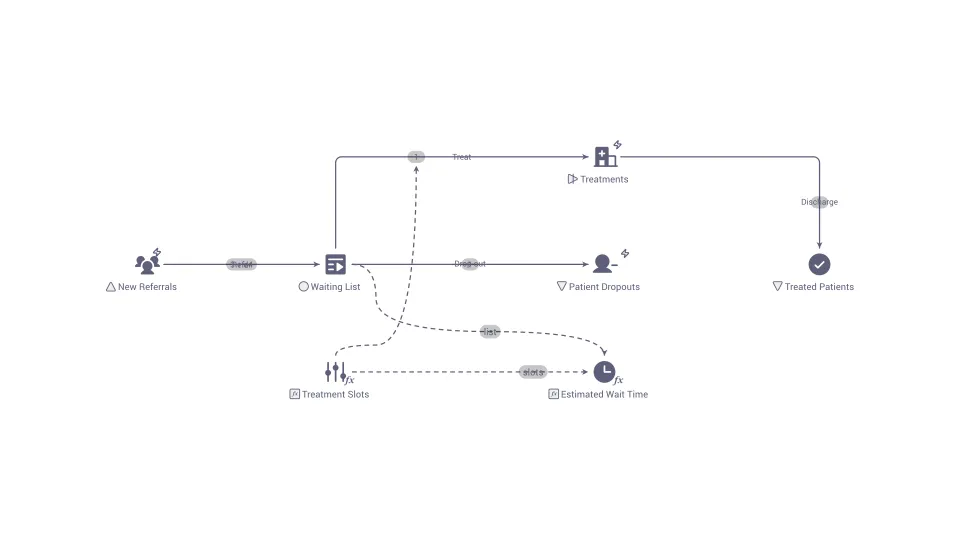
The queue of people who have been accepted for a service but cannot yet receive it, such as a planned hospital treatment.
What-if analysis
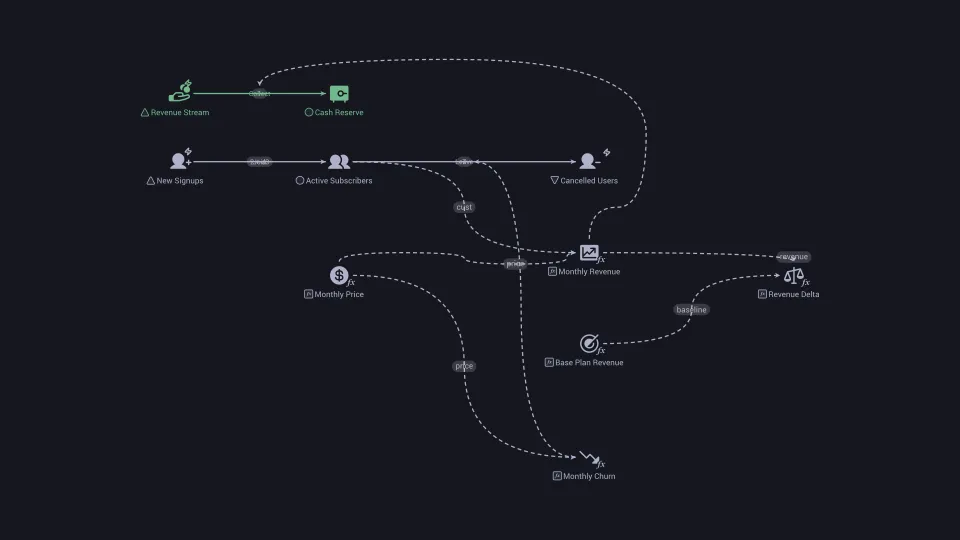
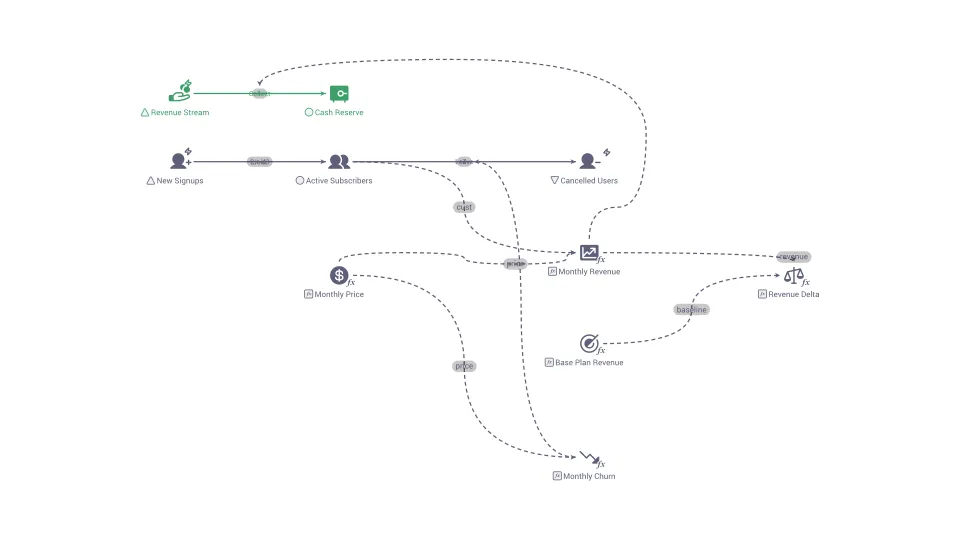
Changing one or more inputs of a model to see how the results change, in order to compare options before committing to them.
Work in progress
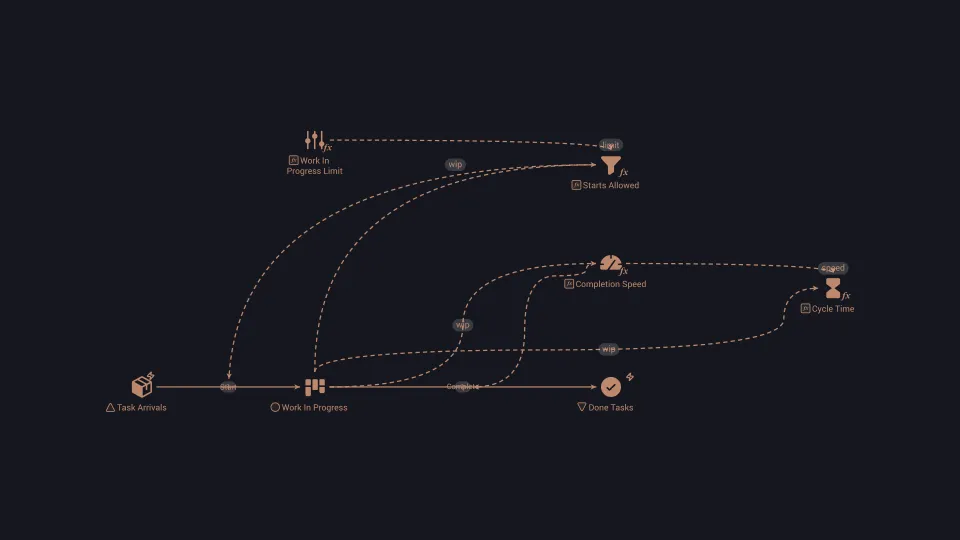
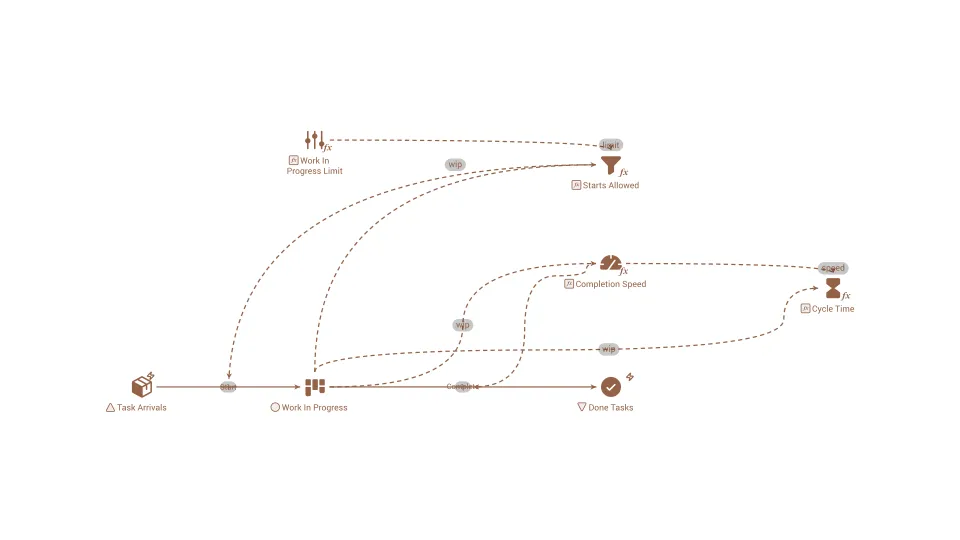
The work that has started but is not yet finished, such as items on the shop floor or tasks in the middle of being done.
Zero-Sum game
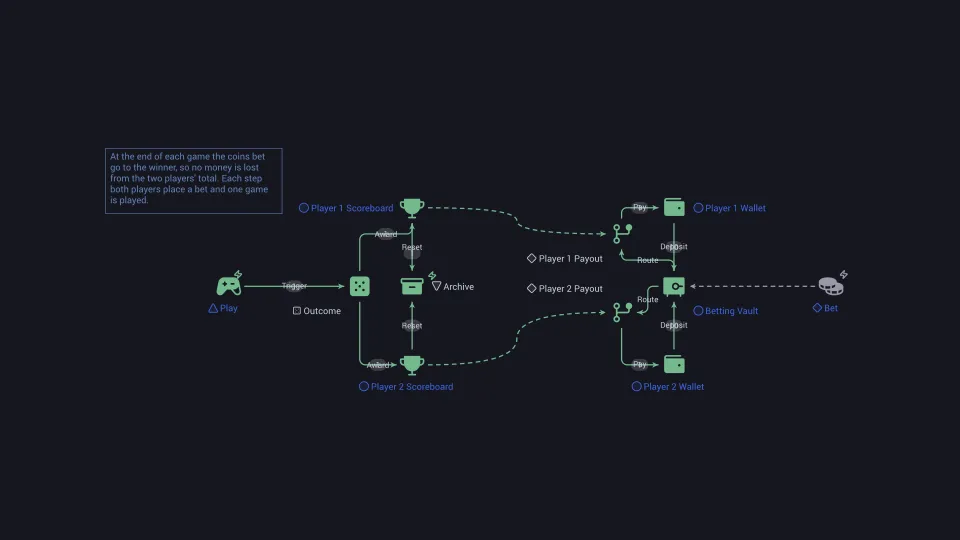
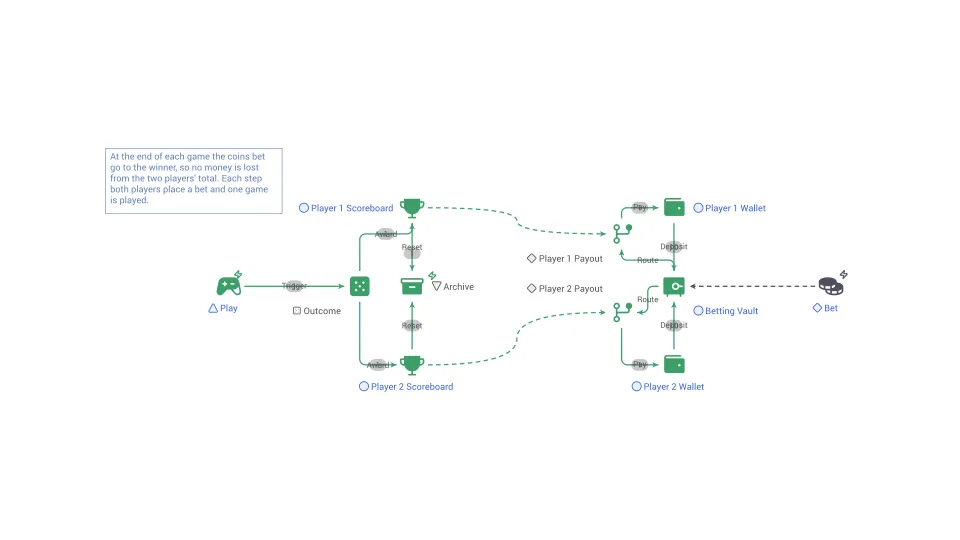
A situation in which one party's gain is exactly matched by another's loss, so the total stays fixed.
See the term at work in a real system
Build the idea into a diagram, Play it and watch how the system responds when you change it.