Play Modes
Machinations diagrams are dynamic. The models you design can be played in three ways: Play, Step and Forecast.
This is the play bar at the bottom of the editor. Press Play to watch the diagram unfold; the number and unit next to it set how many steps a Play lasts, the step button advances one step, the speed control sets how fast it plays, and the circular arrow resets. Forecast plays the diagram many times; the number beside it is how many.


Steps and Speed
The play bar has three small menus that set how long a Play lasts and how fast it plays.
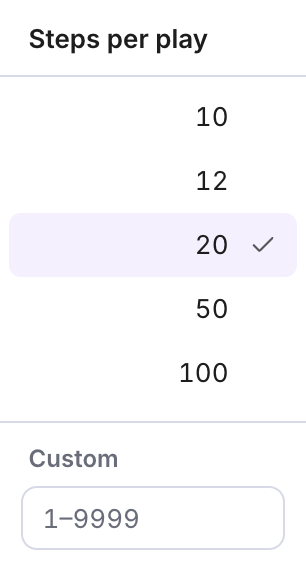
Steps: the number next to Play is how many steps one Play lasts. Choose 10, 12, 20, 50 or 100, or type your own number from 1 to 9999 in the Custom box. All Nodes on a diagram change their state synchronously during one Step.
1 Step = 1 player action OR
1 Step = 1 core loop OR
1 Step = 1 game played
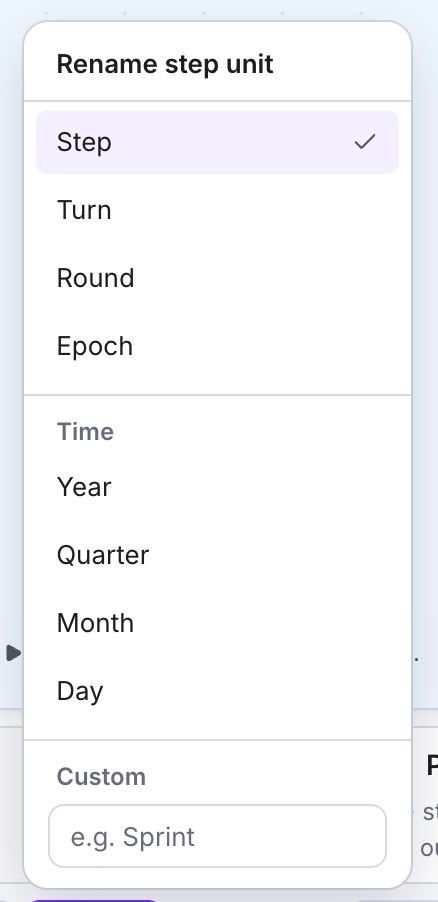
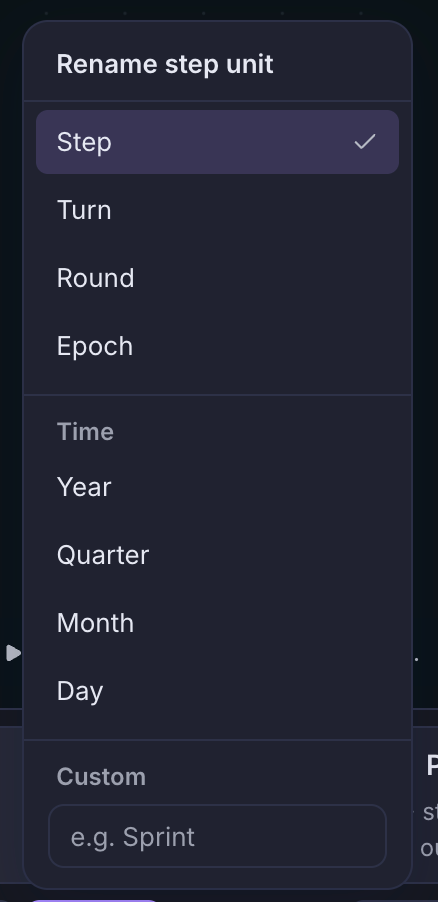
The word after the number (here steps) is the name of the unit, and you can rename it: Step, Turn, Round or Epoch, or a time unit such as Year, Quarter, Month or Day, or your own name in the Custom box.
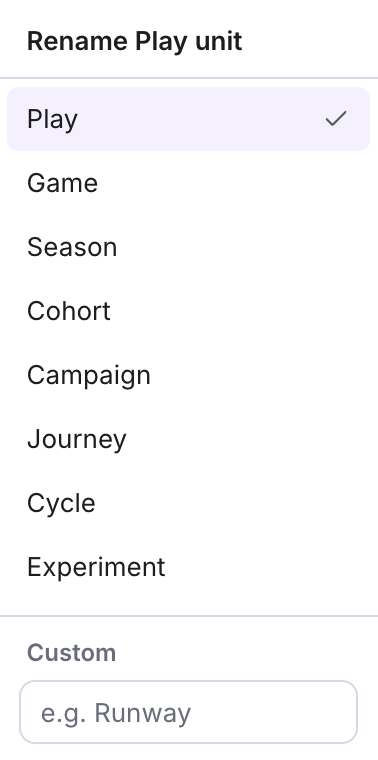
The small arrow on the Play button renames the Play itself: Play, Game, Season, Cohort, Campaign, Journey, Cycle or Experiment, or your own name.
Speed: the speed button sets how fast the diagram plays: 0.25×, 0.5×, 1× (the default), 2× or 4×. The speed is your own: the number of steps is shared with everyone who opens the diagram, but the speed you choose changes only your own view.
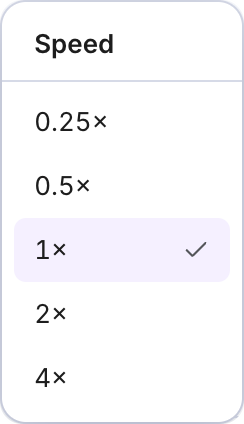
Available Play Modes
Step
The step button 
 , next to the number of steps, advances the diagram one step at a time. This is an easy way to debug your diagram as you build it and identify where it breaks.
Interactive Play
Press Play 
 to watch the diagram play step by step as it is drawn, for the number of steps you chose. Press it again to pause; the button then says Resume. The bar shows how far the Play has got, for example 7/20 steps, and the circular arrow resets it. This is the only mode that supports On click Nodes and real-time changes on the diagram while it plays. While the AI Agent is writing the model, Play, Step and Forecast wait until it has finished.
Forecast
Forecast plays the diagram many times in a row, and the number beside the button (5× in the picture) is how many plays. On click Nodes never fire in a Forecast.
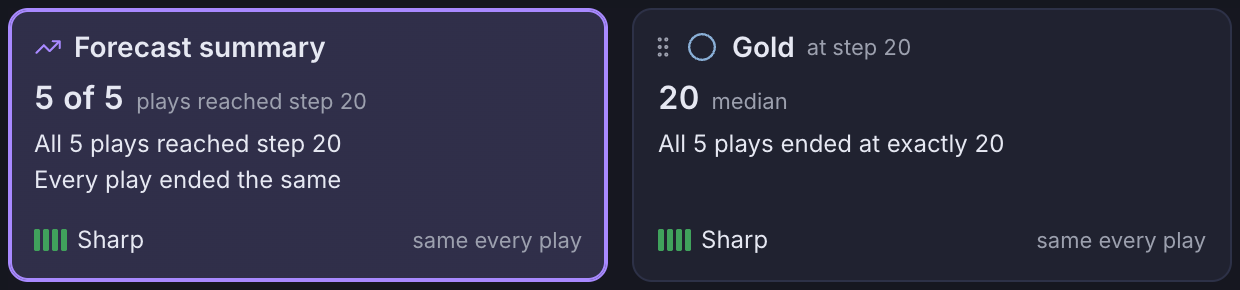
When a Forecast finishes, the app shows a notice that says Forecast finished. The cards under the canvas then summarize the plays, for example how many plays reached the last step and the median value of each node. Each card also shows its Precision (Rough, Fair, Good or Sharp: Fair is within ±20%, Good within ±10% and Sharp within ±5%) and how many more plays would raise it; the menu beside Forecast lists the ranks you can reach (for example Good), and choosing one plays just enough Plays to get there, then stops. Open a card to see the Fan chart or the Line chart and a table of statistics: max, p99, p95, median, mean, p5 and min.
Remember to save your progress before switching diagrams.
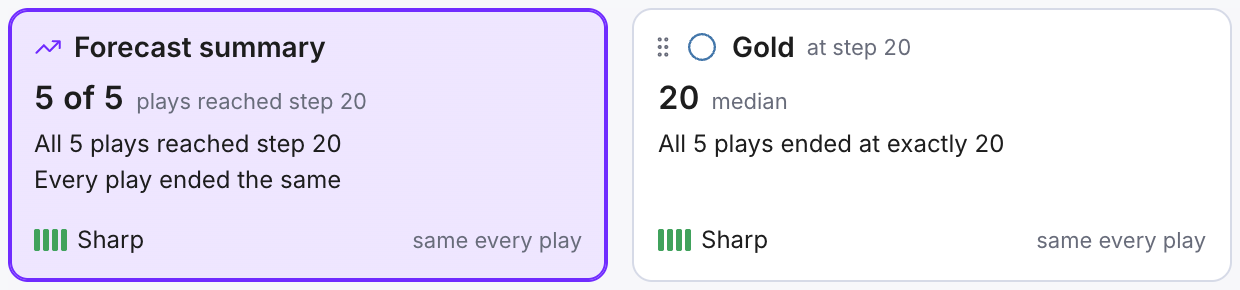
Steps and Forecasts work together.
Use the number of Steps to determine how many days/actions/games one Play lasts. Then set how many plays a Forecast makes to get statistically relevant results.
Scenarios. Mark Pools, Registers and connections as Levers (right-click a component, use the Lever switch in the Properties panel, or press Cmd+Shift+2 on a Mac, Ctrl+Shift+2 on Windows), then open the Scenarios tab in the header to move them and compare the Outcomes. Moving a Lever adds a scenario to the list and plays it once. Try other Lever values plays one Forecast for each setting of a Lever and ranks the Levers under Which Lever matters most? A Lever moved during a Play takes effect from the next Play.