Making forecasts
In this section, you will use the model you have created to plot charts, Forecast values, and get relevant metrics. For example.
One of the most essential features of Machinations is the possibility to estimate the value of specific variables with Monte Carlo Forecasts so that users can tweak anything in the game system to find the perfect economy balance. For example, we want to know the average XP or maximum level after a certain time. In this section, you will use the model you have created to plot charts, Forecast values, and get relevant metrics.
Before you start
We need to make a few changes to the diagram in our case so that we can make proper Forecasts. In stage 1 we ended the Play when the highest level was reached (we defined that it was 6). However, we need to know, for example, how much XP a player will have after a certain time, and we do not want Plays to stop at level 6 because players may get to higher levels after a while. Therefore we need to deactivate the end condition.
- Click on the State Connection between the “Level” pool and the “Max Level Reached” end condition.
- Press Delete (or right-click the connection and choose Delete) so the end condition does not activate. You can undo the deletion, or draw the connection again later, in case you need it afterward.
During stage 1 we also found out that players were getting to level 6 fairly quickly, approximately between 10 and 20 minutes. So we are going to reward them with less XP per enemy killed.
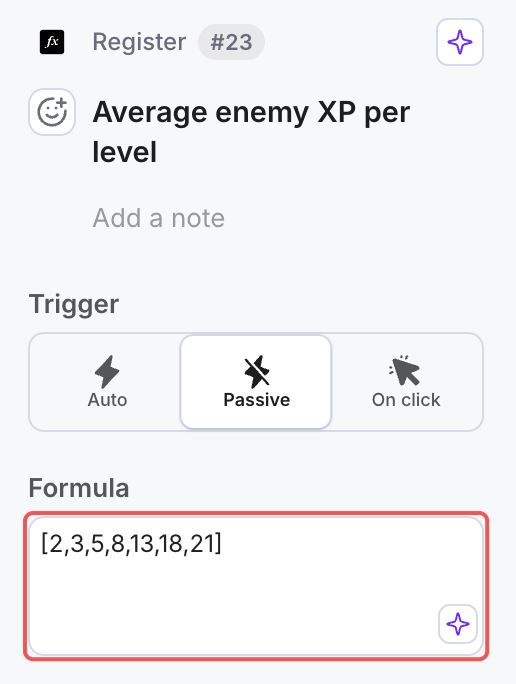
- Select the “Average enemy XP per level” register
- In the “Formula” field enter the array [2,3,5,8,13,18,21].
Reading XP for one player
Let’s assume we want to know how much XP one player will have after 200 minutes. First of all we need to detect what value we want to keep track of and where it is being calculated. In our example, we need to evaluate the “XP” pool and we are going to plot a chart showing the XP for one player.
- To add the “XP” value to the chart you can choose one of the following options:
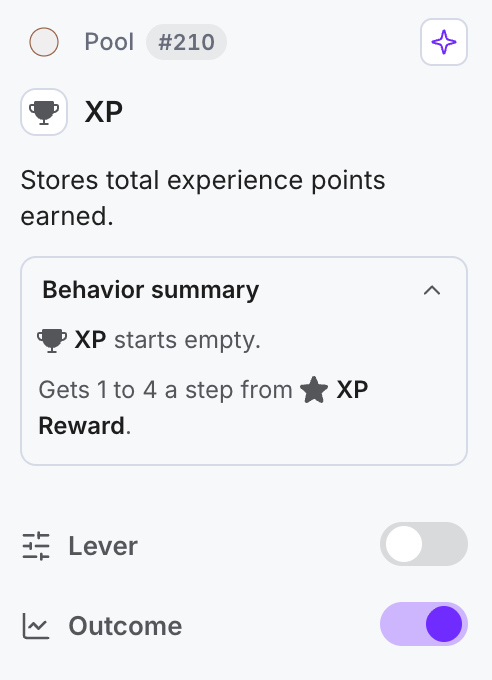
- Select the “XP” pool and make sure the Outcome switch in the Properties panel is on.
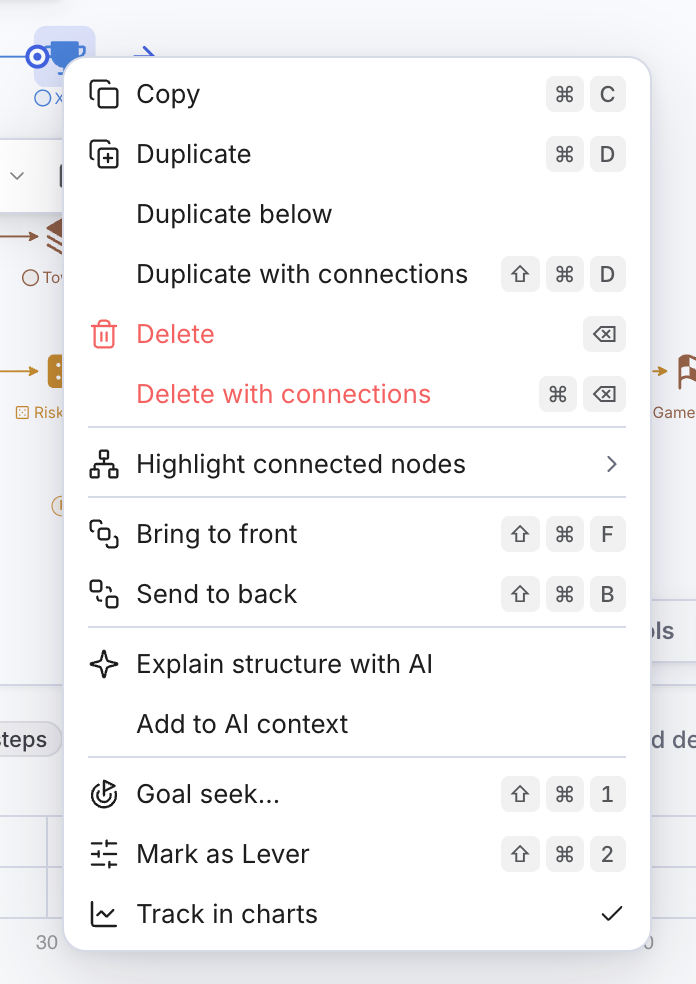
- Right-click on the “XP” pool and select the option “Track in charts”.
- To see the chart, click a chart card under the canvas, for example the Play summary card.
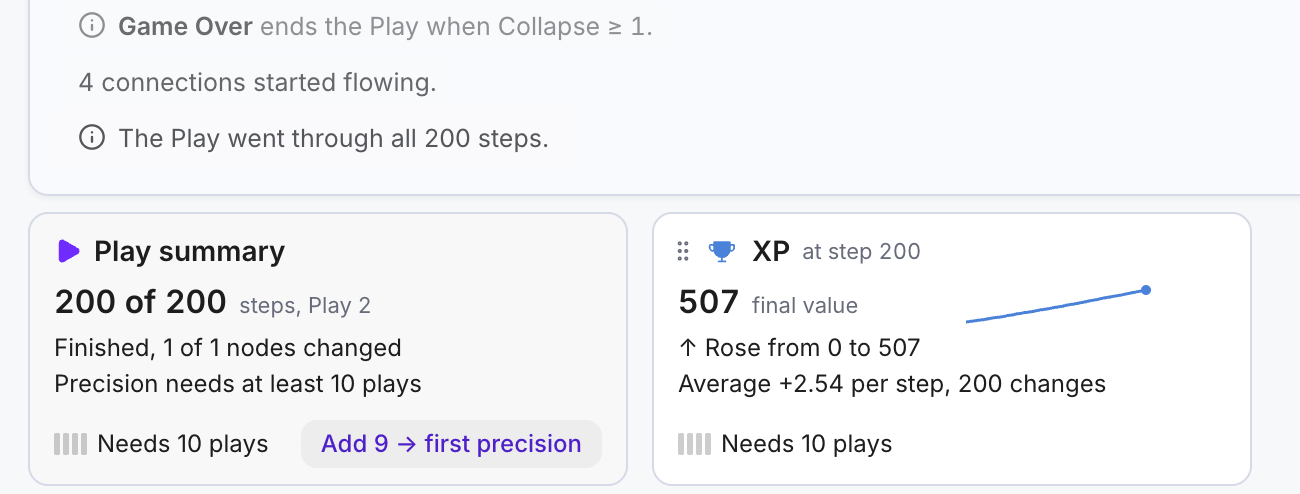
- You will see the chart panel open with the “XP” pool as a row in the table beside the chart. The arrow at the top right of the panel expands it over the canvas, and the same arrow shrinks it back.
- We also said that we wanted to know the XP a player will have after 200 minutes, or steps. Open the number next to the Play button in the playbar and enter “200” in its Custom box (any number from 1 to 9999 works).
- Press Play and you will see how the XP is plotted in the chart. Every time you press Play this is called an interactive Play because you can also make changes in the diagram while the Play is going.
Some notes about charts
- The table beside the chart has a row for every component you plot. You can only plot Pools and Registers.
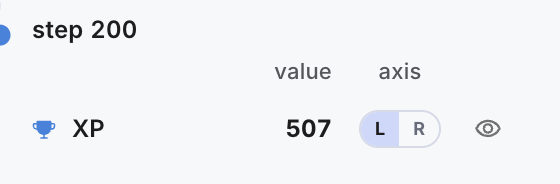
- The “x” axis is always the number of steps (or minutes in this case). The “y” axis will show the values for all the selected nodes. Here, the left “y” axis is showing the XP for the player on each step

- You can change the color of a plotted line by selecting the node on the canvas and choosing a color on the floating toolbar above it. In this case we are setting the color of the XP line to blue.
Forecasting the average XP for multiple users
You have been able to read the XP that a single user will have after 200 minutes. The previous player had 507 XP, but maybe another one will have 250, or another one 400. What if we want to Forecast the average XP for more than one user? With Monte Carlo you can ensure that the more Plays you make, the closer you will be to the real value, so we are going to make a Forecast of 10 users and calculate their mean XP.
- As we want to calculate the XP for 10 different users, open the menu next to the Forecast button (it reads 10× before your first Play) and choose “10” (or First precision, which also adds 10 Plays).
- A single Play shows the “XP” for one user. A Forecast of ten users draws the median of their XP as a line with a band around it, and the table beside the chart lists the mean, median, min, max and percentiles at the chosen step. We want the mean XP among all users, so there is nothing to add: the mean is already in that table.
- Press the “Forecast” button to start the Forecast in the background. It is added to the Forecasts list on the left of the chart panel (newest first), and you will see the chart plotted automatically. When the Forecast starts, Machinations opens the Scenarios tab, where its result appears.
- If you want to see the mean XP among all users at step 49, move the cursor over the chart at step 49 on the “x” axis and read the “mean” value of XP in the table. In this example, the mean XP is 284.
Read our charts article to learn more about all available options to evaluate your Plays or Forecasts.