Chart & forecasts
See how the chart and Forecasts work and obtain data from your model. We will recap what we’ve already learned, plus more.
We’ve already experimented with Plays, but these aren’t the only way to obtain data from your model. We will recap what we’ve already learned, plus more.
The Playbar

From left to right:
Play – the diagram plays in real time, step by step, until it reaches the last step or you press Pause (the Play button changes to Pause during a Play). The small arrow on the Play button renames a Play (for example Game or Season) and suggests matching step words.
Steps – the number next to Play is the length of a Play. After the given number of steps, the Play ends. The menu beside it shows the unit (steps).
Step – the button with the arrow-and-bar icon: play just one step in your diagram, then pause. This is an easy way to debug your diagram as you build it, and identify where it breaks.
Reset – the circular arrow between Step and Speed: returns the diagram to its starting state. It has no effect on Forecasts that are already done.
Speed – the 1× menu: defines the speed of the animation in a Play.
Step counter – shows how far into your current Play you are (for example 13/100 steps), with a progress bar.
Forecast – plays your diagram instantaneously, many times, with no animation. This is faster than a Play. The number beside the button (10× at first) is how many Plays it makes. Once your model has results, the menu also shows how precise each step will make them.
The Chart
Under the canvas you will find a card for the Play and a card for each node that is shown in the chart. Click a card, for example Play summary, to open the chart panel. The arrow at its top right expands the panel over the canvas.
The first few components you add to your diagram will be automatically added to the chart. To add or remove one, select it and use the Outcome switch in the Properties panel (the right-click menu calls the same choice Track in charts).
You can select multiple components at once, by holding down the Shift button on your keyboard and clicking on the components you wish to select.
Let’s first add Wood, Stone and Houses Built to the chart. When we Play the diagram again, each of these nodes’ values will be tracked and visualized step-by-step.
Best practice: If you haven’t already, give each of these Pools a unique color, so that they are distinguishable in the chart.
Now hit Play. The chart will plot the values of the three pools at the end of each step, giving you a sense of how your economy evolves over time.
Each node has its own row in the table beside the chart, which gives you control over how it is shown:
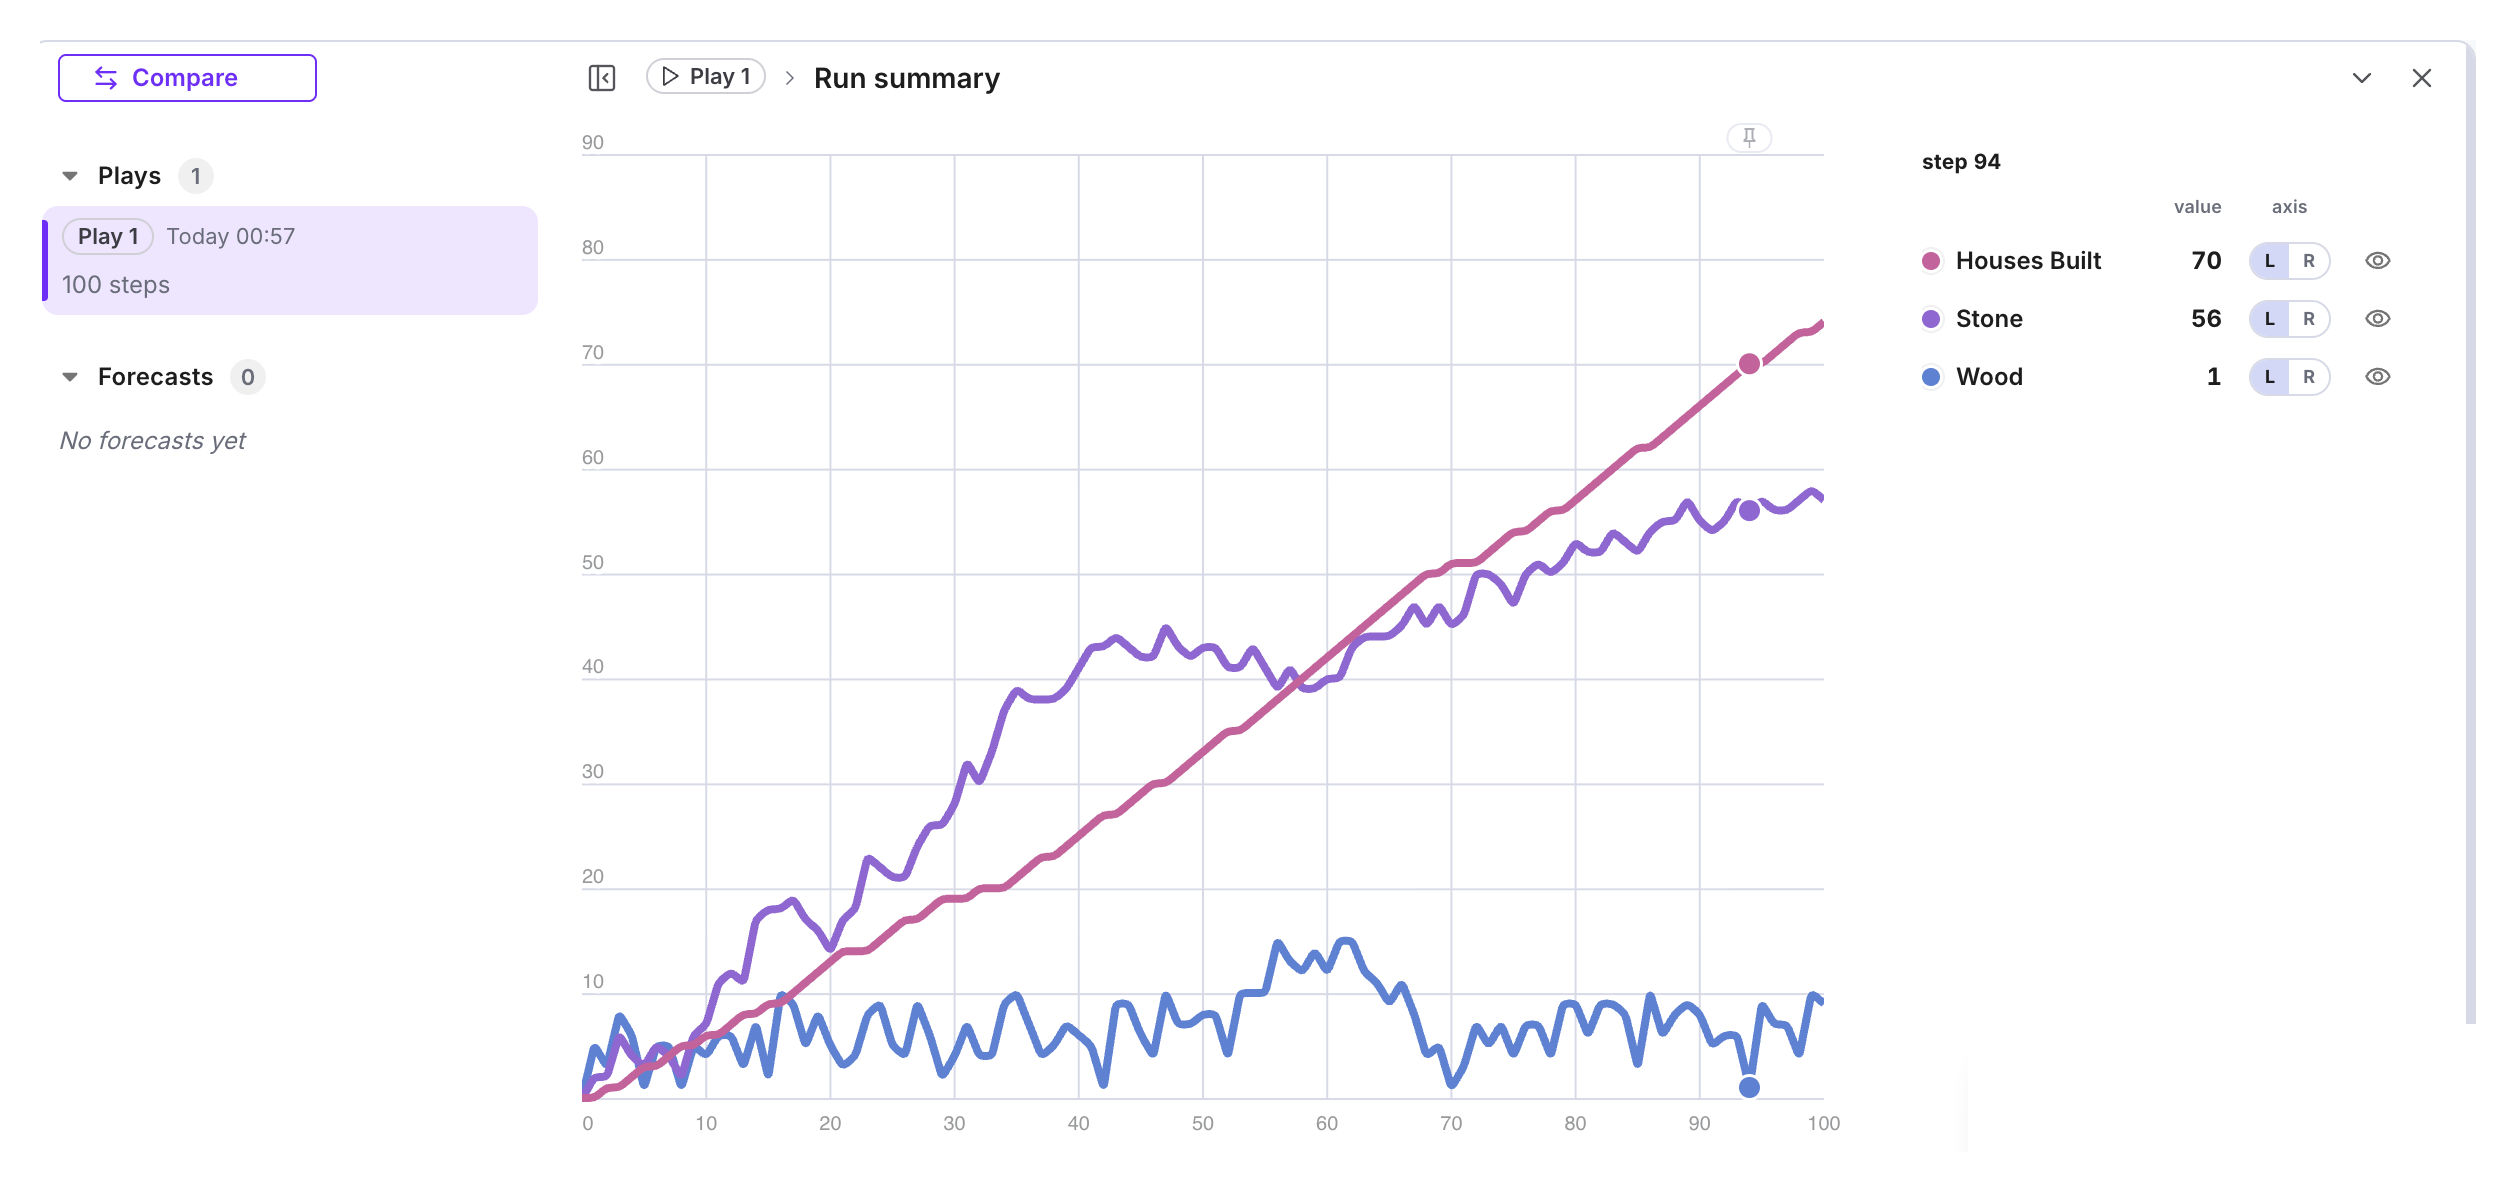
The chart panel lists your Plays and Forecasts on the left. Click one to see its chart.
In the table beside the chart, each row is a node: its value at the chosen step, an L or R switch for the left or right scale, and an eye to show or hide its line.
The R scale gives the node its own second vertical scale on the right. This is useful when you have a value in the chart that is much larger than the rest.
Forecasts
So far, we have only used Plays. These are ideal for giving us a deeper understanding of how resources flow in our diagram, and for making sure everything is working correctly.
However, if we want to investigate how the experience of different players varies from playthrough to playthrough (or player persona to player persona), we need a faster way to get many playthroughs.
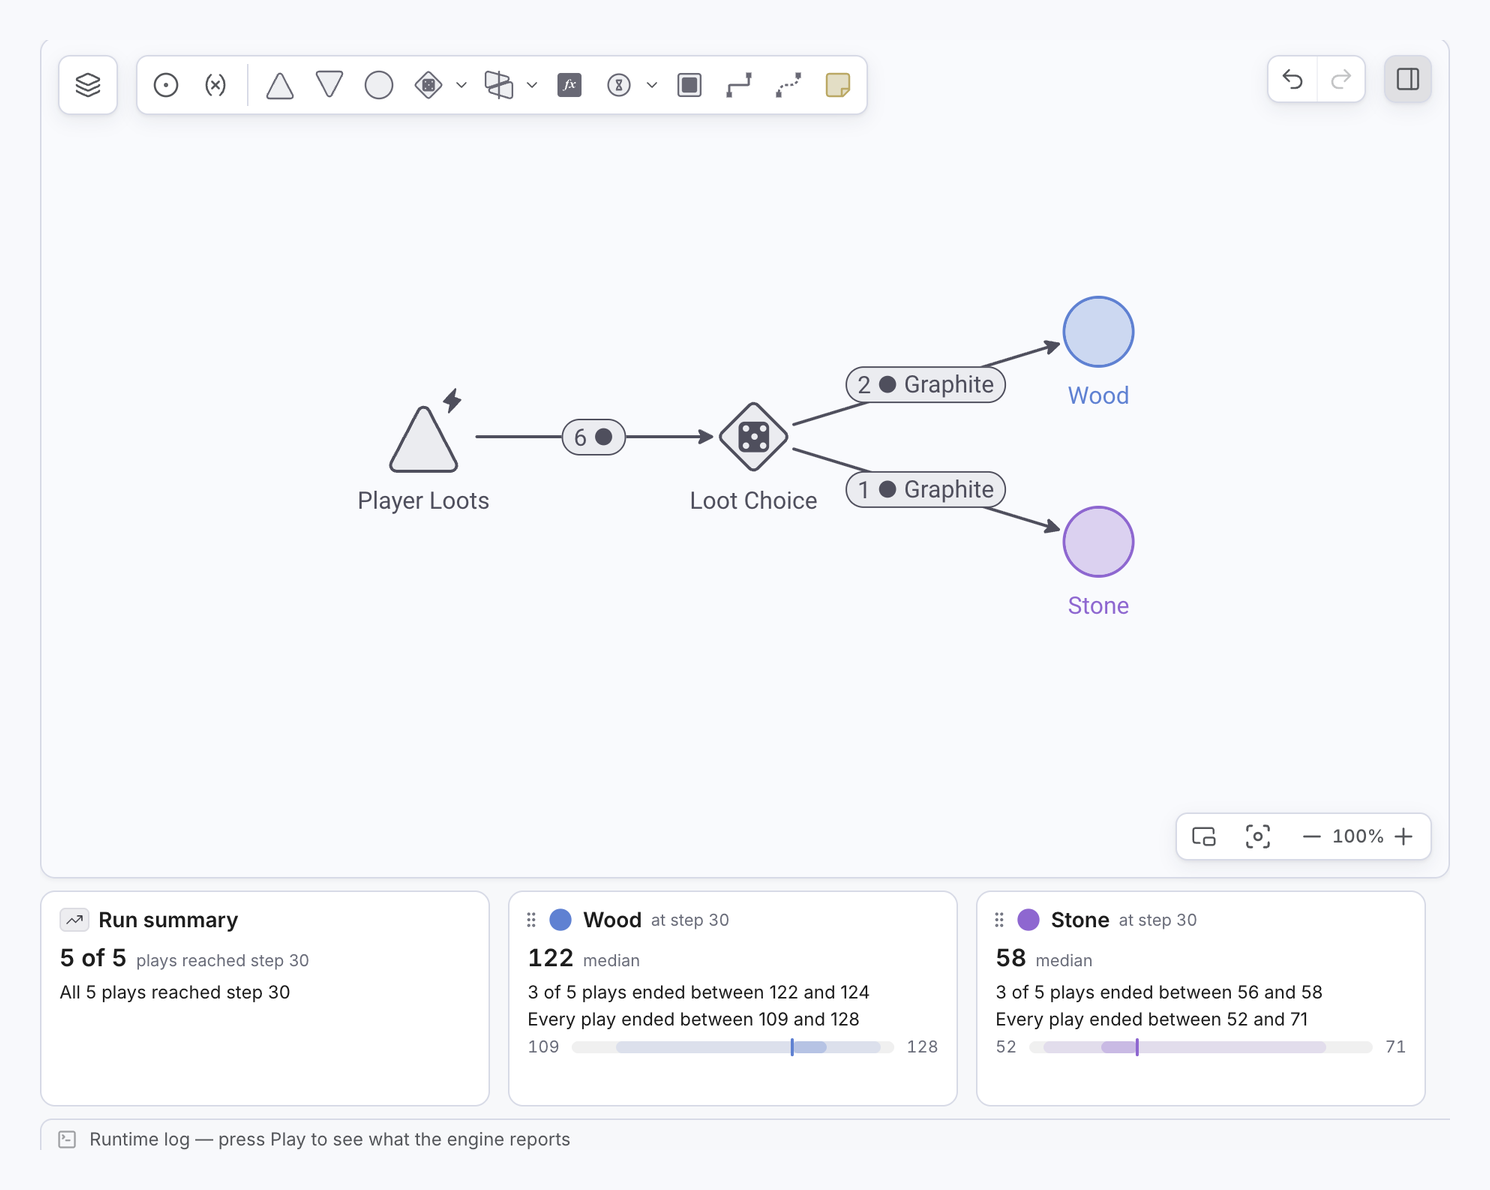
A Forecast achieves this purpose: getting quick results from many Plays of our diagram.
Forecasts will give you the same kind of results as Plays, just faster. The only exception is if your diagram contains interactive nodes (we have not used any in this tutorial).
Next to the Forecast button, open the menu (it reads 10× before your first Play and +10 plays after it) and choose 10 (after a Play, the first row reads First precision, +10 plays), then click Forecast. This Plays your model ten times, equating to ten playthroughs of the game. When the Forecast starts, Machinations opens the Scenarios tab, where its result appears.
Warning: a bigger Forecast costs more Credits, and the menu shows the cost of each size and how many Credits you have left this month. Start with fewer Plays until you know your diagram is working properly.
The new Forecast is listed under Forecasts in the chart panel, below your Plays.
To open another one, simply click on it. When you have more than one scenario (a new one starts when you change the model), point at a scenario’s card and tick its Compare box to see it beside the latest one.
Once the Forecast has completed, you’ll see the results in the chart: for each node, a median line with a band around it that shows how widely the ten Plays spread. The table lists each node’s median at the chosen step, with its min–max range and its mean when the panel is wide enough. A node’s detail view shows the full set (max, p99, p95, median, mean, p5, min).
Because we have an End Condition in our model, some Plays may end early. If a Play stops early, this means the player has starved.
Interpreting the results
Firstly, the fact that each Play produces different results is evidence that each playthrough will be different. Whether the amount of variation present is good or bad depends on your intentions as a designer. Too much variation may make your job harder, as you will need to balance for many different player journeys. Conversely, too little variation may make the game feel too predictable.
Try adding more nodes to the chart, such as Workers Employed or Food. Then try tweaking some of the design values, such as the loot earned per minute/step or the House-building requirements. Try some Plays or Forecasts and observe how these changes affect the player’s progression or chances of starving.
If you were to build this game and use this model as an economy prototype, consider what your design goals are: how long would you want a new player to survive before starving? How many houses should they have built after an hour? Try to quantify these goals, so that you can identify immediately whether your balance changes are successful or not.
You can find out everything else about Charts in our Charts documentation article.