Chart and forecasts
Use Charts and Predictions to examine how a card collection grows across repeated pack openings. As we Play the diagram.
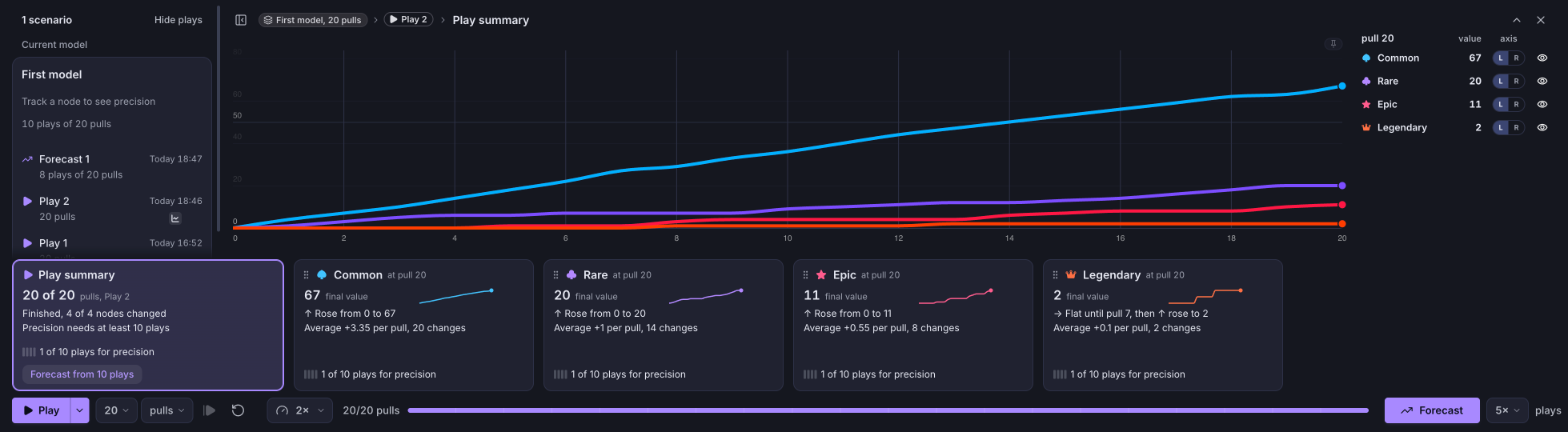
As we Play the diagram, we can observe how the quantity of cards changes by monitoring the values in each rarity pool. However, we can also use the chart and the result cards under it.
The chart provides a collated view of all the values your nodes had in previous steps.
After a Play, every pool is plotted in the chart (see here to learn how to choose what is plotted), and we can observe the evolution of the player’s collection. Each result card under the chart gives the final value of one rarity.
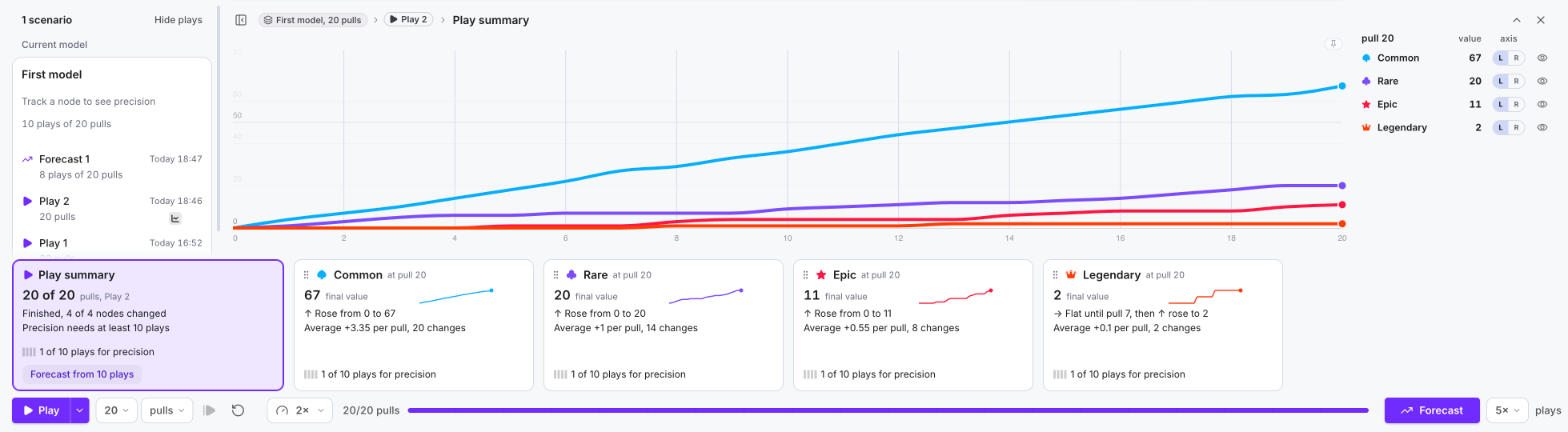
A single Play is only one story, though: we cannot tell from it how long a typical player needs to collect the rarer cards.
Watching your diagram in real-time can be invaluable for visualizing the system, but for getting results out of the chart, it’s quite slow – especially if we want to explore the experience of many players. This is where Forecasts come in.
Forecasts and Monte Carlo
Forecasts are a faster way to gain meaningful data about your system.
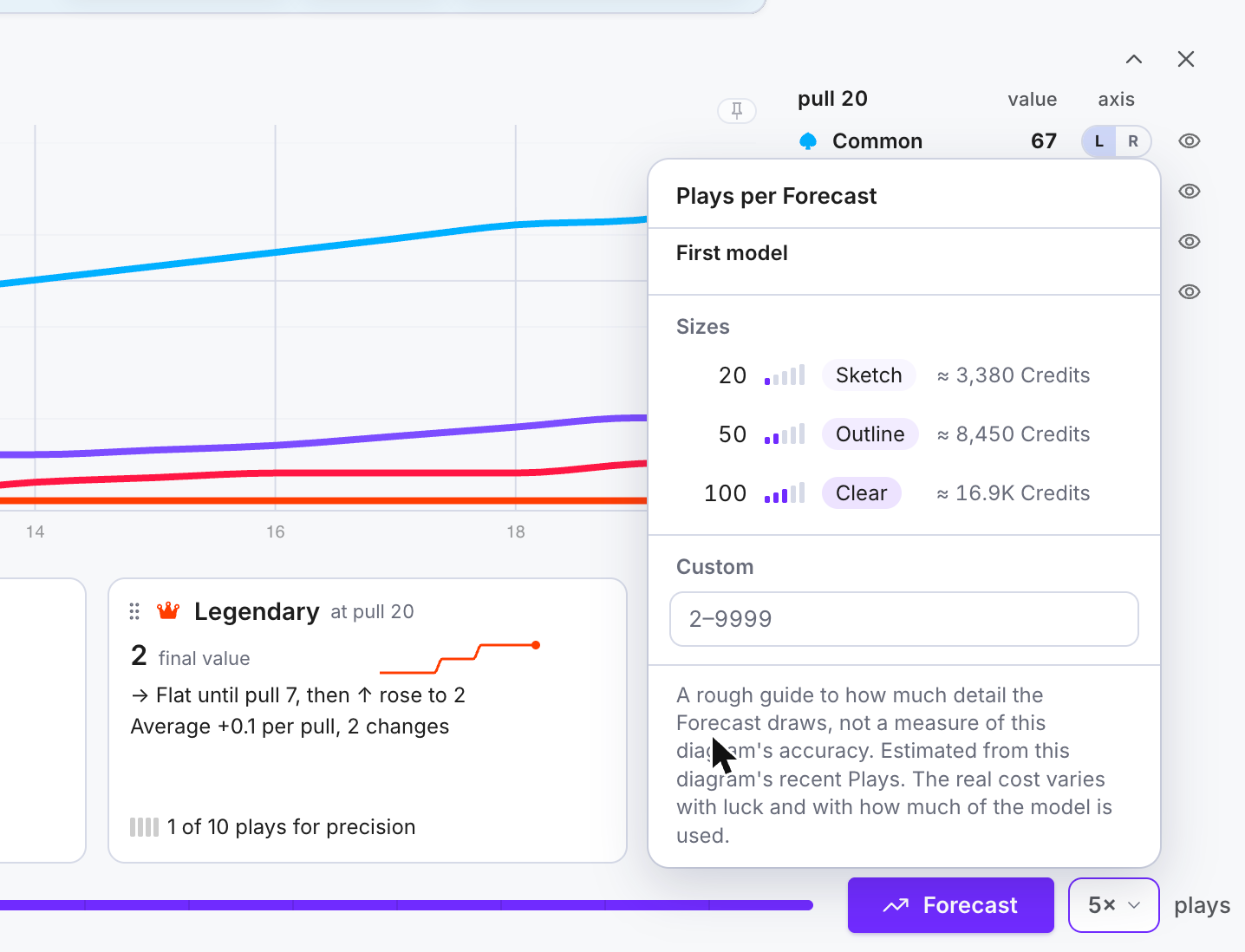
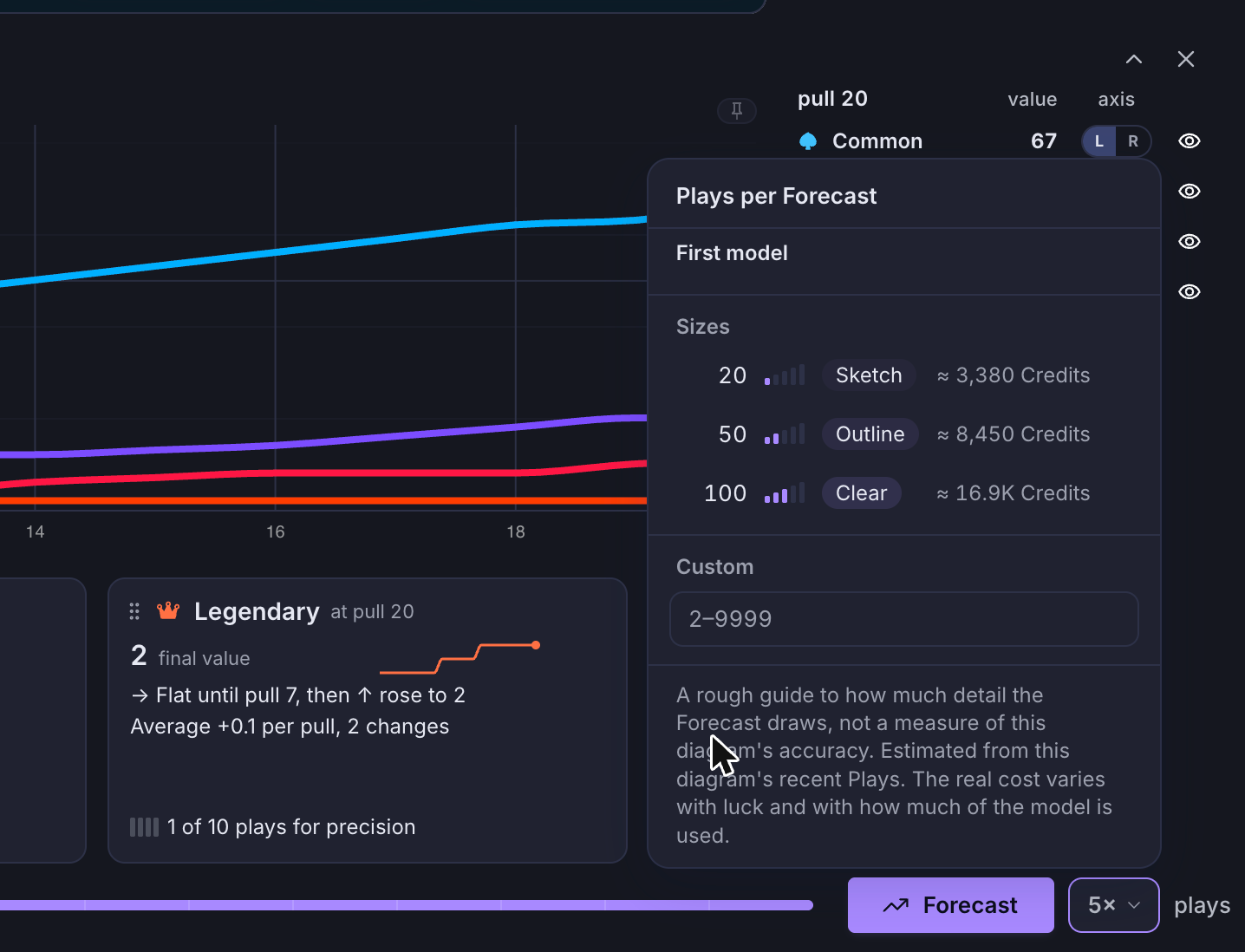
A Forecast makes many Plays in one go, and each Play lasts as many steps as you set (here, card packs opened). The menu next to the Forecast button sets how many Plays it makes: 10, 20, 50 or 100 (larger sizes go up to 2,000), or a number you type in Custom. Once your model has results, the menu lists precision steps instead (First precision, Fair, Good and Sharp), each with the number of Plays it takes to reach it. When the Forecast starts, Machinations opens the Scenarios tab, where its result appears.
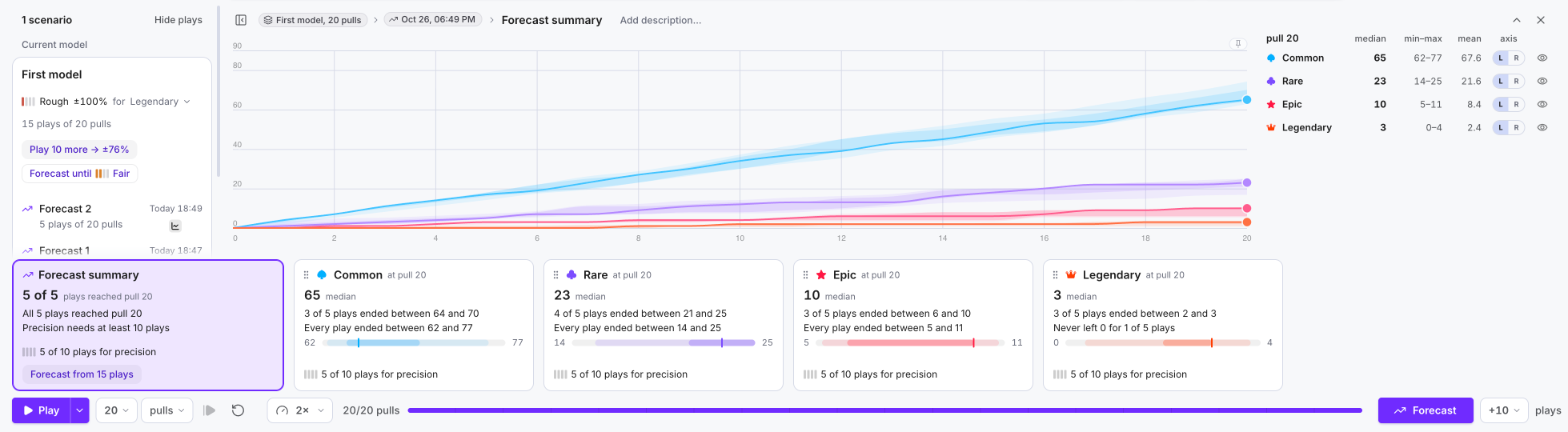
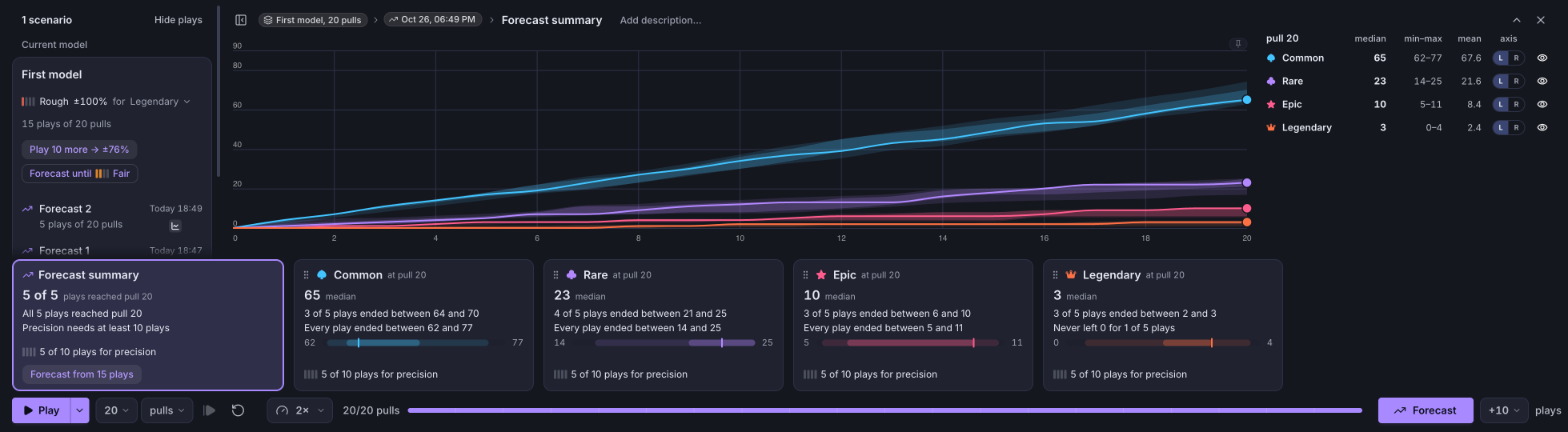
After a Forecast, we can see how the player’s collection might evolve. The chart draws the median of all the players as a line, with a band around it that shows how widely they spread. Every player goes through the exact same system.
The band shows that some players are very lucky, earning many more Epics and Legendaries than others; while other players are comparably unlucky, and don’t get many of these high-rarity cards.
The result cards show the spread in numbers: under each pool, a bar runs from the lowest to the highest ending of all the Plays, with the median marked. Each card also carries a precision rank once the Forecast has at least 10 Plays.
The spread of results gives us a better understanding of all the possible outcomes our system can produce, and thus allows us to account for them. Simply looking at the average outcome of the system wouldn’t give us nearly the same level of insight, and could lead to unforeseen consequences.
When you make a second Forecast, it is added to the list on the left of the chart panel. Change the model, Forecast again, and use Compare to put the results of two different scenarios on one chart.