E-commerce system modeling
Map the decisions across customer journeys, inventory, fulfillment and service, so teams can see how one change may shift other outcomes.
Trusted by E-Commerce brands from around the World



Navigate the complexities of online retail with precision. Unleash the power of data-driven insights to shape customer experiences, maximize sales, and stay ahead of the competition.
Design
Create playable diagrams for any system, regardless of complexity. Make feedback loops and economies easier to validate, communicate and understand.
Predict
Gain data-driven insights by employing out-of-the-box Monte Carlo simulations. Test what-if scenarios and measure their impact in a safe, virtual environment, with one click of the button.
Balance
Move the Levers of a model, Forecast what each change does and compare the Outcomes of every Scenario, so a system is balanced on evidence rather than trial and error.
What you can do with it
User journeys
Map the paths users take through a shop and find common routes and bottlenecks.
Conversion funnel
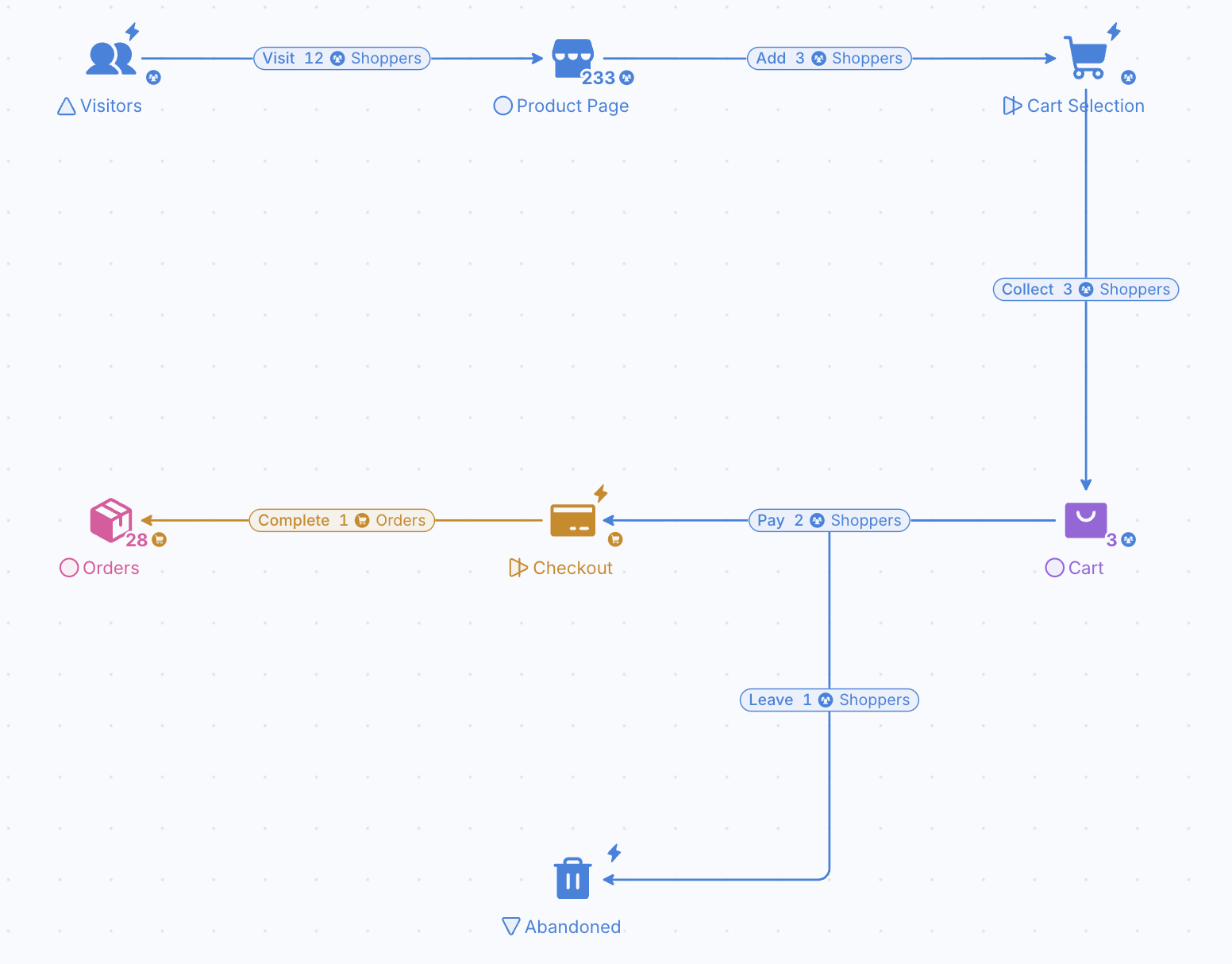
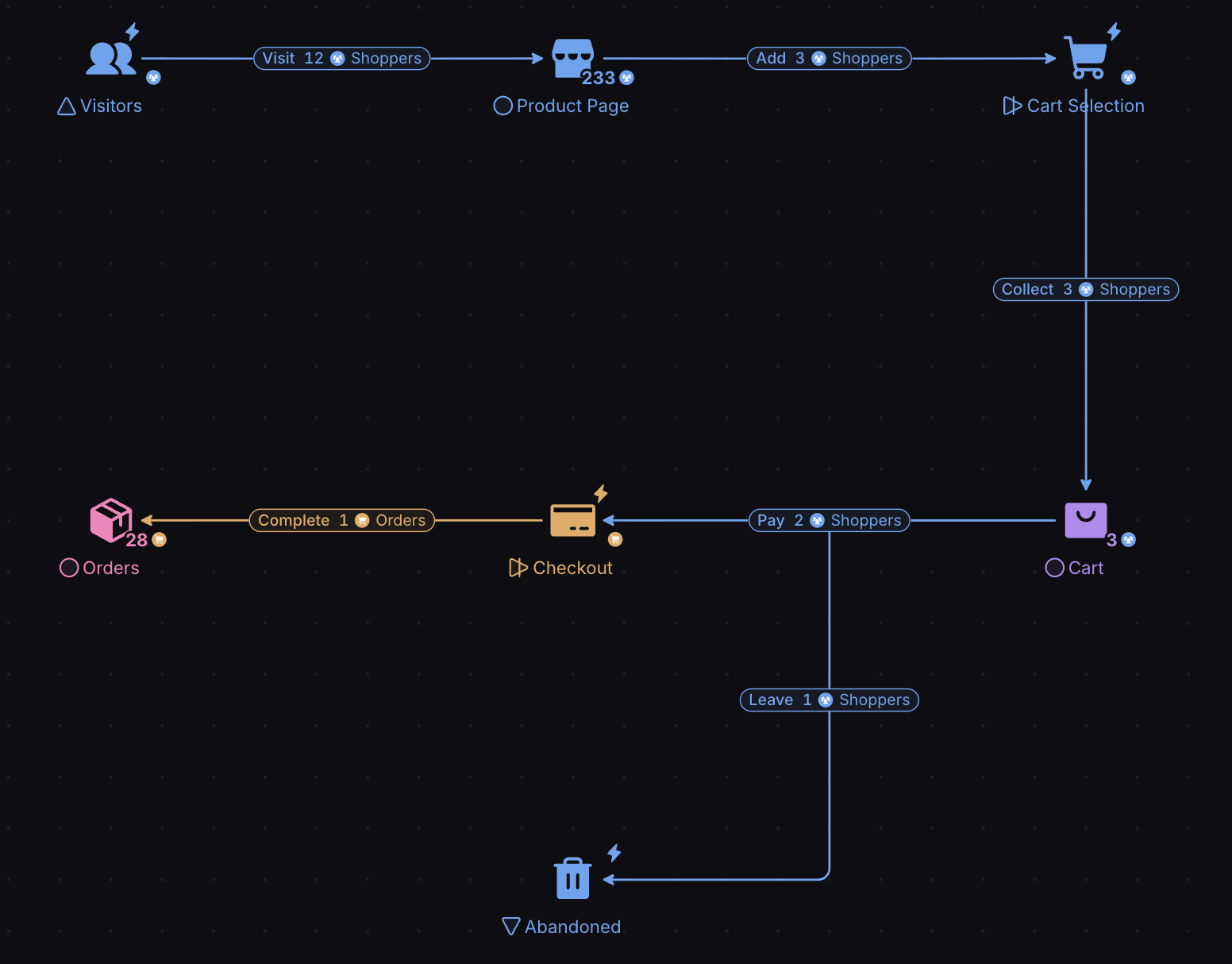
Follow the funnel from visit to purchase and see where users drop off or abandon carts.
Inventory management
Simulate inventory, supply chain dynamics and demand swings to cut stockouts and holding costs.
Customer lifetime value
Predict lifetime value from acquisition, retention and purchasing behavior to target marketing.
Seasonal demand
Model seasonal swings to adjust inventory, campaigns and staffing in time.
Supplier relationships
Simulate how supplier changes affect inventory, fulfillment and profit.
Inventory control: modeling adaptive restocking
Inventory control means balancing stock levels, stockouts and holding costs while demand keeps changing. This diagram shows how to visualize, forecast and balance the stock of an e-commerce business.
Each step is one day, shown in the blue pool “Days simulated”. A mod() function on the “End of month” register turns days into months, and a custom variable array, “items_sales_per_day”, sets daily sales between 4 and 7 items depending on that month’s popularity. The first month starts with a baseline of 100 items in stock, and the yellow and gray components handle stocking. The green pool “items sold in a month” counts sales.
At the end of each month the restocking source reactivates, with three adaptive rules:
- If more than 150 items are in stock at the start of a month, restocking is postponed (the first row of gray registers).
- If fewer than 80 items sold, restocking drops by 20% to avoid overstocking.
- If more than 90 items sold, restocking rises by 20% to match demand.
Over a full year the Chart shows stock, production costs and sales together. The shop is never understocked or overstocked, so the restocking strategy is balanced, and it becomes profitable on average in April, when sales pass costs.
Model the store before the sale goes live
Model traffic, stock, discounts and returns, then Forecast margin and sell-through before you set the price.
- ISO 27001 certified
- SSO & SAML
- GDPR compliant
- Trustpilot verified
- Red Herring Top 100
- Dealroom Rising Star