Transportation and infrastructure modeling
Visualize the dependencies between users, vehicles, infrastructure, schedules and capacity that matter to a planning question, and make the assumptions available for review.
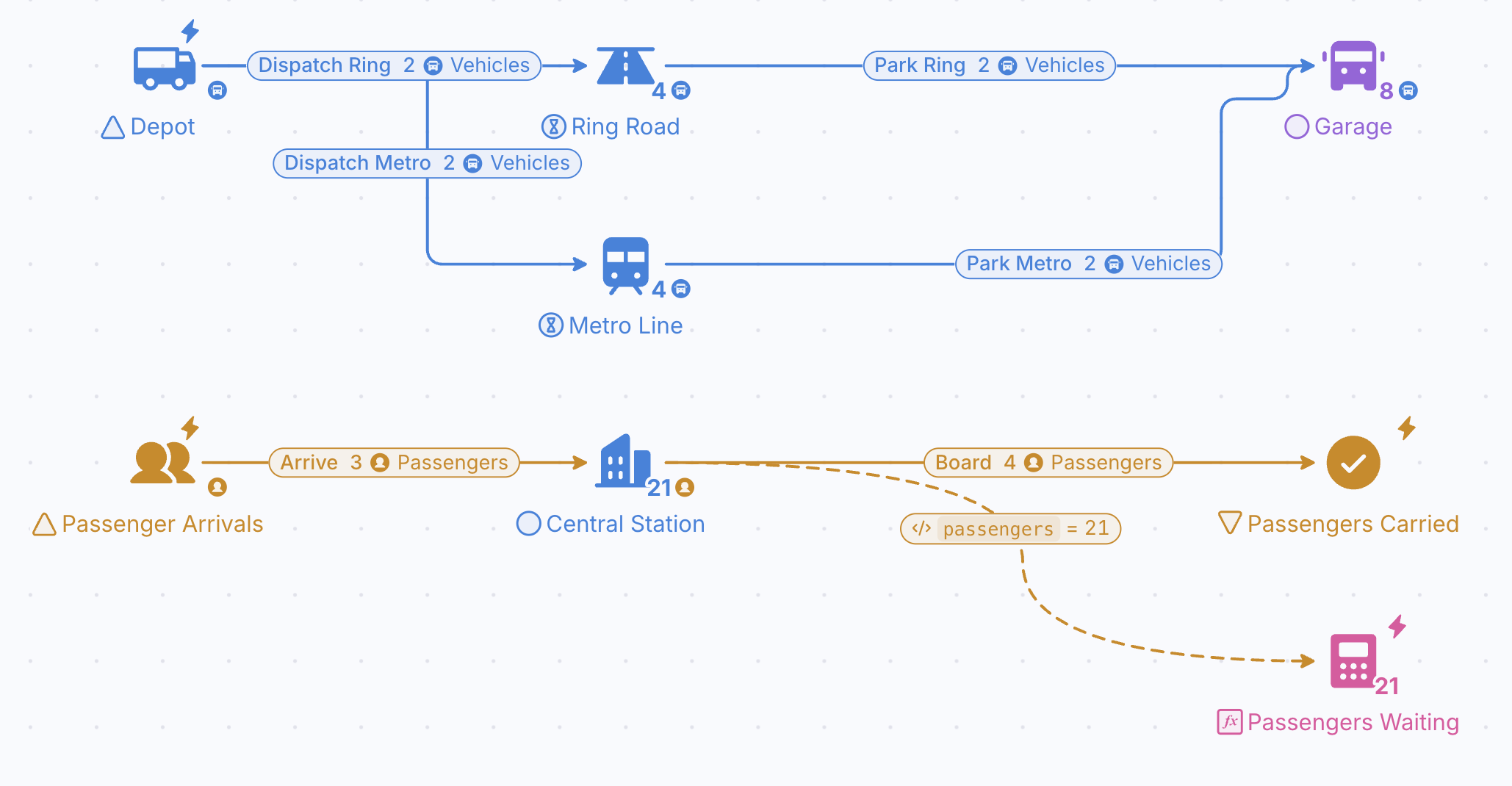
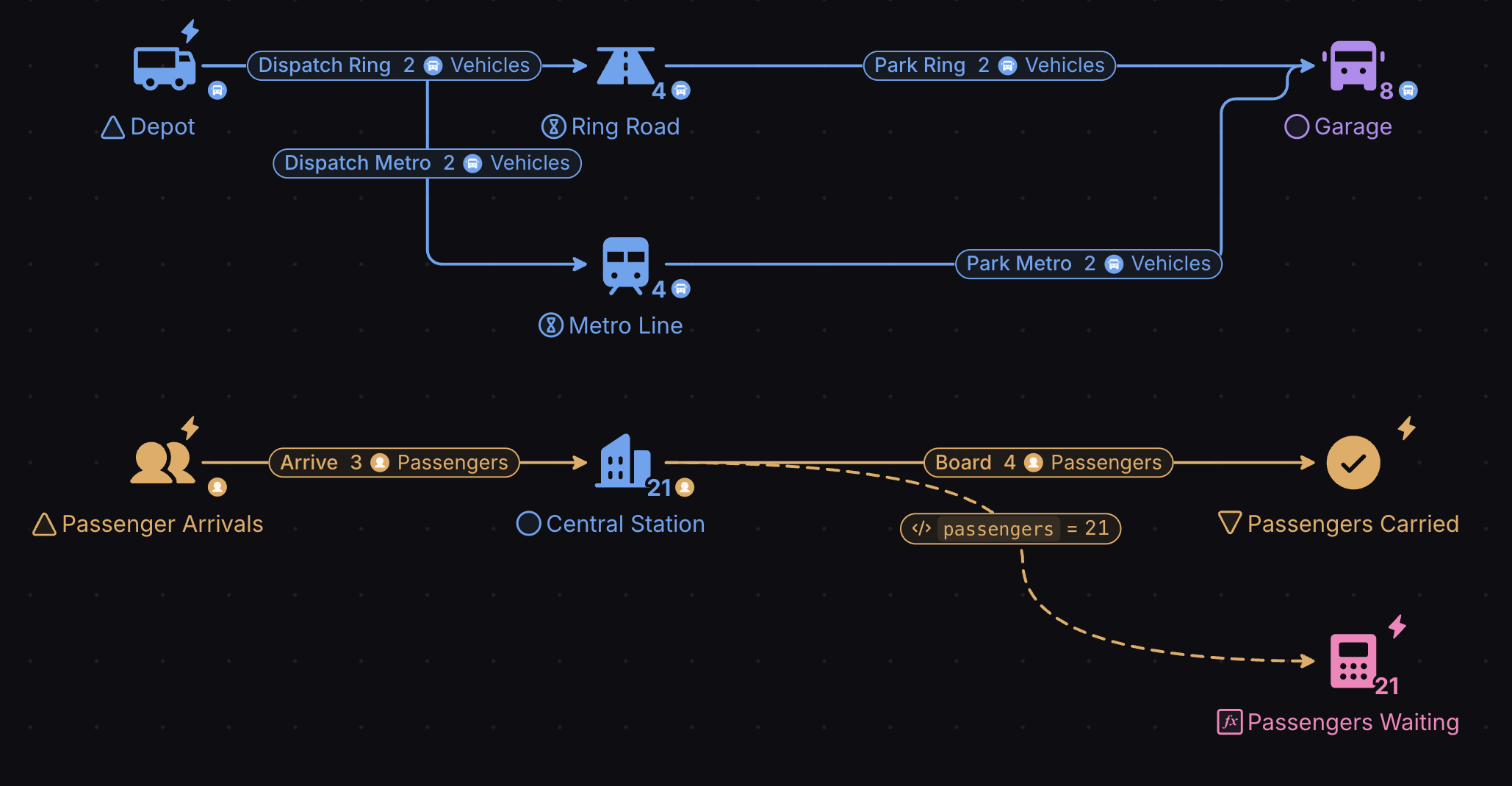
Transform your transport systems with advanced modeling and analysis for efficient and sustainable infrastructure.
Design
Create playable diagrams for any system, regardless of complexity. Make feedback loops and economies easier to validate, communicate and understand.
Predict
Gain data-driven insights by employing out-of-the-box Monte Carlo simulations. Test what-if scenarios and measure their impact in a safe, virtual environment, with one click of the button.
Balance
Move the Levers of a model, Forecast what each change does and compare the Outcomes of every Scenario, so a system is balanced on evidence rather than trial and error.
What you can do with it
Traffic flow
Model vehicles, intersections and signals to test signal timings and road layouts against congestion.
Infrastructure projects
Predict how a new highway or bridge changes traffic patterns and connectivity.
Public transit
Plan routes, schedules and frequencies to maximize coverage and minimize waits.
Freight and logistics
Model trucks, trains and ships to improve routes, schedules and load management.
Shared mobility
Simulate ride-hailing, car-sharing, bike-sharing and parking to plan service areas and vehicle distribution.
Environmental impact
Model emissions and noise, and test mitigation such as green infrastructure.
Lane efficiency study on cross intersections
A traffic study measures volume, influx, capacity, congestion and delay to predict traffic trends and propose fixes for flow and safety.
It guides road design, urban planning and traffic management, and shows where a new development will create bottlenecks. Collecting that data the traditional way is slow and expensive; a Machinations model lets you test signal timings and lane layouts before anything is built or repainted.
This study models a 4-way intersection controlled by traffic signals, with 10 inbound lanes (3 from North, 3 from West, 3 from South, 1 from East) and 7 outbound lanes. Each lane has two parameters:
- Traffic influx: 1 car a second from the North and West lanes, 1 car every 2 seconds from the South lane and 1 car every 3 seconds from the East lane.
- Traffic flow: the probabilities that drivers pick each exit, for example from the South 10% choose the right lane, 60% forward and 30% left plus forward, from the North 30% turn right and 70% continue forward split evenly over two lanes, and from the West 40% take the right plus forward lane and 60% split evenly over the two left lanes.
The signals share a 50-second cycle in which no conflicting lanes are green together, and as many compatible lanes as possible are green at once to cut waiting at red. Green time is longest for the busiest lanes: North L1 gets 40 seconds, South lanes 1 to 3 get 30, East L1 forward gets 20 (seconds 30 to 50), North L2 and L3 get 20 (seconds 10 to 30), and West L1 and L2 get 10 plus 20. The timing follows each lane’s flow, so the lanes with the highest influx, North L1, South L2 and West L1 and L2, get the most green.
Playing the model for 5000 seconds, averaged over 10 runs, shows the cars waiting per second in each lane. West L3 is worst at 8.79 cars, followed by North L2 at 6.32 and North L3 at 5.17. South L1 (0.33) and North L1 (0.79) are almost free-flowing, and in between come East L1 (4.79), South L2 (2.20), West L1 (2.17), West L2 (2.09) and South L3 (0.96).
The chart also shows that the West L3 queue keeps growing over time, because its influx is greater than what the intersection lets out. That lane is where retiming the signals or adding capacity pays off first.
Test the network before you pour concrete
Model routes, capacity and demand, then Forecast congestion and maintenance costs under each investment plan.
- ISO 27001 certified
- SSO & SAML
- GDPR compliant
- Trustpilot verified
- Red Herring Top 100
- Dealroom Rising Star