Predict outcomes with Monte Carlo forecasting
Ask what could happen under different assumptions: Play the model repeatedly and compare scenarios to see the range of outcomes before making a real-world change.
Trusted by companies worldwide






Gain data-driven insights by employing out-of-the-box Monte Carlo simulations. Test what-if scenarios and measure their impact in a safe, virtual environment, with one click of the button.
Risk-free
A safe way to test what-if scenarios without experimenting with real assets
Efficient
Less expensive & more efficient than experimenting in live environments
Precise
Capture more details than analytical models for accurate forecasts
What you can do with it
Safe environment
Predict the outcomes of future scenarios in a virtual environment and act on the measured impact.
Data-driven decisions
Decide from the data your diagram produces before you change anything in the real world.
Save time and money
Predicting the outcome of a change takes less time and costs less than experimenting in a live environment.
Monte Carlo
Get the results of multiple plays on the systems designed in minutes.
Cloud servers
Machinations aims for speed and stability, so every Monte Carlo Forecast runs on its cloud servers.
Scalable
Control how many plays you include in a prediction to improve their accuracy
Compare scenarios
Compare the results of 2 versions of a system, analyze them side by side to understand how changes impact outcomes, and make the right decisions
Statistical indicators
Enhance the understanding of the system's behavior by instantly plotting mean, median and min & max values
The charts a Forecast draws
One model, Played many times. The Forecast turns the plays into a median line with the bands where most of them land, the lines of every single play, how often each outcome came up, and a card for each number you track.
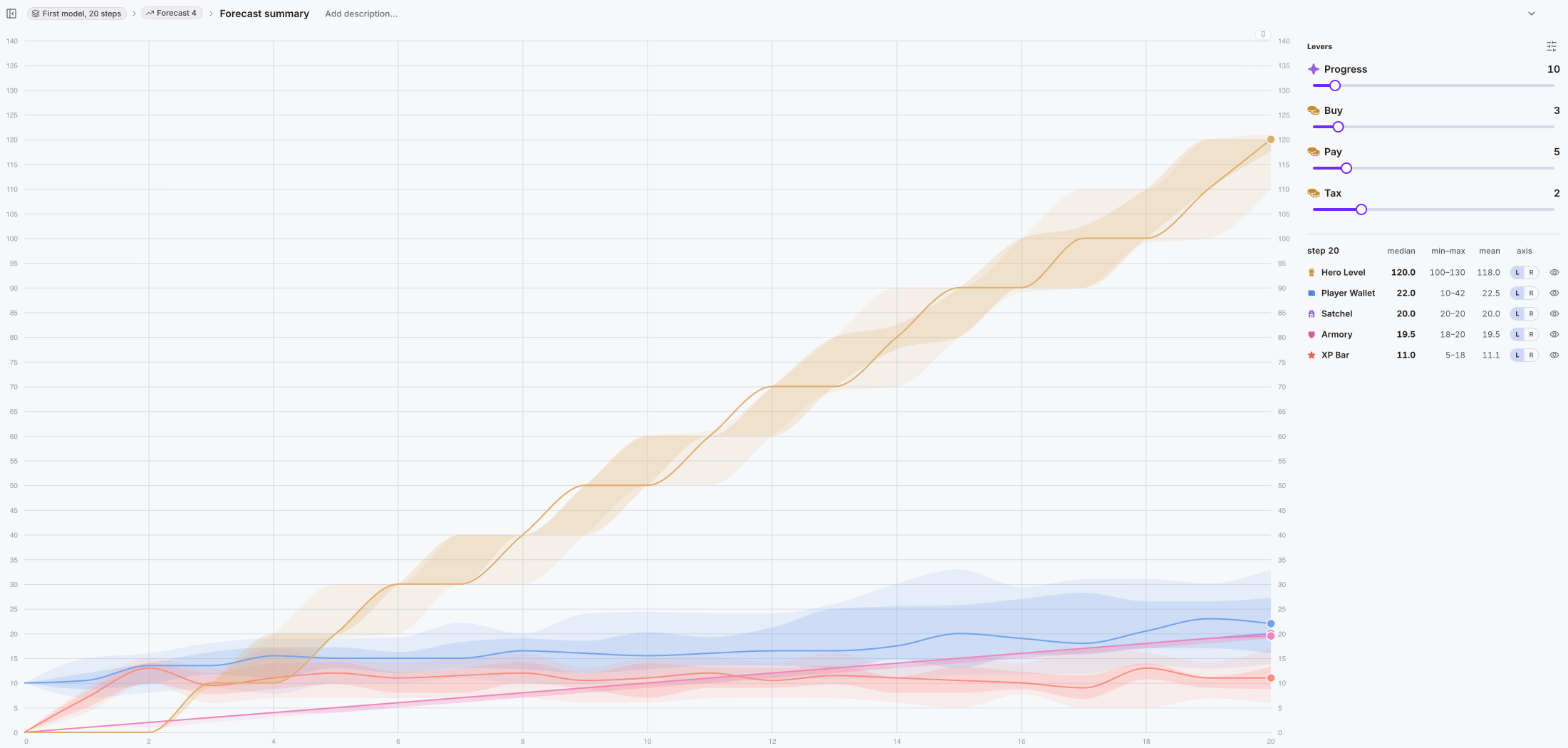
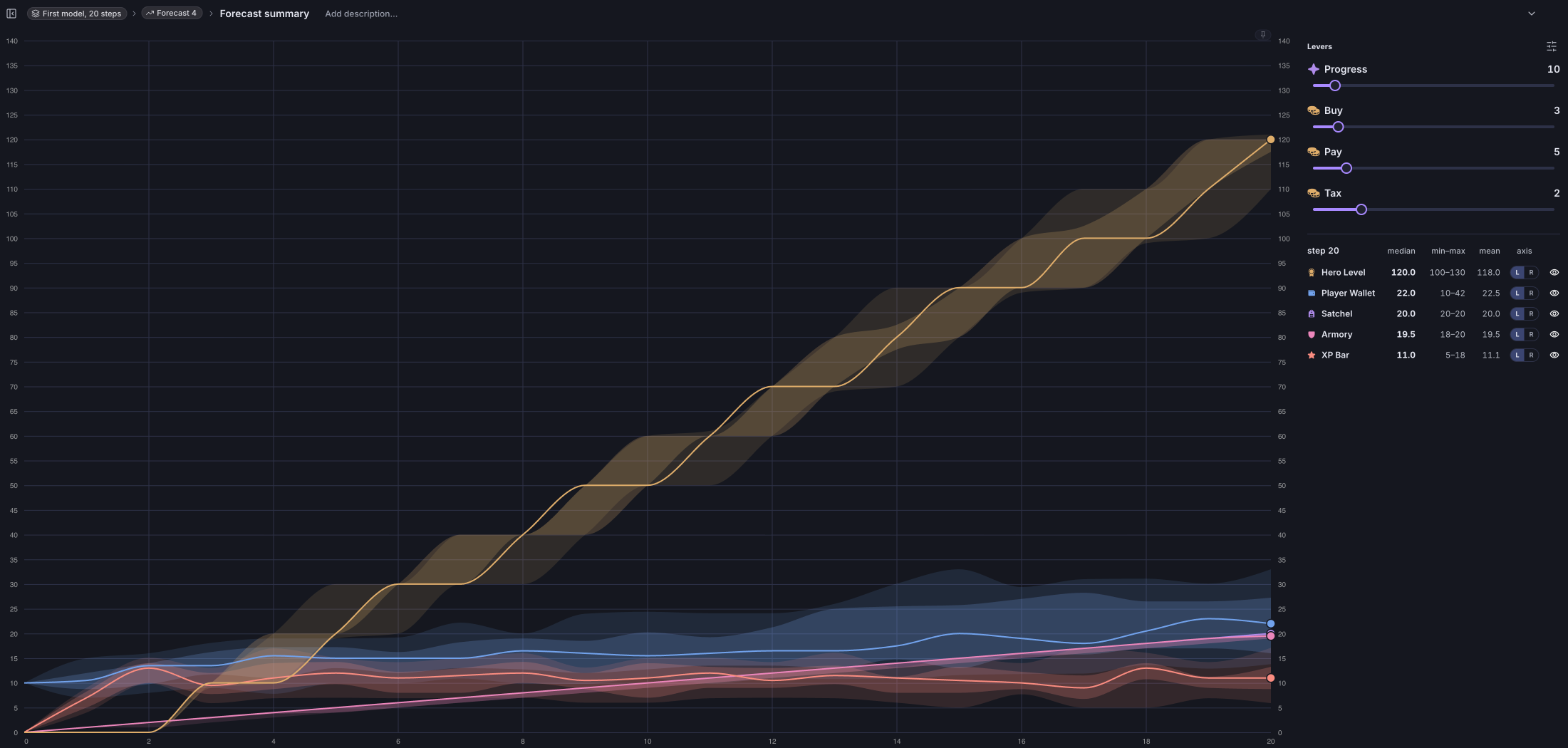
Forecast overview. Every tracked number as a median line inside the shaded bands where half and nine in ten of the plays ended, with the median, range and mean at the last step on the right and the Levers beside it. 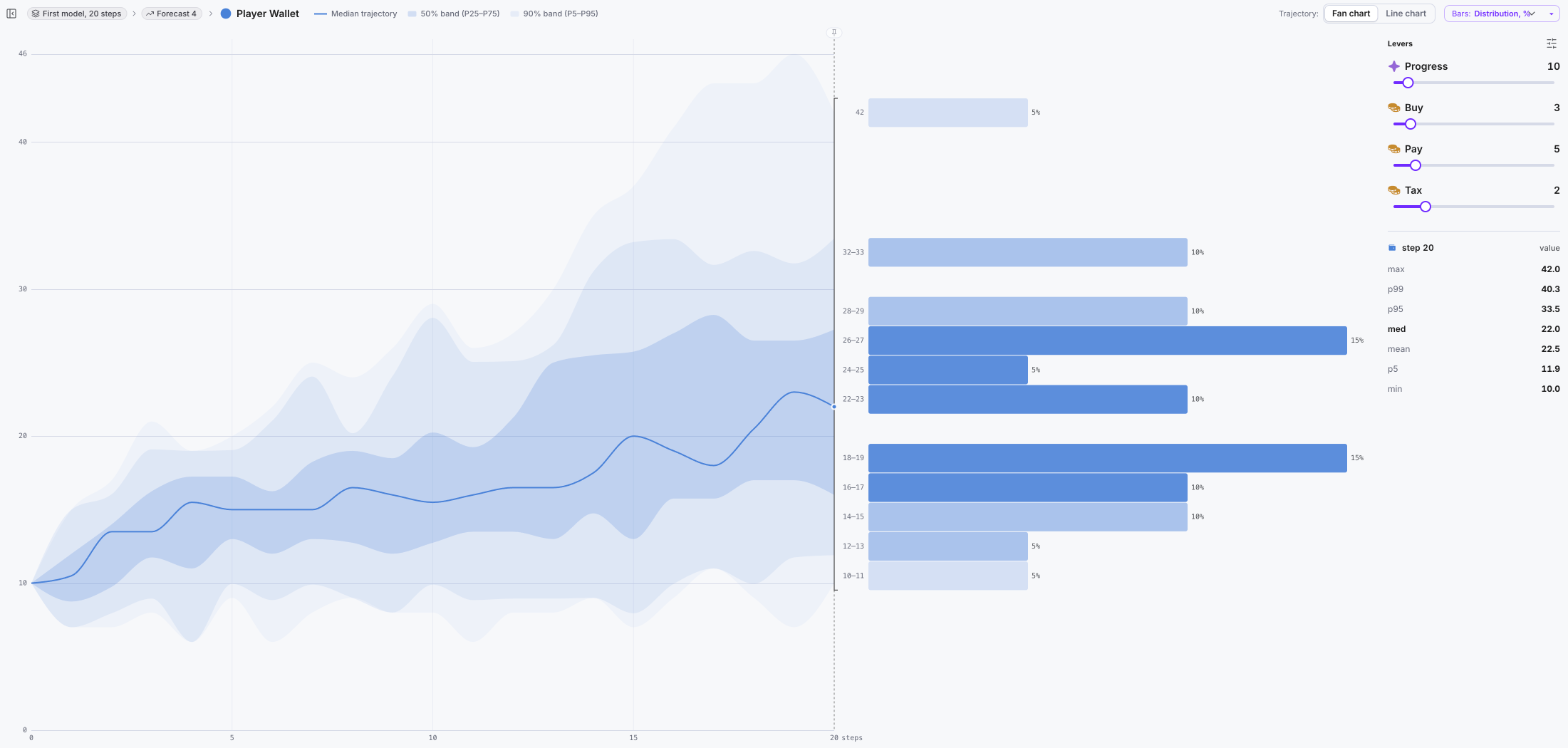
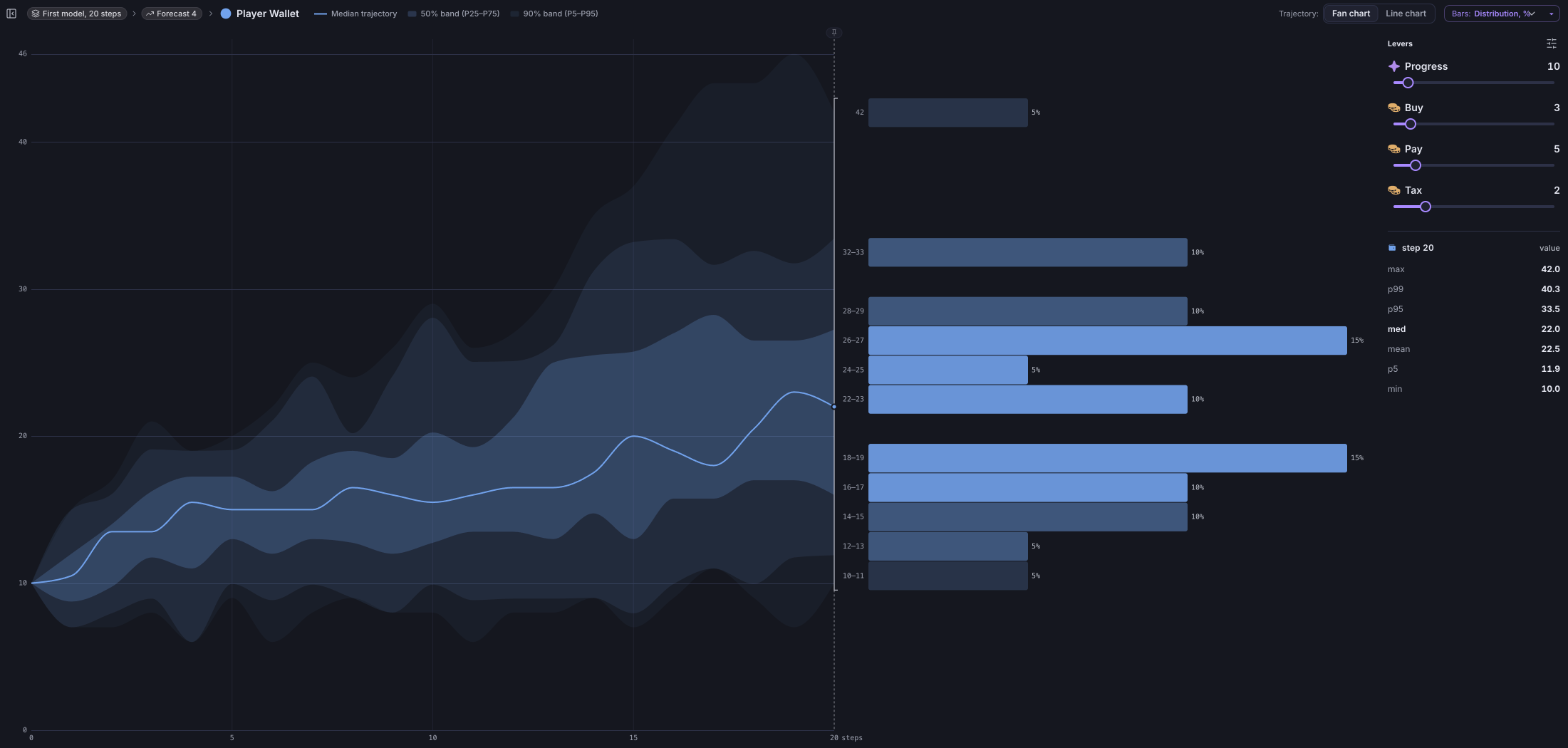
Fan chart. One number's median line with its 50% and 90% bands, and bars at the last step showing the share of plays that ended in each value range. 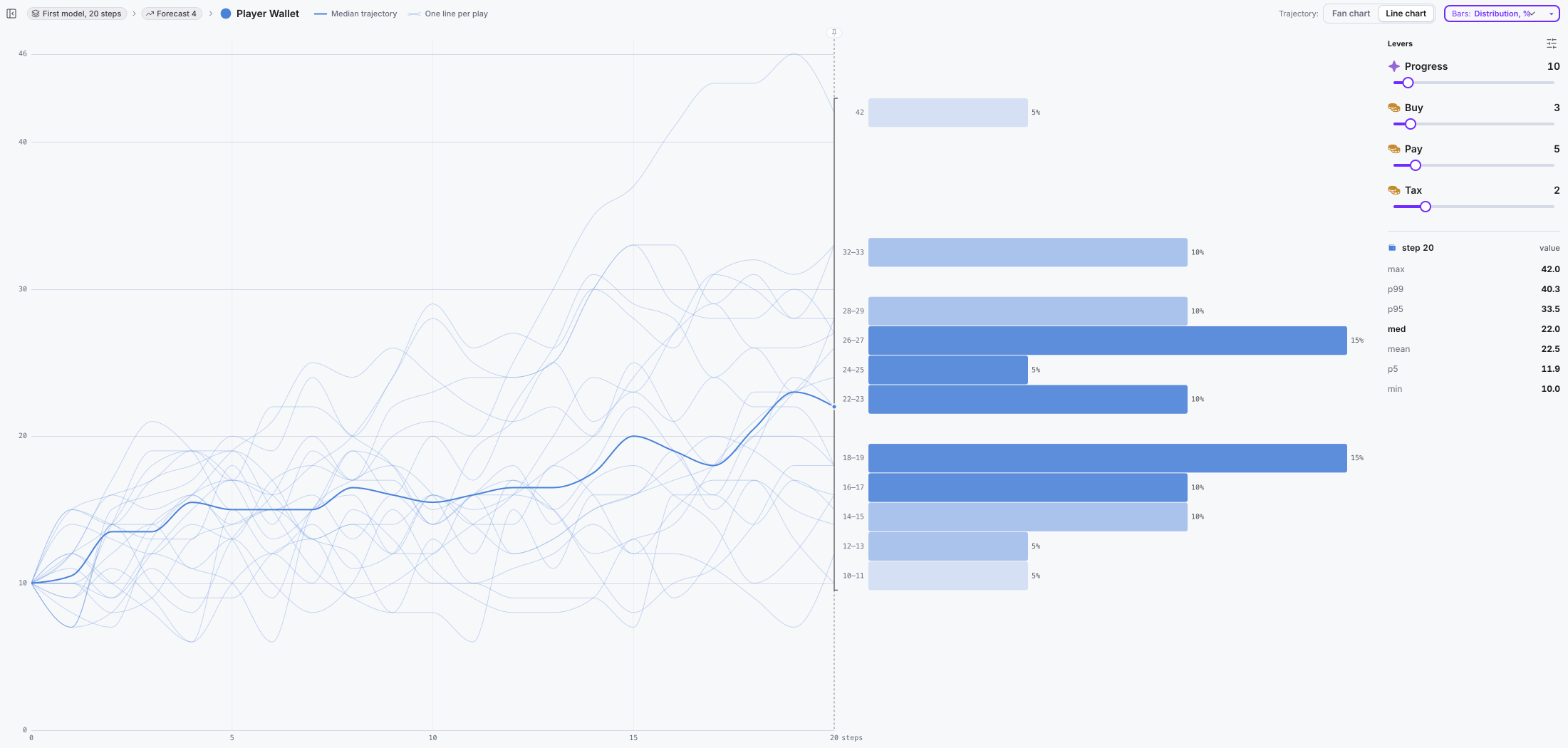
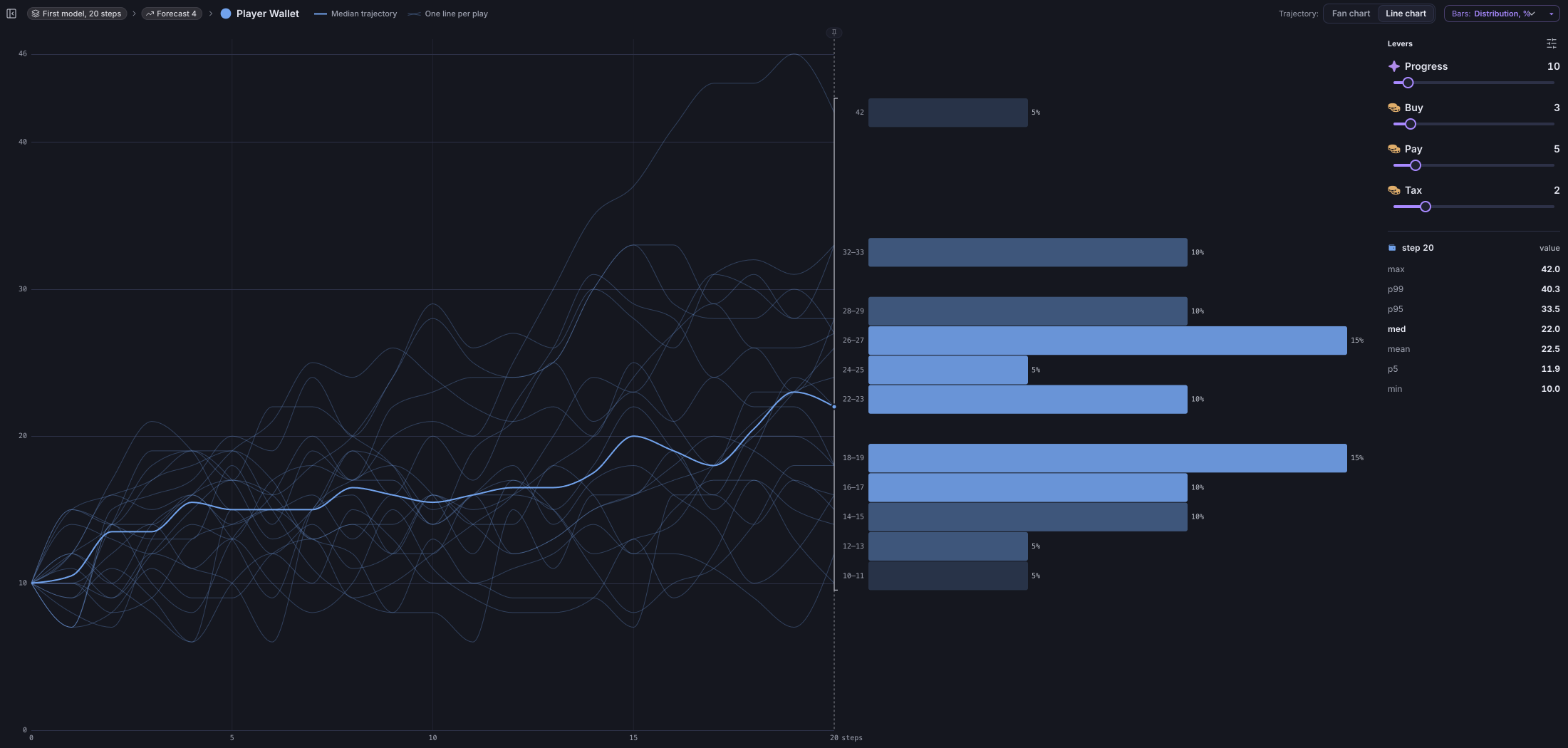
Line chart. The same number drawn as one thin line for every play, so you can follow each play's own path and see how far they spread. 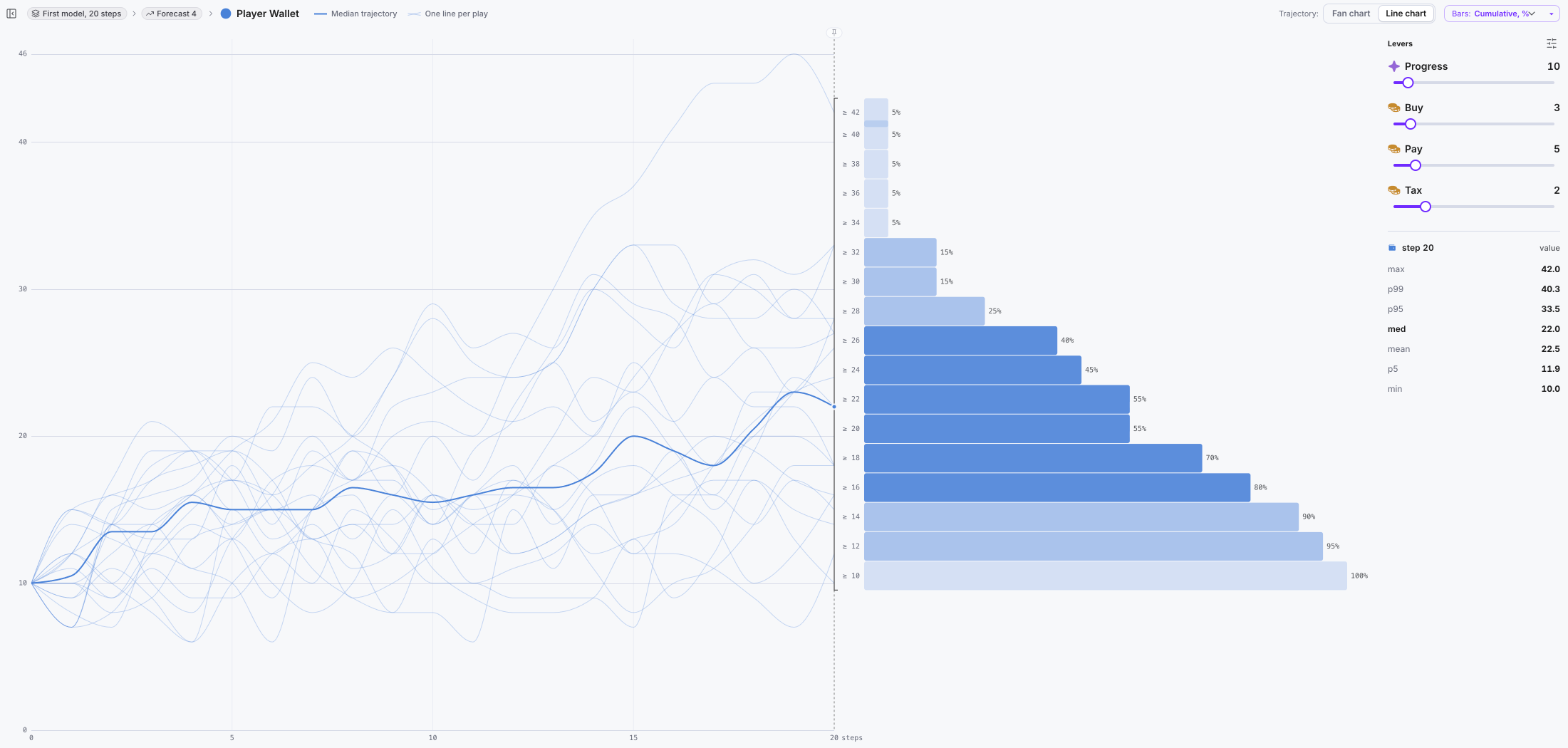
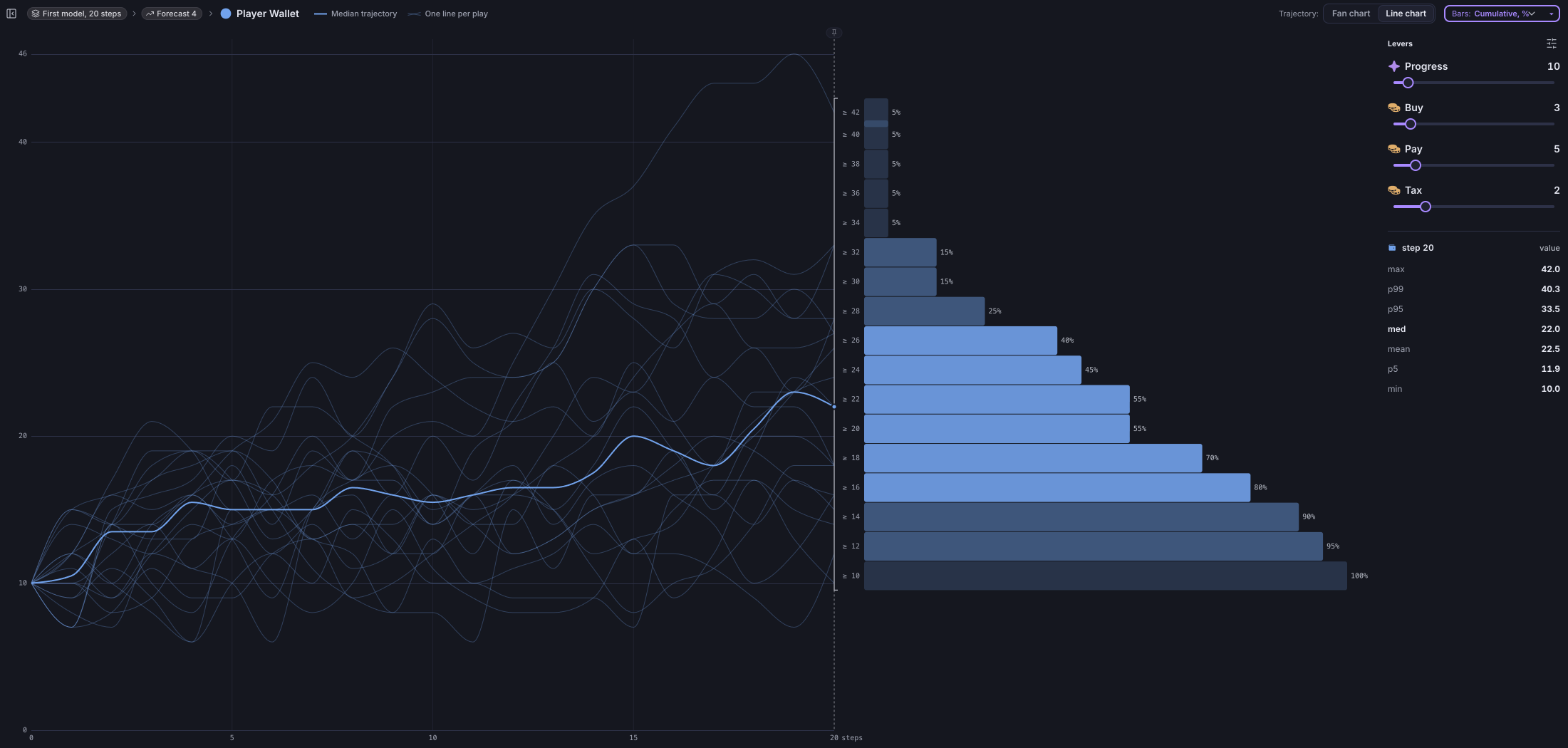
Cumulative bars. The bars can also show how many plays reached a value or more, so you can read the odds of getting at least a number, as a share or a count. 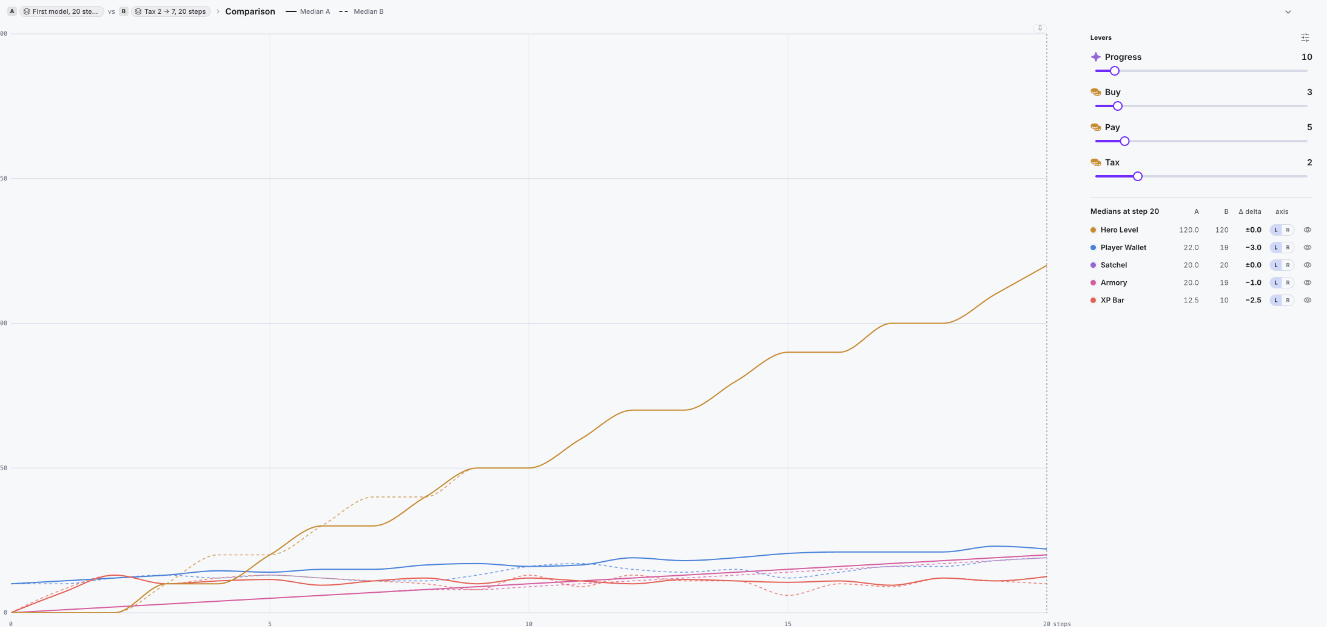
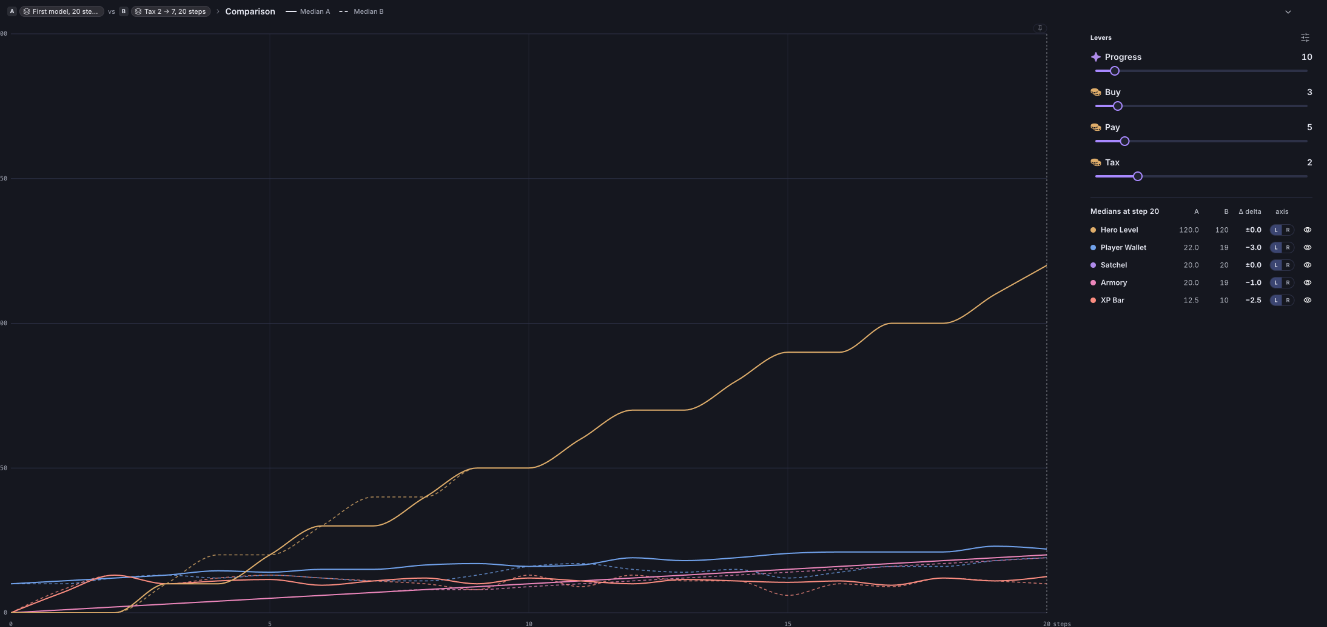
Compare scenarios. Two versions of the model side by side: the median of each number for A as a solid line and for B as a dashed one, with the difference at the last step. 

Result cards. A card for each number: its median, how much it may still shift, the range the plays covered, and a rating of how precise the Forecast already is.
Forecast the system before you decide
Play a model many times, compare Scenarios and see the range of outcomes before a decision costs anything real.
- ISO 27001 certified
- SSO & SAML
- GDPR compliant
- Trustpilot verified
- Red Herring Top 100
- Dealroom Rising Star