Manufacturing process modeling
Make the relationships between materials, people, equipment, schedules and constraints visible, so teams can inspect how an operational change may affect the whole process.
Trusted by Smart Manufacturers around the World



Design, predict, and balance sustainable and smart manufacturing systems on par with Industry 4.0 standards
Design
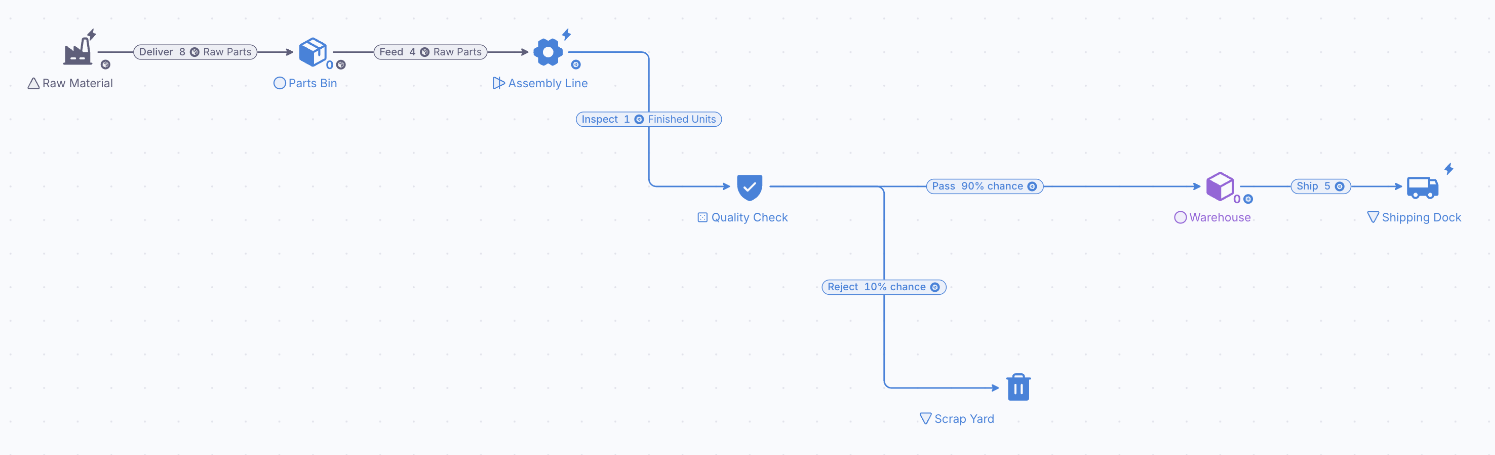
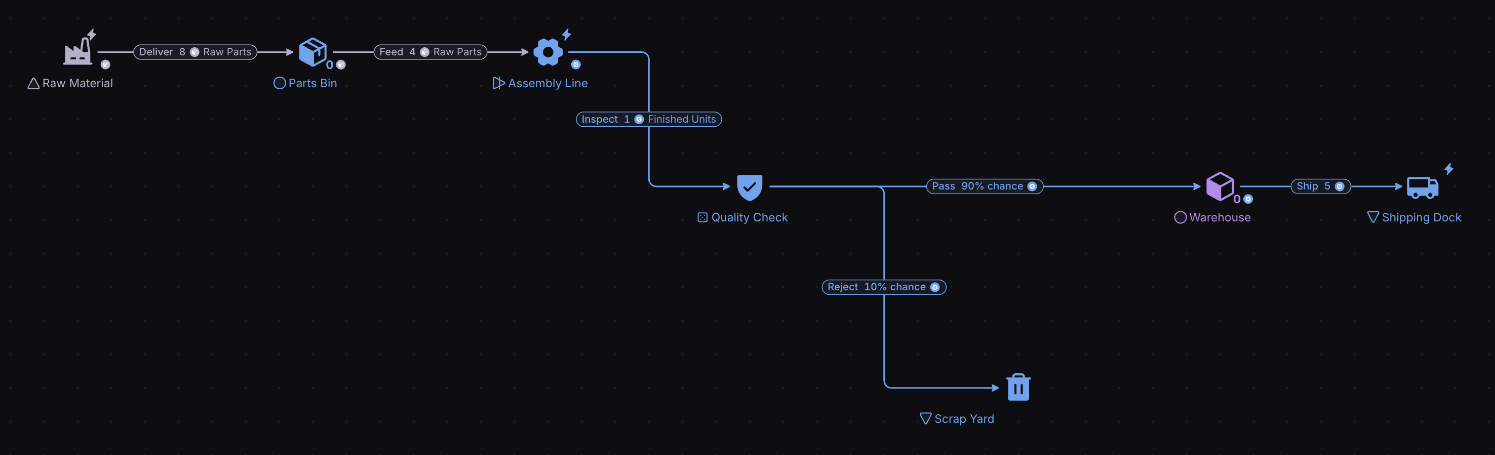
Create playable diagrams for any system, regardless of complexity. Make feedback loops and economies easier to validate, communicate and understand.
Predict
Gain data-driven insights by employing out-of-the-box Monte Carlo simulations. Test what-if scenarios and measure their impact in a safe, virtual environment, with one click of the button.
Balance
Move the Levers of a model, Forecast what each change does and compare the Outcomes of every Scenario, so a system is balanced on evidence rather than trial and error.
What you can do with it
Production flow
Model how materials, components and products move through production to find bottlenecks and shorten cycle times.
Inventory management
Simulate stock of raw materials, work in progress and finished goods against storage cost and delivery times.
Resource allocation
Simulate manpower, machinery and capacity to meet production targets at the lowest cost.
Facility design
Test facility layouts and allow for future growth and changes in production.
Supply chain dynamics
Model suppliers, manufacturers and distributors to see how demand, lead times and order sizes change performance.
Change management
Simulate new technology, machinery updates and lean changes to ease the move to Industry 4.0.
Example: streamlining automobile assembly
This diagram is a simplified representation of the body-in-white phase in automobile manufacturing, where the core structural parts of the vehicle are made and joined.
Four parts are made in parallel: the Floor, the Side panels, the Roof and the Front and rear subassembly, which in this fictional example comes from a supplier and arrives after a shipping delay. The Floor and the Front and rear subassembly join into an Under body, the Under body, Side panels and Roof join into a Main body, and Main bodies are completed as Finished frames.
Each part is made at its own workstations. The more workstations a part has, the more of that part can be made at the same time. That raises a classic problem: if some parts are produced faster than others, parts that are made quickly pile up in storage, while the slowest step limits how fast Finished frames come out.
Press Play and watch the Frame Storage line in the Chart: it shows how many Finished frames the line has completed. Four Levers set the number of workstations for the Floor, the Front and rear subassembly, the Side panels and the Under body.
Move one Lever at a time while the chart runs. Adding workstations to a step that is not the bottleneck, such as the Front and rear subassembly, changes little: its parts just wait in storage. Adding workstations to the bottleneck, the step that holds everything else back, raises the number of Finished frames. This is how a model like this can be used to find the best allocation of workstations across tasks, and perhaps to cut cost by finding redundancy in the system as a whole.
Tune the line before you retool the floor
Model stations, buffers and throughput, then Play a shift change or a new machine and compare the output.
- ISO 27001 certified
- SSO & SAML
- GDPR compliant
- Trustpilot verified
- Red Herring Top 100
- Dealroom Rising Star