Healthcare systems modeling
Make the connected flows of people, capacity, staff and resources visible, to help a multidisciplinary team explore operational assumptions and discuss possible changes.
Trusted by Healthcare Providers around the World



Revolutionize the planning, optimization, and innovation of healthcare systems and processes
Design
Create playable diagrams for any system, regardless of complexity. Make feedback loops and economies easier to validate, communicate and understand.
Predict
Gain data-driven insights by employing out-of-the-box Monte Carlo simulations. Test what-if scenarios and measure their impact in a safe, virtual environment, with one click of the button.
Balance
Move the Levers of a model, Forecast what each change does and compare the Outcomes of every Scenario, so a system is balanced on evidence rather than trial and error.
What you can do with it
Hospital design and resource allocation
Test layouts, process flows and asset placement to raise capacity and cut waiting times.
Resource utilization and scheduling
Try staff schedules and resource allocations to see their effect on care, cost and efficiency.
Patient flow management
Anticipate bed demand and find where capacity can grow to shorten waits.
Personalized dosages
Model individual absorption rates to work out dosages and reduce medical complications.
Epidemic simulation
Study how a disease spreads and test mitigation strategies before a health crisis.
Pharmaceutical supply chain
Plan production and logistics to use resources well and cut waiting times.
Ripple effects: modeling transmissions and recoveries
This diagram applies the SIR (Susceptible, Infectious, Recovered) technique to predict how an infectious disease might spread.
It starts with 100,000 Susceptible people and five Infectious people. Each day, every Susceptible person has a chance of becoming Infected that depends on the transmission rate and the current number of Infectious people, and every Infectious person has a fixed chance of recovering and becoming immune. A vaccination strategy changes the transmission rate, and other measures such as quarantine can be added with relative ease. It is the same state-transition thinking behind the Markov models used in health economics and cost-effectiveness analysis.
An algebraic SIR model shows only the most likely path, the average. This diagram captures the entire spread of outcomes, including the best and worst cases, where the disease becomes endemic or dies out early. Each person is an independent agent, so one may take five days to recover and another fifty, and every Play is different. Even slight differences in transmissions or recoveries can change the result dramatically, which you can see in the Chart and in Forecast. The “Vaccines administered/day” Lever sets how many doses are given each day, so you can see how a stronger or weaker vaccination effort changes the number of Infectious people.
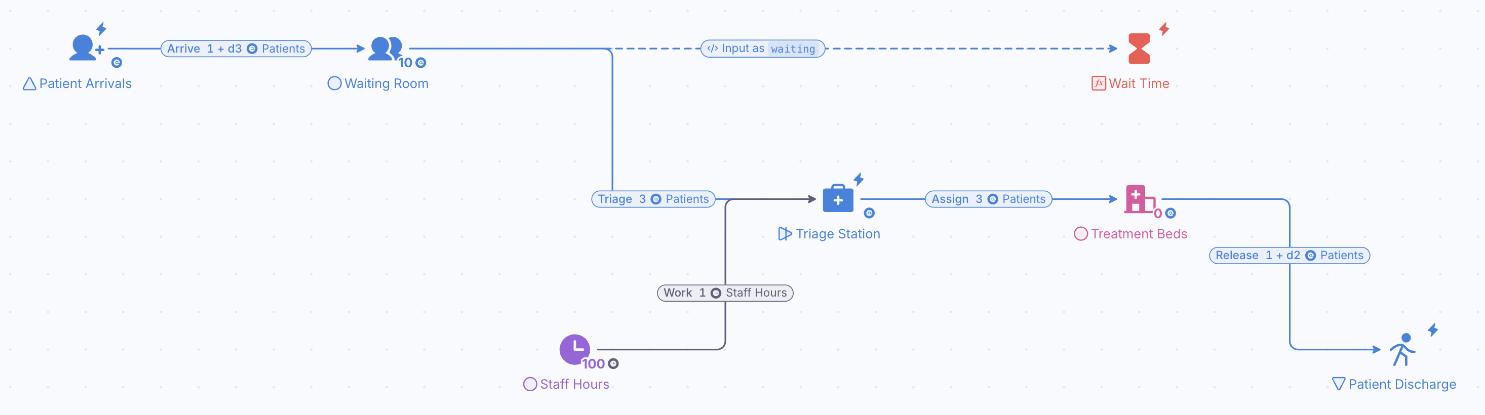
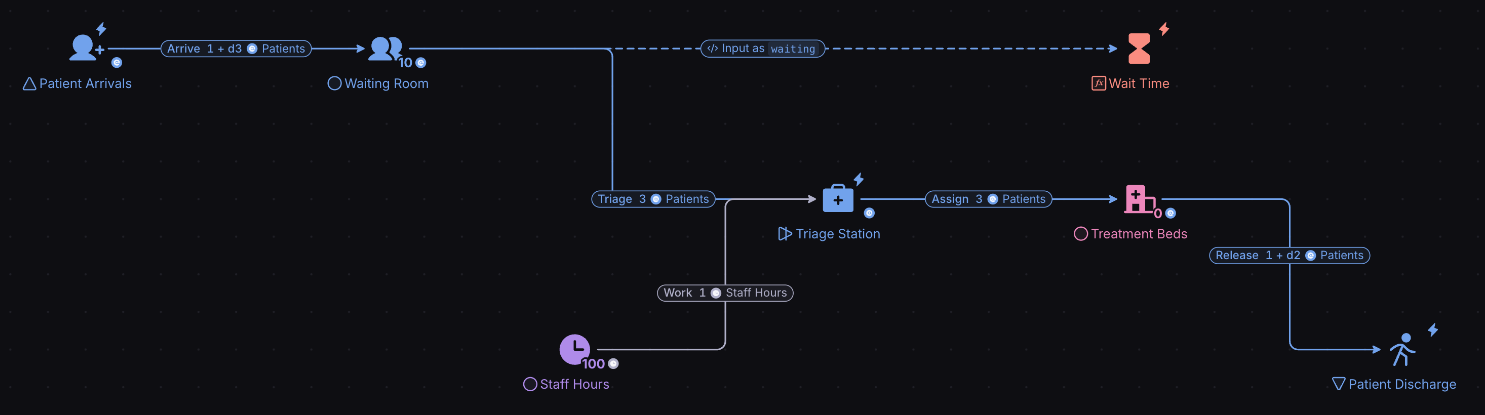
See where patients wait before you add beds
Model admissions, staff and capacity, then Play a busy winter and compare how each plan keeps care moving.
- ISO 27001 certified
- SSO & SAML
- GDPR compliant
- Trustpilot verified
- Red Herring Top 100
- Dealroom Rising Star