iGaming economy and incentive modeling
A shared diagram lets teams inspect how player behavior, incentives, probability rules and operational constraints interact, and where the assumptions need review.
Trusted by Professionals within the iGaming Industry Globally



Design, predict, and balance cutting-edge gaming systems with precision. Embrace the potential of intelligent modeling for a forward-thinking approach in the dynamic landscape of iGaming.
Design
Create playable diagrams for any system, regardless of complexity. Make feedback loops and economies easier to validate, communicate and understand.
Predict
Gain data-driven insights by employing out-of-the-box Monte Carlo simulations. Test what-if scenarios and measure their impact in a safe, virtual environment, with one click of the button.
Balance
Move the Levers of a model, Forecast what each change does and compare the Outcomes of every Scenario, so a system is balanced on evidence rather than trial and error.
What you can do with it
Player engagement
Model how game design, rewards and pacing shape engagement in casino games.
Payouts and probabilities
Simulate the payout structure and odds of each game to see its financial dynamics and risk.
Monetization
Simulate microtransactions, in-app purchases and other revenue streams against player satisfaction.
Retention
Measure how loyalty programs, promotions and community features affect player retention.
Jackpots
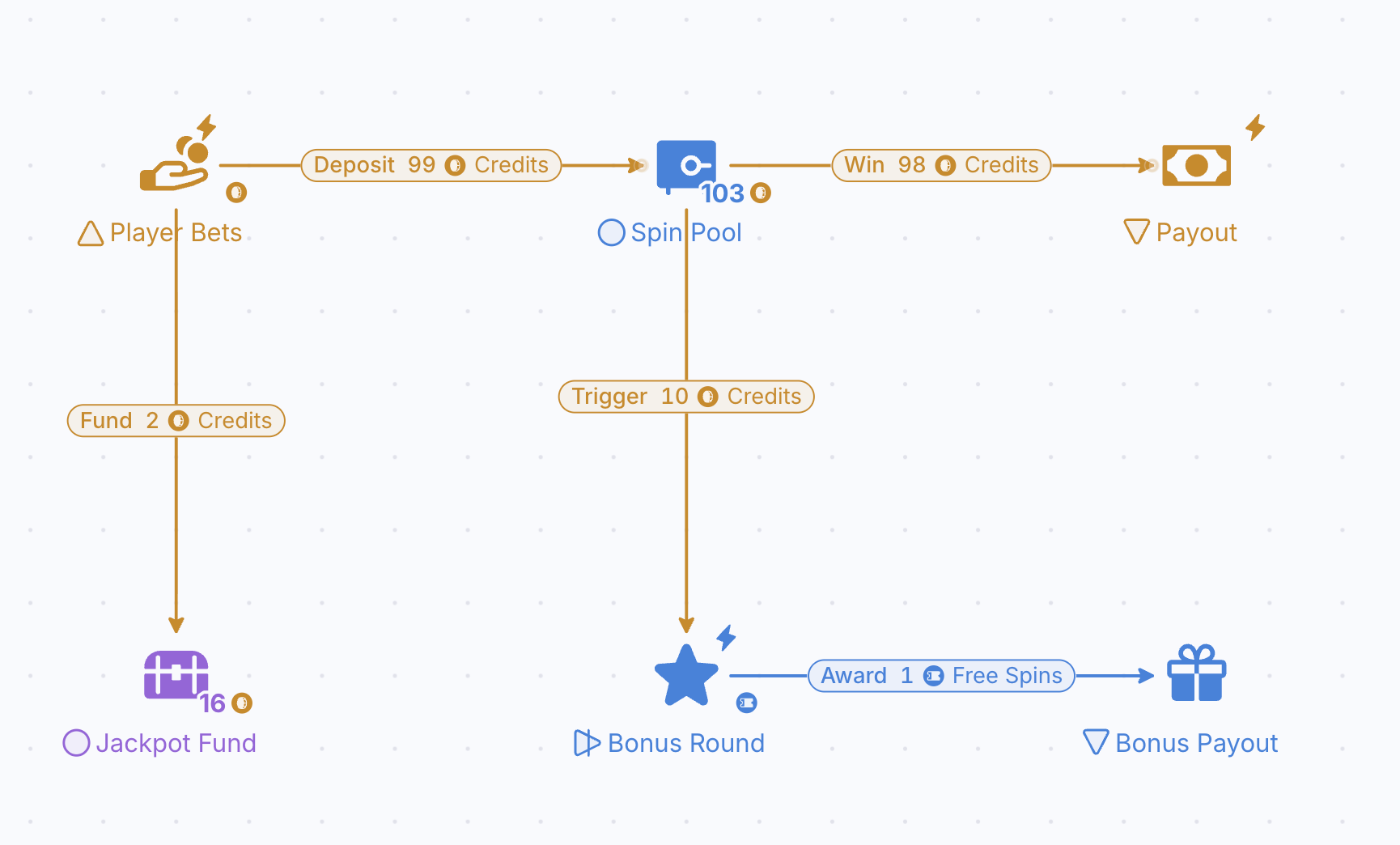
Tune contribution rates and trigger conditions of a jackpot system.
Tournaments and events
Model entry fees, prize structures and participation to keep events profitable.
Slot game engagement: a Monte Carlo exploration
This diagram models one player’s session on a slot game, virtual or land-based, from the first spin until they close the game or move to another machine.
Forecast repeats the session for many players, so you see the full range of experiences that the slot’s randomness and the player’s choices produce. Designers use it to understand engagement and session length, to fine-tune a game so it does not encourage addictive play, and to keep average revenue per user from depending on a few very high spenders.
The diagram does not draw the reels. It plots every score modifier a single spin can produce and sums the reel combinations behind each one, which is the same hit-frequency and RTP view a PAR sheet gives. With this probabilistic stand-in for the slot math, each player’s winnings can be tracked.
A player starts with funds and a stake. Each step they stake once and the model picks a win at random, with winning nothing the most likely outcome. Wins fund later spins, and a run of losses can drain the balance to zero. A player who runs out may add more money, or not.
Three conditions end a session: the player has no funds and chooses not to add more, fifteen losses in a row, or the balance reaches the target the player hoped to withdraw.
Every run comes out different. The value grows when you add player personas, such as whales who invest more and quit only when they are ahead, versus cautious players who stake a few times regardless, and when you feed in real data such as the average stake of a comparable game. Teams also use this kind of model to check volatility and RTP before a game goes to certification with a lab such as GLI, BMM or eCOGRA.
Know the house edge before the floor opens
Model payouts, bonuses and player bankrolls, then Forecast return to player and volatility across thousands of sessions.
- ISO 27001 certified
- SSO & SAML
- GDPR compliant
- Trustpilot verified
- Red Herring Top 100
- Dealroom Rising Star