Marketing system modeling
A visual model makes the assumptions about audiences, channels, offers, budgets and customer behavior easier to discuss across marketing, product and analytics.
Trusted by Marketing Agencies from around the World



Leverage data-driven insights to steer your marketing campaigns toward success, elevate brand visibility, and leave competitors in the dust.
Design
Create playable diagrams for any system, regardless of complexity. Make feedback loops and economies easier to validate, communicate and understand.
Predict
Gain data-driven insights by employing out-of-the-box Monte Carlo simulations. Test what-if scenarios and measure their impact in a safe, virtual environment, with one click of the button.
Balance
Move the Levers of a model, Forecast what each change does and compare the Outcomes of every Scenario, so a system is balanced on evidence rather than trial and error.
What you can do with it
Product launch
Simulate launch strategies across distribution channels to plan for initial sales.
Conversion funnel
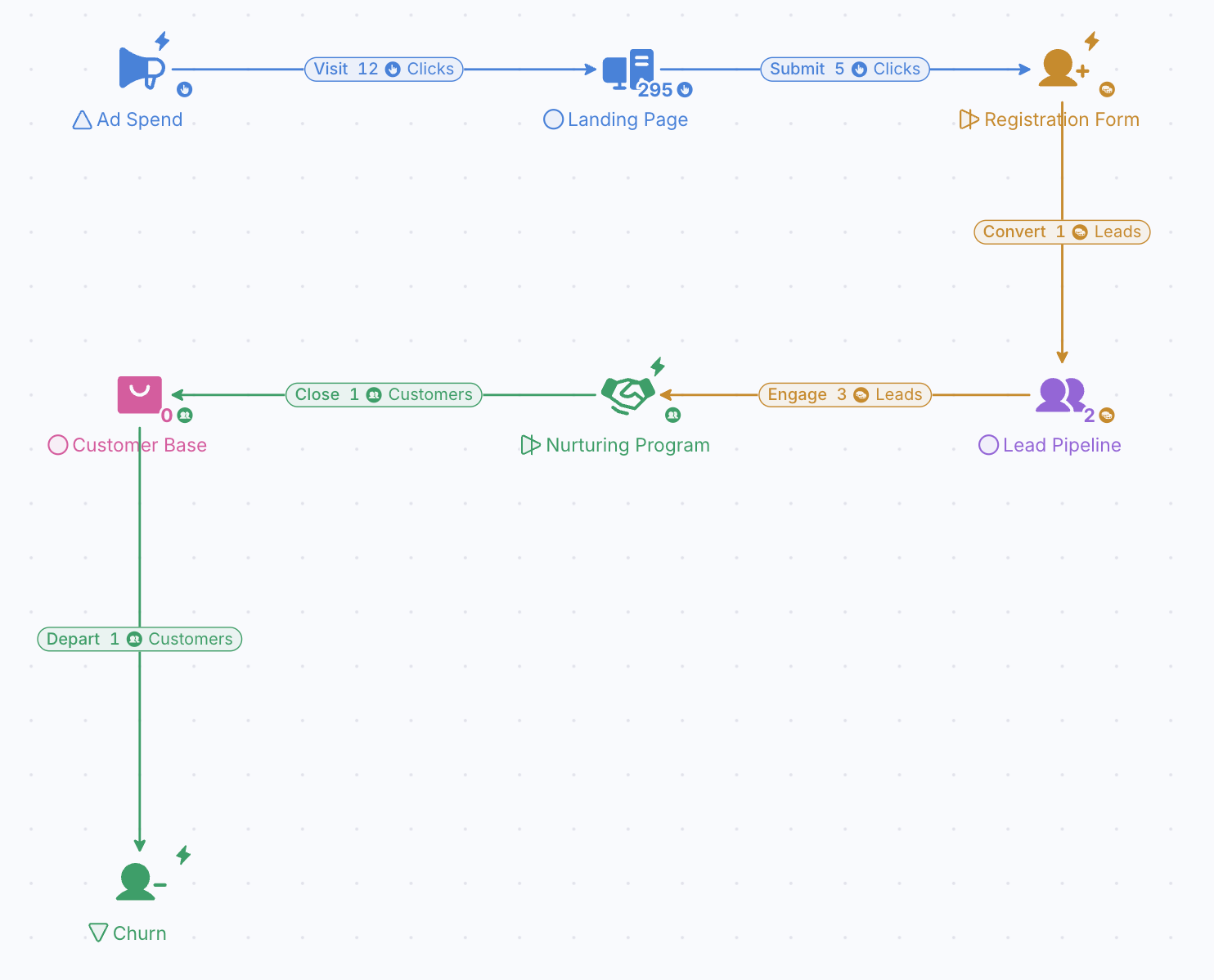
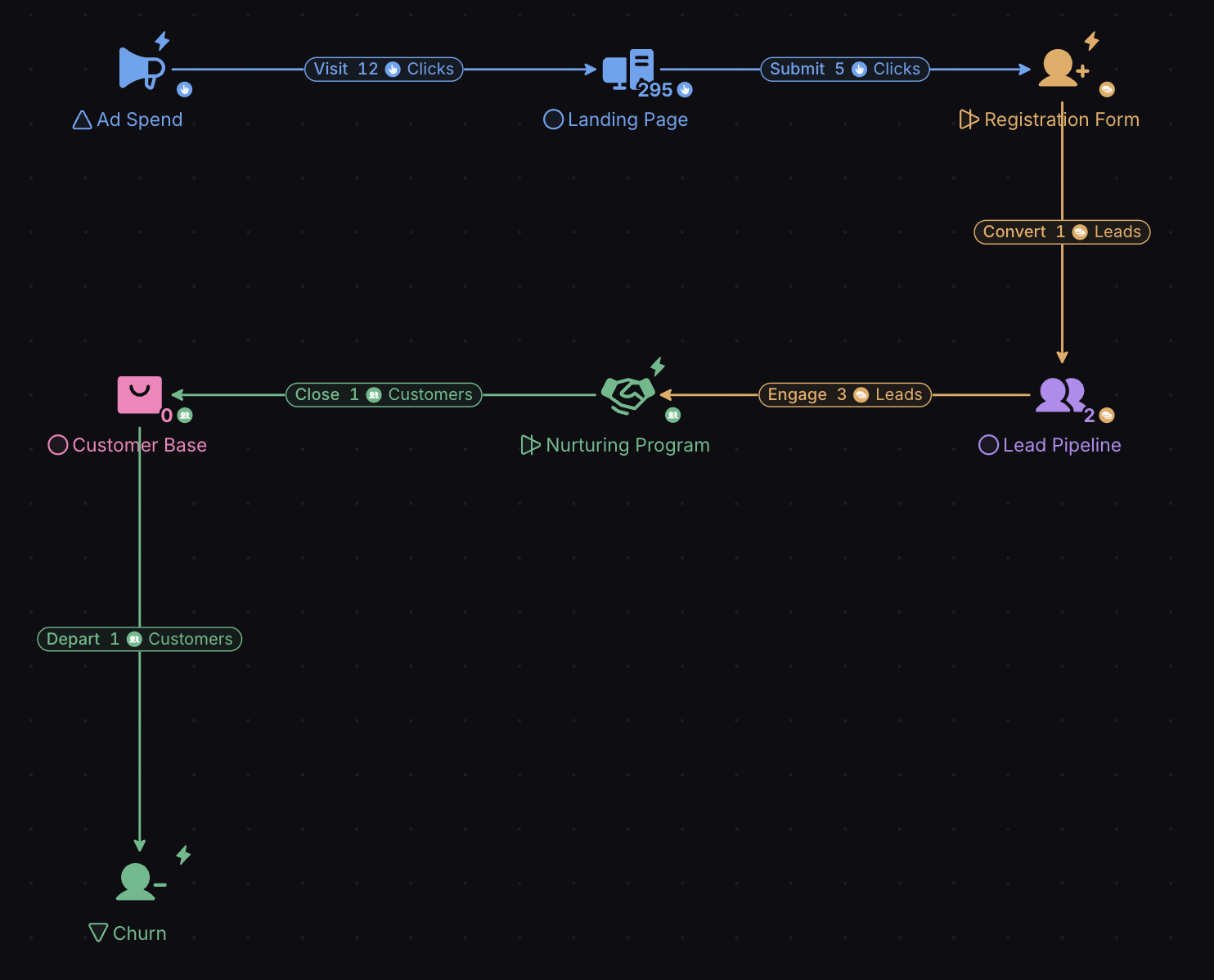
Model the customer journey from awareness to conversion and find the stage that loses people.
Advertising spend
Model PPC, display and social spend by ROI and conversion rate to put budget where it returns most.
Customer lifetime value
Forecast lifetime value per segment from retention, repeat purchases and order value.
Drip campaigns
Map email sequences, triggers and decision points to find bottlenecks.
Loyalty and referrals
Simulate how loyalty programs affect retention and how referrals spread.
Decoding the Customer Journey: A Conversion Funnel Model
This diagram follows customers through the conversion funnel of a web product, from the first visit to a paying account. It models three stages:
- Awareness: how people first meet the product, through web search, referrals, social media and brand recognition.
- Consideration: whether the product fits their needs, which depends on how clearly supporting content, trials and workshops communicate its value.
- Conversion: the step where prospects become customers.
Awareness comes from web searches, referrals and social media (blue). Adding up the tokens in the “Visitors each month” pool estimates monthly visitors. A sequential decision tree then models what visitors do with the product.
The first step is the click-through rate. Here 60% of prospects consider registering (green) and the other 40% are the first churned customers (red). Moving the Lever changes how many visitors become registrations instead of churn. The “Click-through rate (%)” Lever starts at 2%, the average, and you can set it to match your own campaign.
The next steps are onboarding and the trial, each with its own Lever (“Onboarding steps” and “Does the trial require card?”). Of the new accounts, 80% finish onboarding, and the length of onboarding decides it: with fewer than three steps, consideration rises by 10% because it is more efficient. 90% of prospects start a trial that needs no card, while asking for card details halves the chance that they continue. After the trial, the model assumes 20% become customers, since countless factors affect that decision. Dividing customers by churned customers gives the retention rate of the product.
Play 30 months and watch the Chart: the customer and churned-customer lines climb at different speeds. Move a Lever and the gap between them changes, so you can see which step to fix first.
Follow every dollar from spend to customer
Model channels, conversion and churn as one funnel, then Forecast what each budget split does to growth.
- ISO 27001 certified
- SSO & SAML
- GDPR compliant
- Trustpilot verified
- Red Herring Top 100
- Dealroom Rising Star