


In Machinations, indicators play a crucial role in providing immediate, visual feedback on the performance and status of your models. To use indicators effectively, you can link them to specific nodes in your diagram.
For instance, you might attach an indicator to a resource pool to track its Max value across multiple executions. The reason to utilize indicators is their ability to simplify complex data and provide at-a-glance insights. They transform raw numerical data, enabling you to quickly assess the health, efficiency, or progress of different elements within your model.
There are 4 types of indicators:
Mean Average:
The update includes a mean average display, allowing for a straightforward calculation of the arithmetic mean.
Median Average:
A median average feature is now available, which identifies the middle value in your dataset.
Minimum Value:
The minimum value display feature helps in quickly identifying the lowest point in your data.
Maximum Value:
The maximum value feature enables easy identification of the highest point in your dataset.
How to access the indicators :
- Select any Node in the Legend bar next to the Chart.
- Click on + Add Indicator located under the node name.
- Select the indicators you want to plot in the chart.
How are averages calculated?
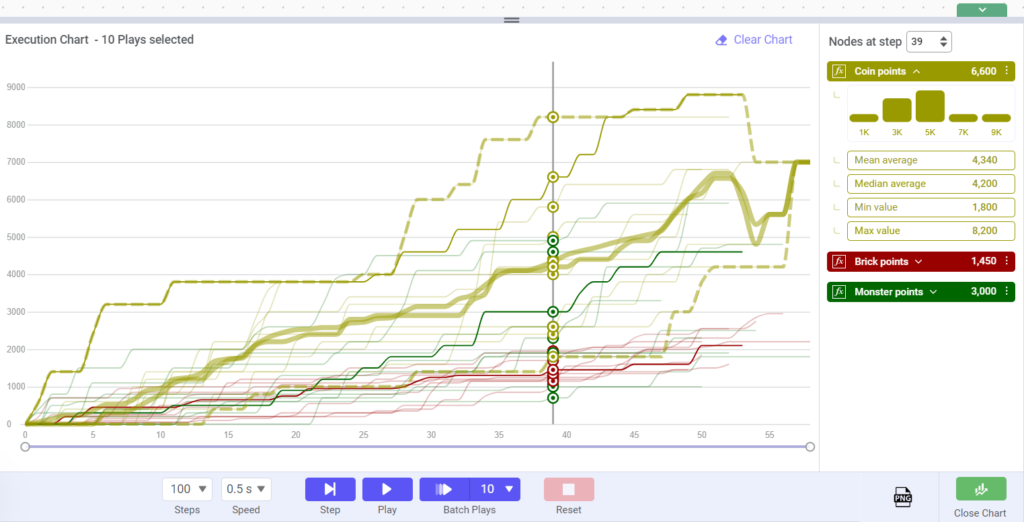
In the example above:
The Mean: represents the Mean of the plotted Node’s values at a certain Step, across all numbers of Plays executed. For the “Coin Points” Pool example, 4340 is the Mean of all values the Pool reached at Step 39, across 10 executions. The Mean is calculated as follows: the sum of all values, divided by the number of values. E.g.: The mean of a, b, c is (a+b+c)/3.
The Median: represents the median value of all values of the plotted Node, at a certain Step. For the “Coin Points” Pool example, 4200 is the median of the values the Pool has gone through at each Step 39, across the 10 Plays and may be thought of as “the middle” value of your set.
In your analysis, use the median in comparison to the mean, to check if your data set is not skewed by a small proportion of extremely large or small values. This comparison will provide a better representation of a “typical” value.
Min/Max Values: The minimum/maximum values in the data set of the analyzed Node, at the same Step of multiple executions. In the example above: the Min and Max values represent the minimum and maximum values generated by the Pool at Step 39 of each of the 10 executions.
Distribution filter:
The Distribution filter is a new feature that allows your to display the number of occurrence of values within a specific range during the execution. You can click on any of the distribution bars to filter the chart for this particular value range.
Distribution filters for each Node can be collapsed/expanded by clicking on the arrow next to the Node’s name.
- Click on the bar of the distribution range you would like to take a closer look at.
- You may reset the filter, using the “Reset Filter button at the top of the chart to reset the filter and display all values again.
Interprating the histogram:
Based on a “Loot and Craft” scenario below, let’s analyze how the distribution histogram displayed in the execution chart can be interpreted after running 100 play sessions over 50 steps.
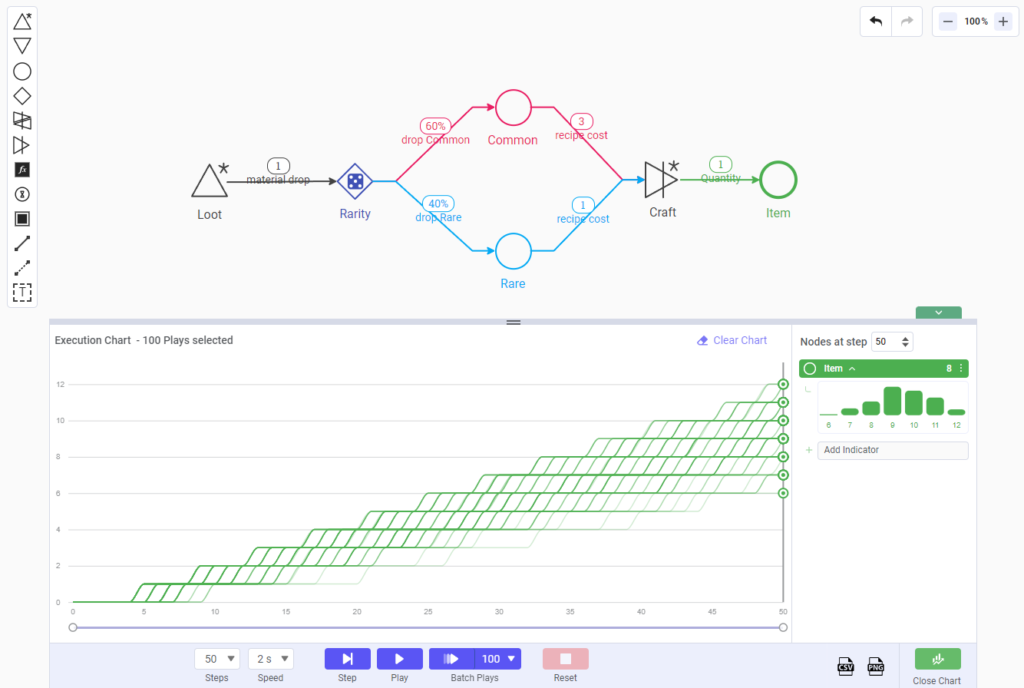
At step 50, the histogram displays a range of values for items crafted. It appears that the most frequent result is 9 items and 10 items. You can hover over the histogram to display the details:
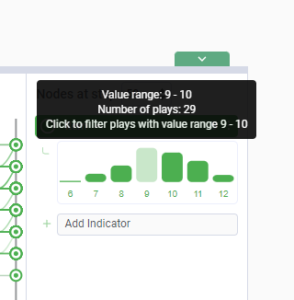
Suggesting that by the 50th step, your players have a 29% chance to have between 9 & 10 items in their inventory.
As you can see, the distribution histogram is a powerful tool for identifying the consistency and range of outcomes in a simulation. It allows the game designer to understand not only the average outcome but also the spread and variance, which are crucial for balancing the game’s crafting mechanics.
