Precision (accuracy indicator)
A Forecast plays a diagram many times. When the diagram has random parts, every Play ends a little differently, so the result of a Forecast is itself an estimate. Precision tells you how far that estimate could still move if you played the diagram more times. It describes the Plays, not how well the diagram matches reality.
What’s the difference between accuracy and precision?
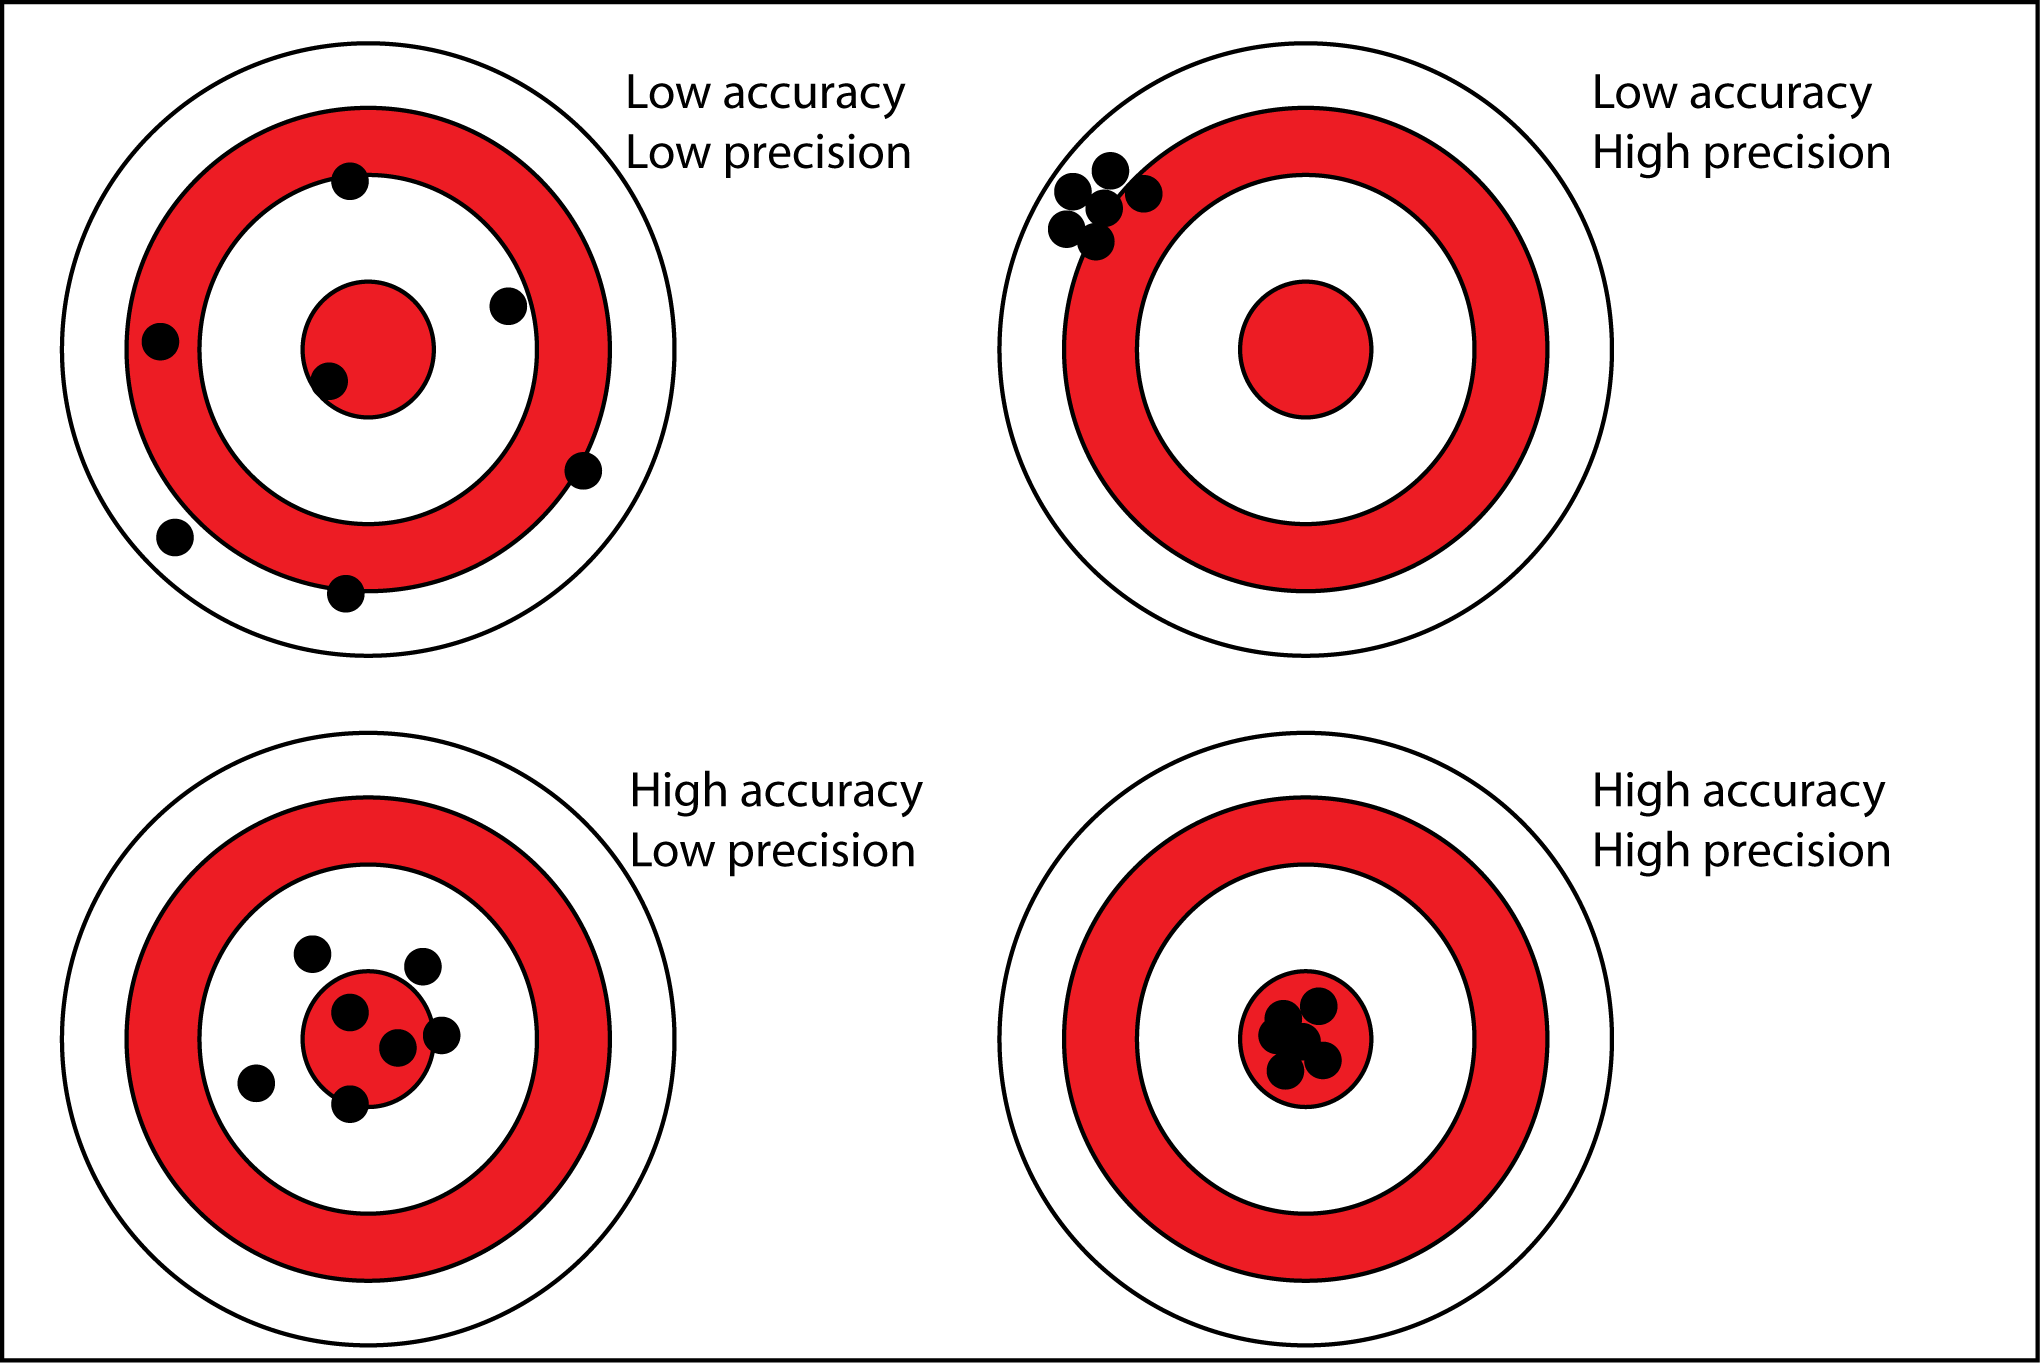
Accuracy is the degree of closeness to the true value. Precision is the degree to which an instrument or process will repeat the same value. In other words, accuracy is the degree of trueness of data, while precision is the degree of reproducibility. More details can be found here.
Examples of accuracy and precision
The most common example to show the difference between accuracy and precision is hitting the bullseye on a dartboard. If you’re simply accurate, that means you’re throwing darts that are landing close to the bullseye, but you’re not hitting the bullseye every time. If you’re simply precise, that means your darts are landing close to one another but not necessarily close to the bullseye. But when you’re accurate and precise, your darts will land in the bullseye every time—the best-case scenario.
Precision on a Forecast card
Every result card under the chart shows the precision of its node's median: the middle ending of all the Plays. It is written as a rank and a ± figure, for example Good ±4%. The ± says how far the median could be from where unlimited Plays would put it, 19 times out of 20.
- Sharp: within ±2%.
- Good: within ±5%.
- Fair: within ±10%.
- Rough: wider than ±10%.
Precision needs at least 10 Plays. With fewer, the card says how many Plays it is waiting for (for example "1 of 10 plays for precision").
The examples on this page use a small model: a Source named Mine that makes Iron, a Random Gate named Loot Roll that lets 80% of that Iron through, a Source named Gold Vein that makes Gold with a 20% chance each step, Pools named Iron and Gold (two separate resources), a Converter named Craft that turns 3 Iron and 1 Gold into 1 Item, and a Pool named Items.


After a Forecast of only 10 Plays, the Items card reads Rough ±17% and Iron Rough ±7.5: the medians could still be well off.


Getting a better rank
More Plays narrow the ±. When a better rank is in reach, the card says how big a Forecast it takes, for example "Play 10 more → Fair", or "Needs 50 plays". Choose a rank from the menu beside Forecast and the Forecast stops on its own once the result reaches it.
After 200 Plays of the same model the Items card still reads Rough ±17%, the same as after 10 Plays and still short of Good. Iron reads Rough ±33%. Gold hit 0 in 187 of the 200 Plays, so its median is 0 and reads Sharp with the note "won't move": more Plays cannot change it. The Forecast summary on the left stays Rough, because it ranks by the least precise result, which is Iron.


A rank is given only once the ± is a little inside its line (Good from ±4.5%, not ±5%), so it does not flicker as Plays are added. If added Plays widen the ± again, the card says so ("Down from Good"): that is chance, not an error, and more Plays narrow it again.
Which node sets the rank
The Play summary and the Scenarios list rank a whole Forecast by its least precise result. To rank it by one node instead, use Follow on that node's card; click × beside the name to stop following it.
What precision does not tell you
A Sharp result is a well-measured result of this diagram. It says nothing about whether the diagram's numbers, probabilities or rules match the system you are modelling. Check those against real data, and use the Monte Carlo simulations guide for how repeated Plays work.