What is Machinations?
Machinations is a browser-based systems simulation tool that helps you to design, forecast, and optimize complex systems.
From games and web3 to finance, logistics, energy, manufacturing, supply chain, healthcare, and more — if your system has resources, flows, and uncertainty, you can model it in Machinations. All that, even before writing a single line of code.
What can I do with Machinations?
Think of Machinations as your moving flowchart or mind map. Whether you are designing a game economy, a supply chain, a financial product, or teaching systems thinking, you can use Machinations to:
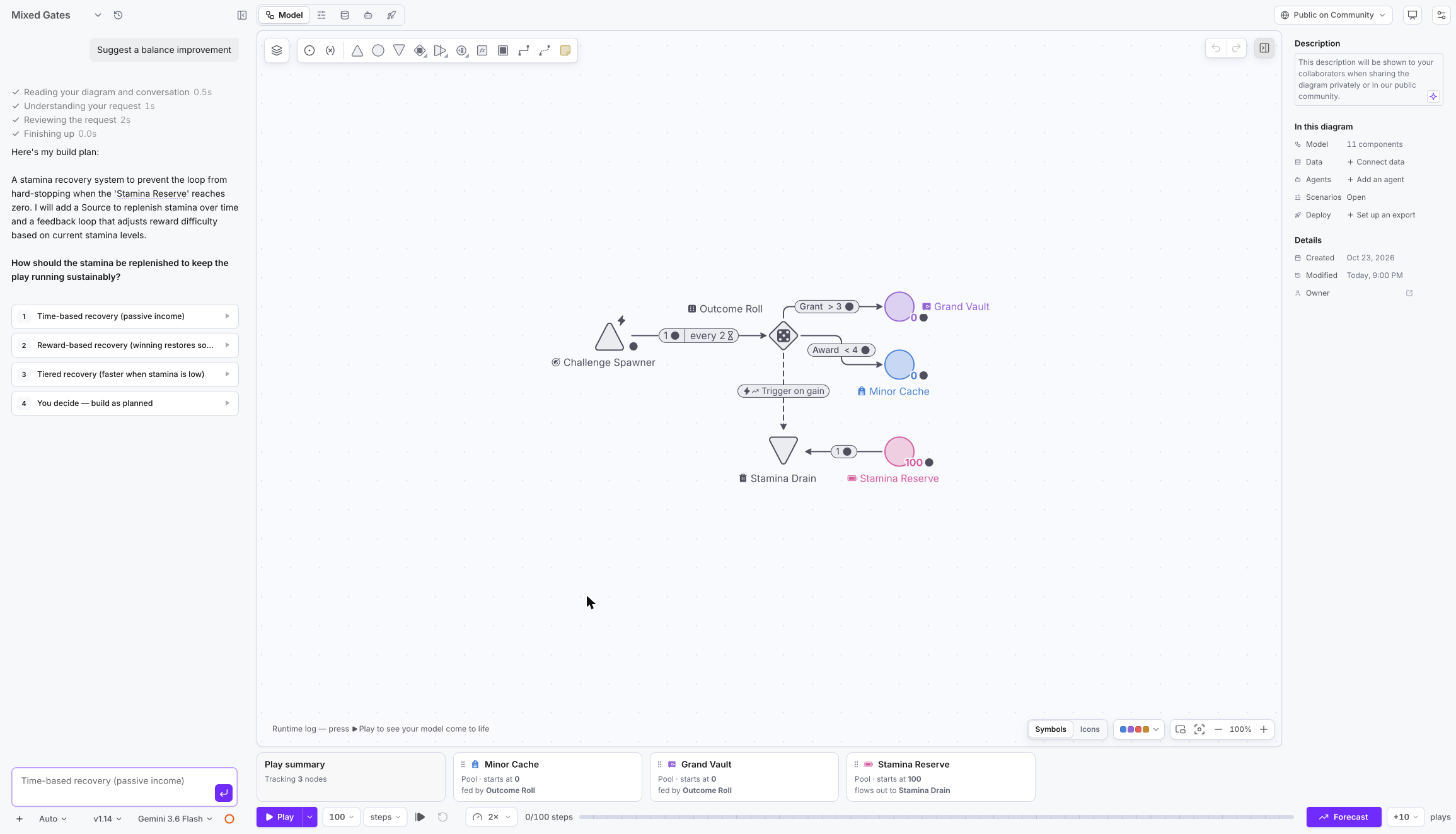
- Map systems in an interactive diagram
- Set parameters that define resource flows
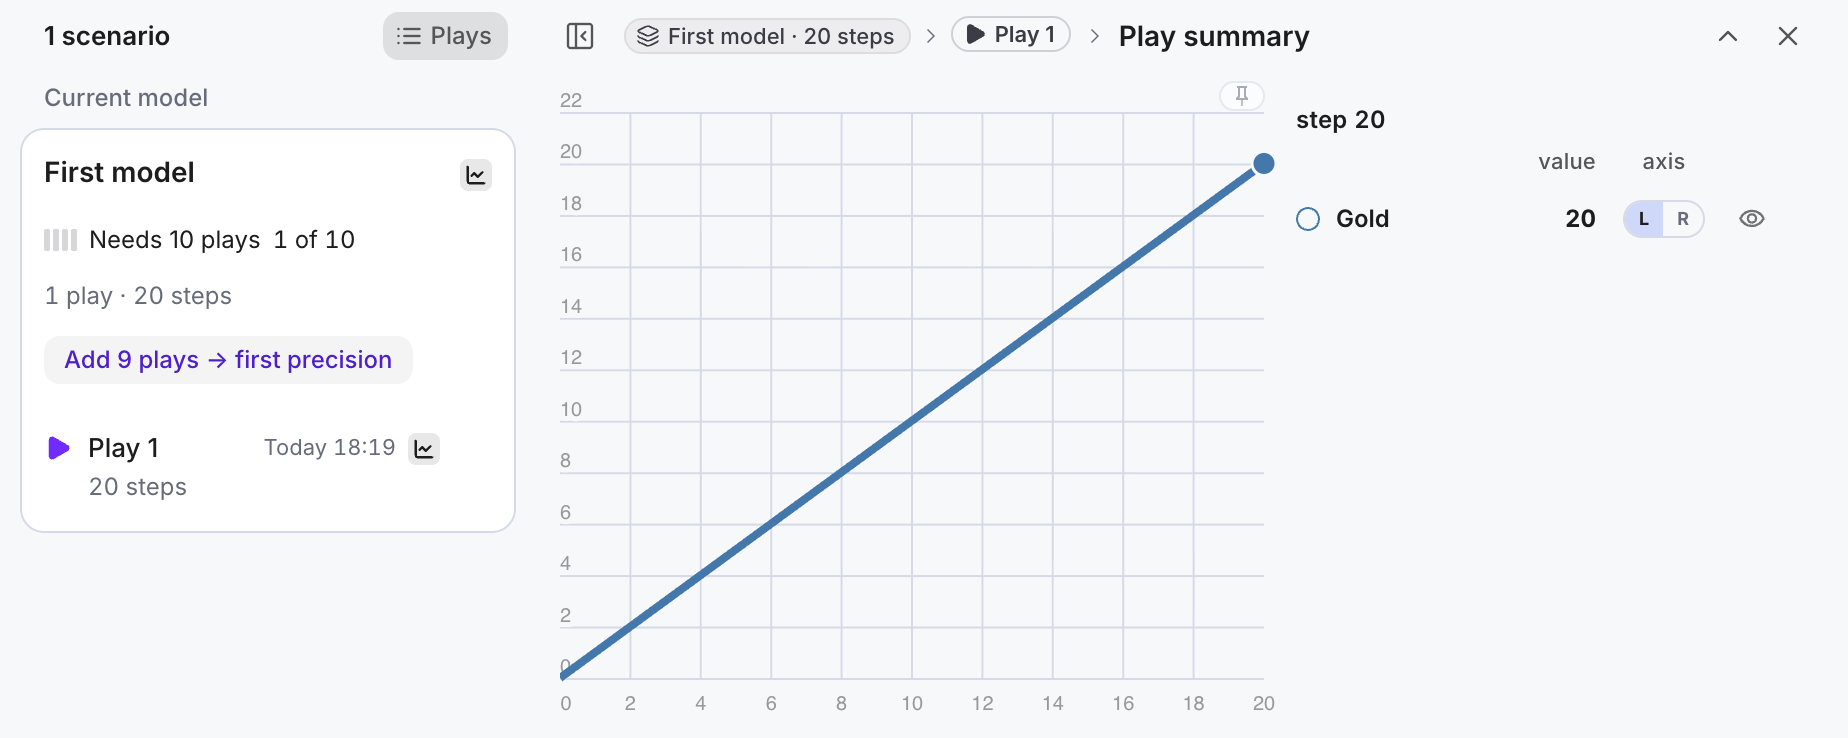
- Plot and analyze these results in the chart in real time
- Simulate outcomes for one journey (Play) or stochastically (Forecasts)
- Export simulation outcomes in CSV
- Export design parameters to Google Sheets
- Compare scenarios by moving Levers and watching the Outcomes of each Forecast
Who uses Machinations?
- Economists exploring resource flows, incentives and feedback across an economy.
- Tokenomics experts modeling supply, vesting, utility and participation in token systems.
- Game economists designing currencies, progression, rewards and resource sinks.
- Analysts and decision-makers comparing scenarios and making assumptions visible.
- Educators and researchers teaching and investigating how complex systems behave.
- Designers and developers working together on the rules behind a system.
What sets Machinations apart?
Use AI where it helps
The AI Agent turns prompts into diagrams and helps evolve models. Start from a description of an economy, process, or loop and iterate visually instead of from a blank canvas.
Agents play a model for you. An Agent is a persona with traits and assets that fires the nodes you choose, and the AI assistant can configure one from your diagram. In Scenarios you move Levers, run a Forecast and compare the Outcomes of each version side by side.
Explore a range of outcomes
A visible model helps teams compare how different assumptions change a system’s behavior.
Machinations diagrams connect resources, rules and feedback. Forecast can repeat a model under varied conditions so you can inspect the range of outcomes and find assumptions to validate before making a change. Monte Carlo Forecasts, which Play a model many times, run on Machinations’ cloud servers.
Give teams a shared model
Machinations uses a shared visual framework for resource flows and system dynamics. Diagrams are dynamic: you can instantly see how a design behaves. Anyone on the task gets a clear view of the end goal.
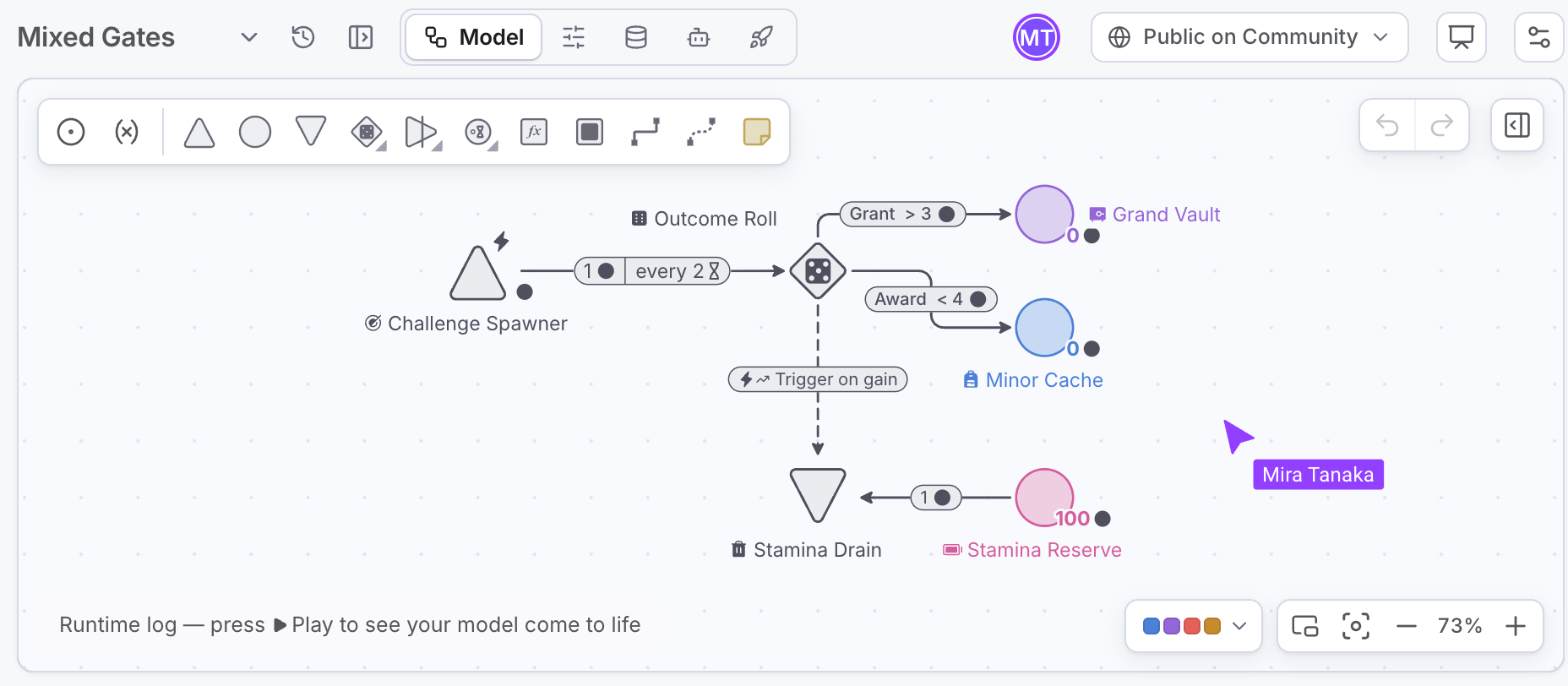
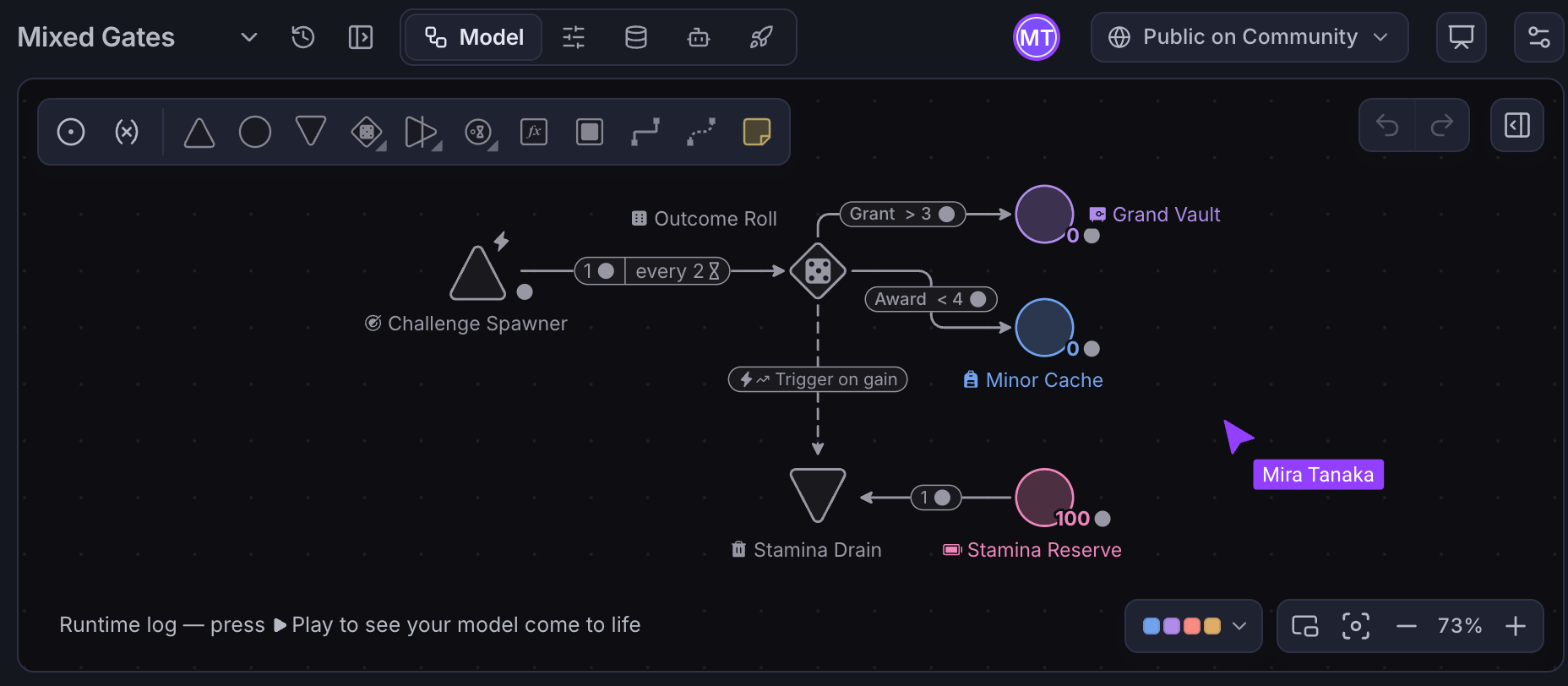
Learn a visual language of nine symbols and two connections. Master it, and you can unlock the inner dynamics of systems. Create your vision in Machinations, then predict and balance outcomes. It starts as a diagram — the blueprint of your system — but once you hit Play, it comes to life.
Explore scenarios before release
Stress-test what-if scenarios in a safe, virtual environment — before you commit budget, code, or live operations.
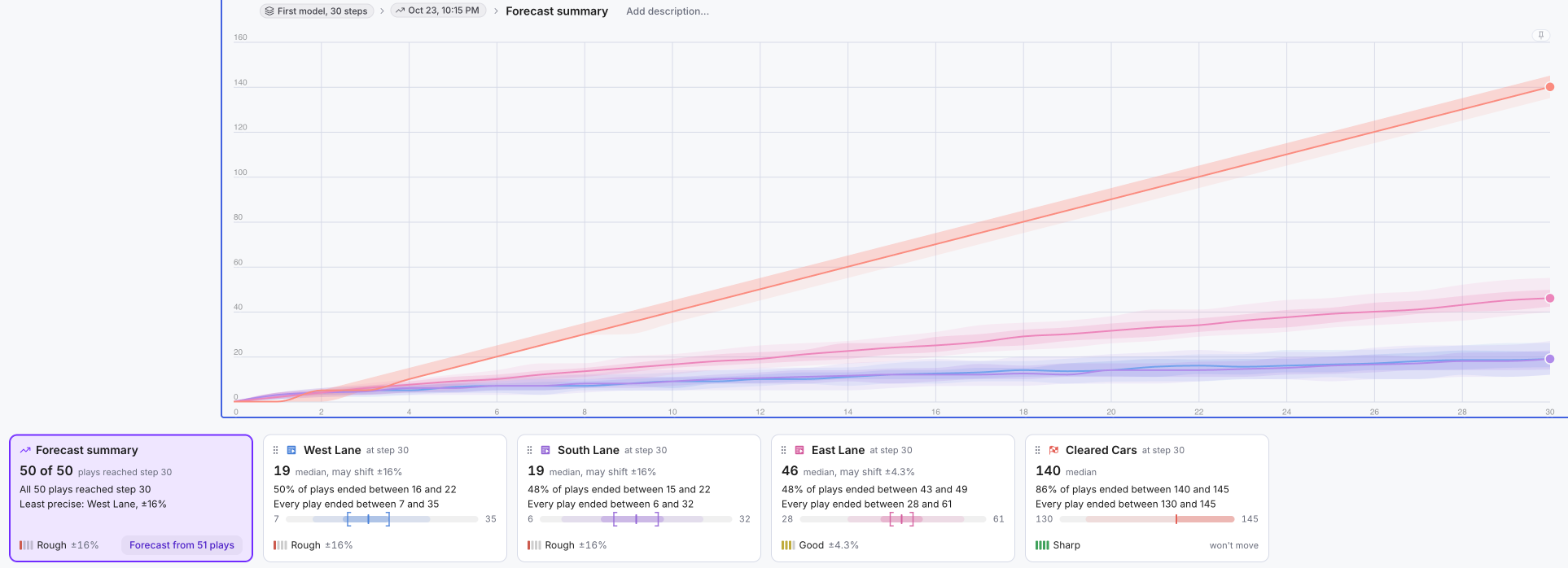
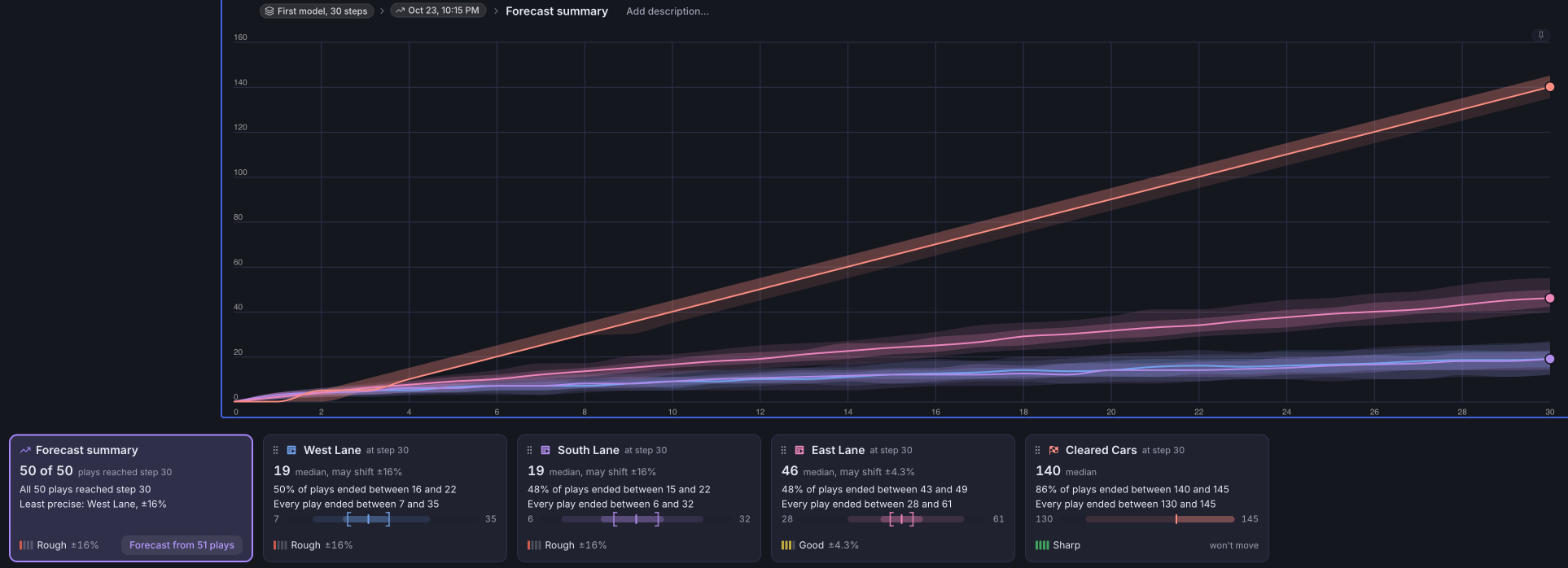
Change parameters and run a single journey with Play, or many stochastic runs at once with Forecast. Charts, precision ranks, histograms, and scenario comparison show distributions, not guesswork: where the system holds, where it breaks, and which levers actually matter. Catch bottlenecks, fragile feedback loops, and bad ranges while changes are still cheap — so teams debate evidence, not opinions, before anything ships to the real world.
Your first diagram
Are you curious to try it out yourself? We recommend starting with our hands-on tutorials for our systems simulation tool:
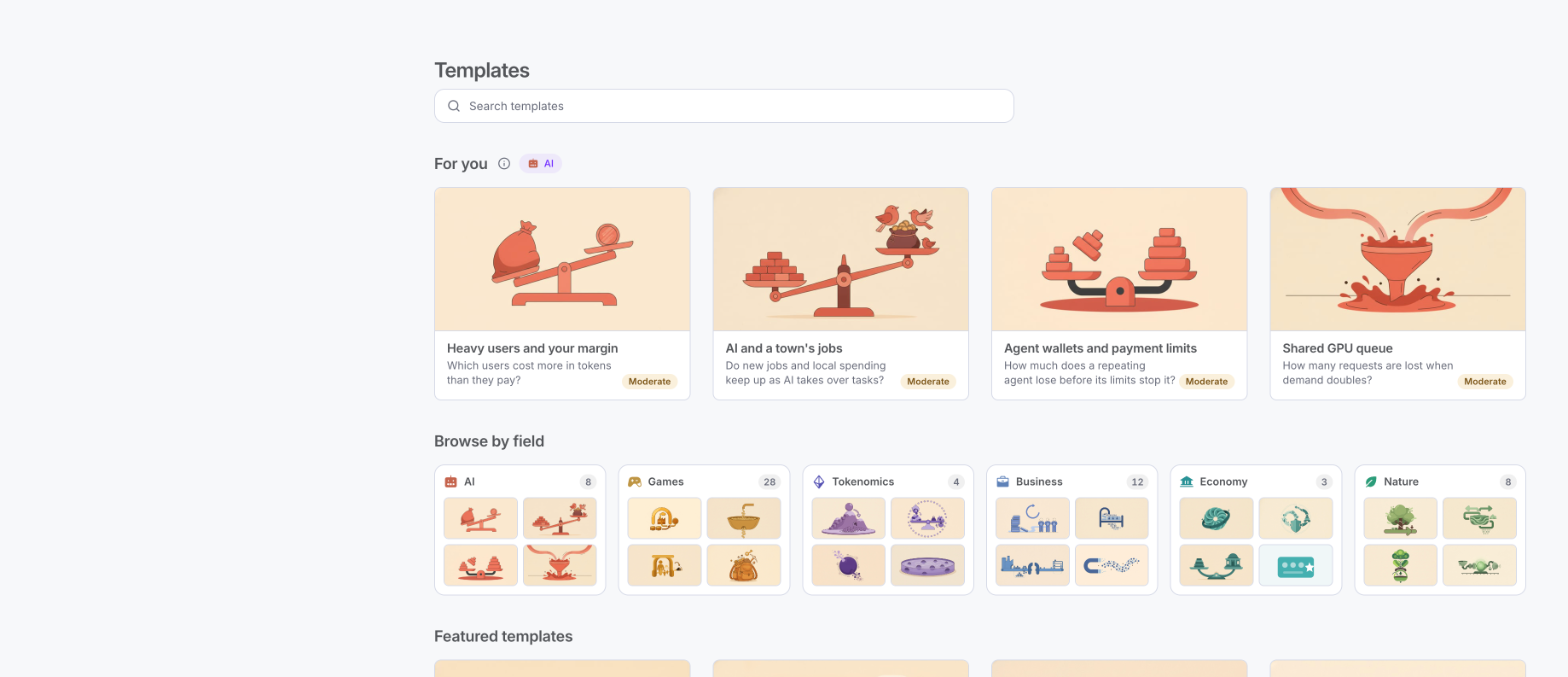
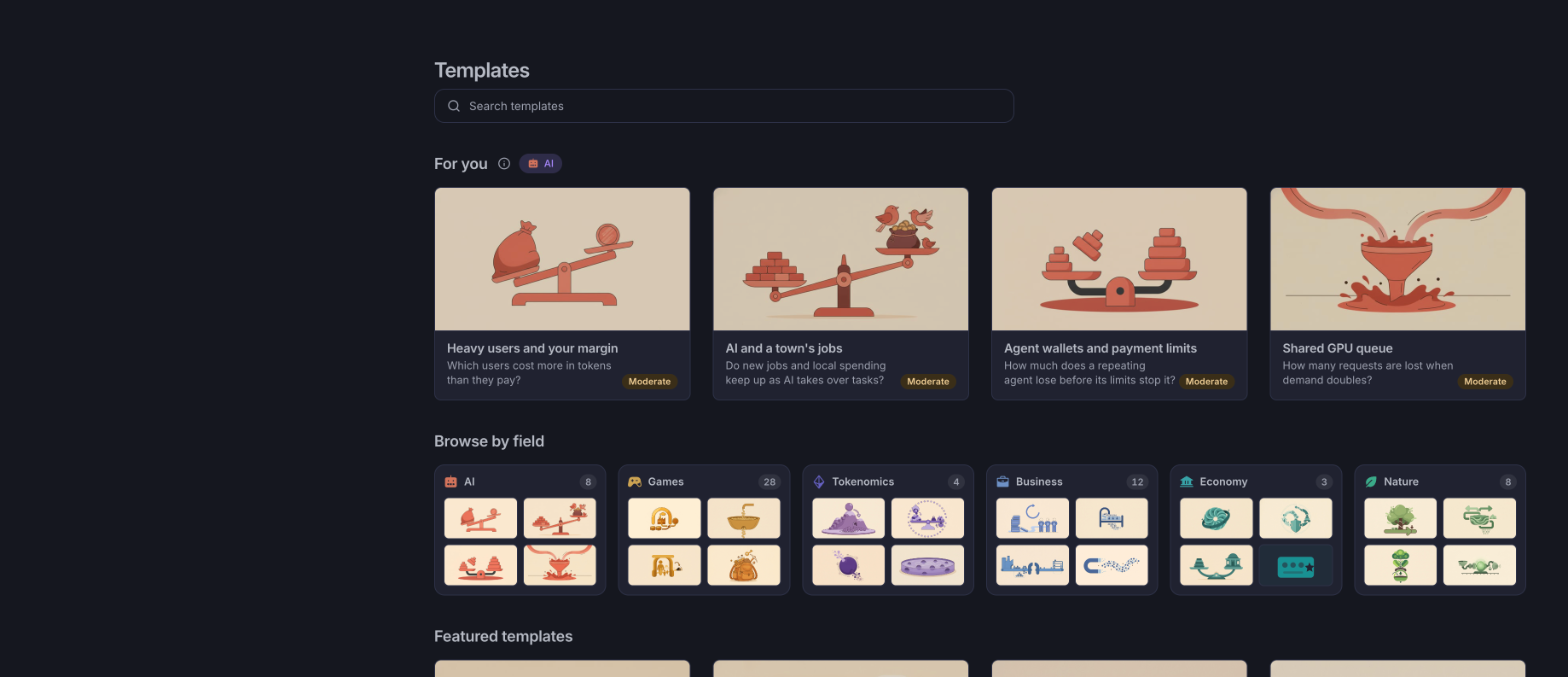
Also, you can access an extensive library of examples directly in the app by creating an account on the Register Page. Here you can find embedable building blocks that can be used as puzzle pieces for your complex projects. Press Templates in the left rail to open the library: suggestions under For you, then the fields to browse by.
Explore models with Play and Forecast
Once you understand Nodes and Connections, use Play to inspect a single journey and Forecast to compare possible outcomes across repeated Plays.