


In this article
- Play: Real-Time Interaction and Debugging
- Predict: Comprehensive Analysis Through Monte Carlo Simulations
- Why The Number of Plays in Predict Matters: A Hands-On Example
- Main takeaway
In Machinations, the “Play” and “Predict” features offer distinct ways to simulate and analyse systems. “Play” executes the model once, displaying animations for the state changes the model goes through at each step. “Predict” performs multiple Plays. The scope of performing a Predict is to produce a range of likely outcomes that can be used to inform your decision-making process when dealing with uncertain events or inherently random systems.
Play: Real-Time Interaction and Debugging
Play mode allows you to simulate the interactions within your system in real-time.
Interactive Nodes and Real-Time Changes
During Play, you can interact with the elements in your model, be them parameters or interactive nodes, and immediately observe the effects on the system.
Debugging Capability
Play mode includes a debugger feature that highlights any errors during execution. This makes identifying and fixing issues on the spot easier, ensuring that your system logic is sound and works as expected.
Immediate Feedback & Animation
Since the simulation runs in real-time and the resource flow is animated, you can visually track and get instant feedback on how different elements of your system interact with each other. This immediacy is invaluable for iterative design and quick adjustments.
Predict: Comprehensive Analysis Through Monte Carlo Simulations
A Prediction includes a customisable, pre-set number of Plays. For each random variable in your model, it uses the Monte Carlo method to produce possible values. As such, each Play in a Predict uses different sets of values. The results enable you to analyse the impact and likelihood of certain outcomes.
Instant, Server-Side Computation
Predictions are performed server-side. This means you can run complex and resource-intensive simulations without worrying about the limitations of your browser. It also means you can work on something else while the execution is performed – the app will notify you when the results are ready.
Multiple Executions
Predict doesn’t just run your model once; it executes the scenario multiple times. This is crucial as it allows you to see a wide range of possible outcomes, offering a more comprehensive view of your system’s behaviour.
Simulation Accuracy
The results of the Prediction include an indicator of accuracy. This metric tells you if you’ve conducted enough runs to get reliable, replicable results. The more executions you run, the closer you get to understanding the true behaviour of your system.
Distribution Histogram & Filter
In the chart, you can visualize the number of occurrences of values within specific ranges during execution. This is displayed as a histogram for each node plotted in the chart. Each bar in the histogram acts as a filter; when clicked, it isolates the instances where the node’s values fall within the selected range.
Saved
As opposed to Plays, which are ephemeral, Predictions are saved in Play History, cross-sessions and cross-accounts, so when you’re sharing a model with your peers, it will include the results of any predictions performed.
Why The Number of Plays in Predict Matters: A Hands-On Example
The concept of running multiple executions is rooted in the law of large numbers, a fundamental principle in probability. As the number of trials increases, the average of the results becomes more stable and closer to the expected value. In the context of system design, this means you get a more accurate and reliable picture of how your system will perform under various conditions.
The purpose of the model below to answer the following question:
What are the chances a company will achieve positive cash flow within 36 months, given it incurs monthly expenses of $4,000 and generates a monthly recurring revenue (MRR) between $100 and $350?
The company starts off with $50,000 in the bank and has no existing customers.
Each month, users buy monthly subscription amounting to $100 and add-ons that can add-up to anything between $1 and $250.
If the money in the bank equals or goes below $10,000, the company has to declare bankruptcy.
The model is set to run for 36 steps, each step represents 1 month.
If you hit the Play button directly in the embed above, you can visualise how the system behaves at each step, following the tokens’ animations. Open the Chart to visualise the monthly progression of:
- $ in Bank
- Total MRR (monthly recurring revenue)
- NewMRR added in the current month
- The number of months lapsed
A 1-Play Prediction
There are 2 main differences between performing a 1-Play prediction and using Play: the results will be shown in the chart almost instantly, however, the animations will not be played.
The 1-Play prediction will show one outcome of all possible ones. In this particular case, the company will go bankrupt in 17 months.
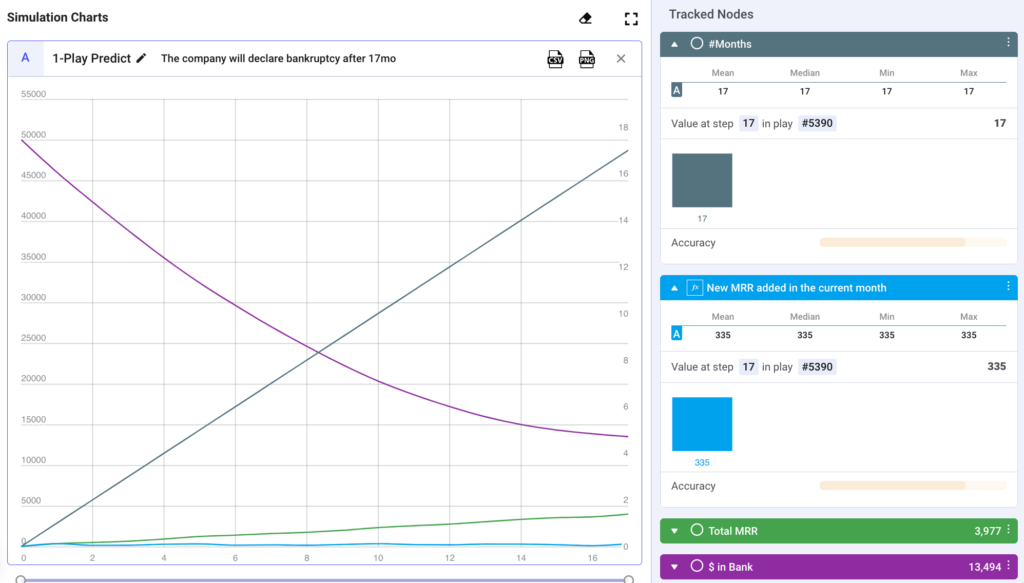
In the screenshot above, notice the Accuracy bar is not active. One play is not enough to calculate the reproducibility of results.
10-Play Prediction vs 100-Play Prediction
Let’s run a 10-Play prediction and a 100-Play prediction and compare the results. Machinations allows you to compare the results of 2 Predictions, by simply selecting & adding them to the Chart widget from the Play History sidebar.
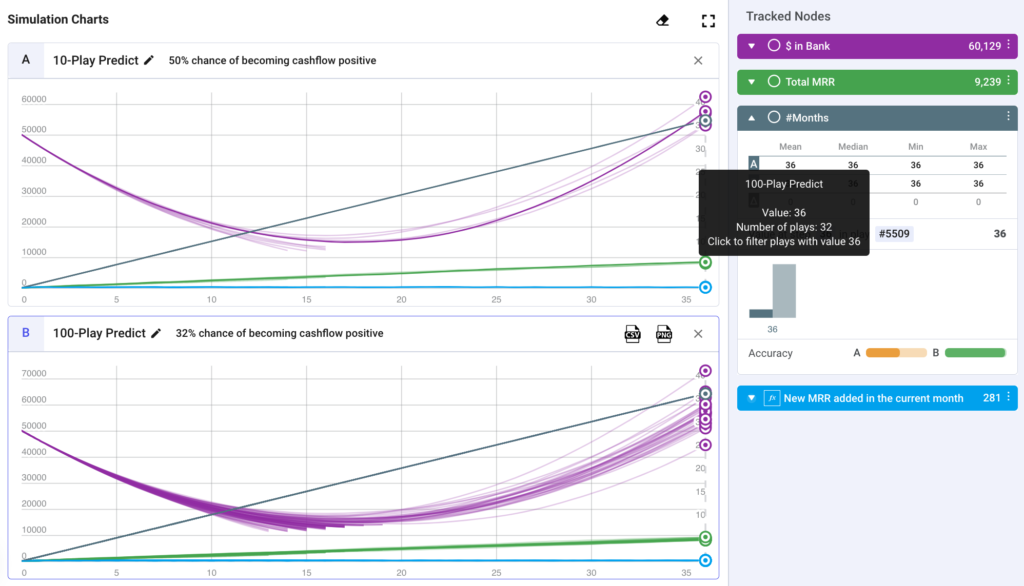
Looking at the charts we can see that there are some scenarios in which the company does become cashflow positive. For some of the Plays in each prediction there are occurrences in which the purple line plotted ($ in Bank) shows a healthy growth pattern.
To answer the initial question “what are the chances it will achieve positive cash flow within 36 months?” we need to hover over the bar chart on the right for #Month:
- For the 10-Play Predict, the company lasted for 36 months in 5 out of 10 Plays. so in 50% of the simulations
- For the 100-Play Predict, the company lasted for 36 months in 32 out of 100 Plays. so in 32% of the simulations
The main thing to notice here is the Accuracy bars for each Prediction. For the 10-Play Predict (A), the bar is orange, which means the result isn’t reliable and can’t always be reproduced. To get more dependable results, you need to Predict with more Plays. This is backed up by the result of the 100-Play Predict (B), which shows a lower success rate.
For example, if you run another 10-Play Predict, the result will probably be different from what’s shown in the chart above. In one test, the company hit its goal in only 1 out of 10 Plays. On the other hand, running a 500-Play Predict showed success in 157 Plays (31.4%), which is consistent with the results for the 100-Play Predict performed.
The benefits of Multiple Executions when using Predict
- Uncovers Hidden Patterns: Running many simulations can reveal patterns and trends that might not be apparent from a single playthrough.
- Accounts for Randomness: It helps in understanding how random events influence the behaviour of your system, ensuring that your design is robust against various scenarios.
- Informed Decision-Making: With a clear, data-backed understanding of potential outcomes, you can make better-informed design decisions.
Main takeaway
In summary, both Play and Predict in Machinations are essential tools for system designers. Play is perfect for real-time interaction, immediate feedback, and debugging, making it ideal for the early stages of system design and rapid prototyping. Predict, with its Monte Carlo simulations and multiple executions, provides a deep and accurate analysis, crucial for fine-tuning and ensuring the robustness of systems. Understanding when and how to use each mode will greatly enhance your ability to create balanced systems.
