


Unlike static flowcharts, modern user flow diagrams need to capture complex interactions, multiple pathways, and variable outcomes.
What is a User Flow Diagram?
A user flow diagram is a visual representation of the path users take through a system, application, or process.
These diagrams help teams understand user behavior, optimize conversion paths, and identify potential bottlenecks in the user journey.
When Should You Create a User Flow Diagram?
Create a user flow diagram when you need to:
- Design or optimize user acquisition strategies
- Analyze conversion funnels and identify drop-off points
- Map customer journeys across multiple channels
- Plan and test new user pathways
- Optimize existing user experiences
- Validate business processes from a user perspective
User Flow Diagram Examples Created with Machinations
1. Multi-Channel User Acquisition Flow
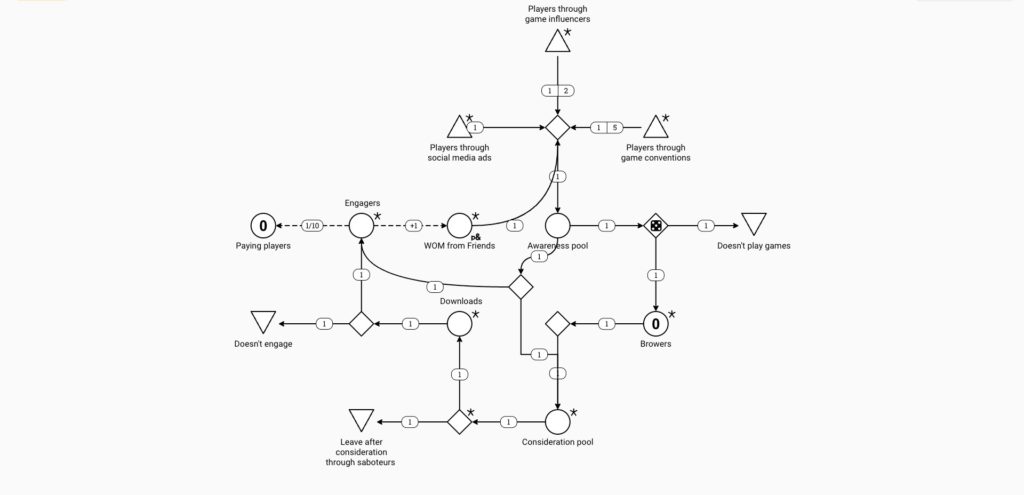
Interact with this diagram: Customer Acqusition Diagram
This diagram created using Machinations demonstrates how users enter and move through a system via different acquisition channels.
It shows the flow of users from various entry points (game influencers, social media ads, and game conventions) through different engagement stages.
The diagram effectively captures the complexity of modern user acquisition, including:
- Multiple entry points and their relative effectiveness
- User progression through awareness and consideration stages
- Different engagement paths and outcomes
- Drop-off points and retention measurements
- Word-of-mouth dynamics through existing users
2. Conversion Funnel Optimization Flow
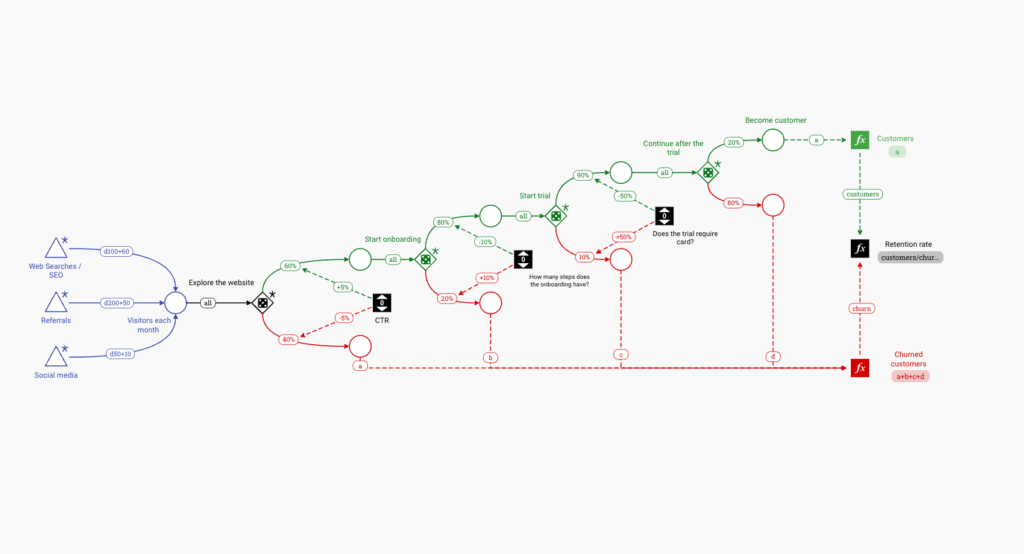
Interact with this diagram: Conversion Funnel Optimization Flow
This comprehensive conversion funnel visualization shows the complete journey from initial contact to customer retention.
Key features of this diagram include:
- Multiple traffic sources (Web Searches/SEO, Referrals, Social Media)
- Detailed conversion stages with specific success rates
- Critical decision points in the user journey
- Churn tracking and retention measurement
- Clear visualization of success metrics at each stage
3. Customer Ordering Process Flow
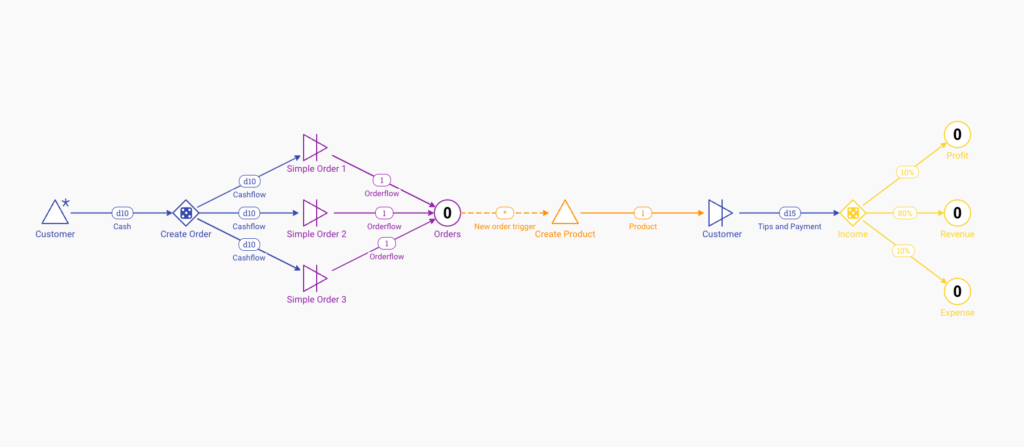
Interact with this diagram: Customer Ordering Model
This streamlined ordering process flow shows how customers move through a transaction system.
The diagram illustrates:
- Clear order creation and processing steps
- Multiple order type handling
- Resource flow tracking (cash, products)
- Revenue and expense distribution
- Customer satisfaction checkpoints (tips)
What Other User Flow Diagrams Can You Create Using Machinations?
Machinations is versatile for creating various user flow diagrams, including:
- User onboarding processes
- Authentication flows
- Feature discovery journeys
- Subscription management flows
- App navigation flows
- Payment processing flows
- User feedback loops
- Social interaction flows
- Content consumption paths
- Service usage patterns
Why should you use Machinations for creating User Flow Diagrams
Creating user flow diagrams with Machinations offers several unique advantages over traditional diagramming tools:
Interactive Simulation
- Test different scenarios in real-time
- Validate assumptions through dynamic testing
- Observe system behavior under various conditions
Complex Flow Modeling
- Handle multiple parallel processes
- Model probabilistic outcomes
- Capture intricate dependencies
Performance Analysis
- Track various metrics
- Measure system efficiency
- Identify bottlenecks
Iterative Optimization
- Easy updates and modifications
- Quick testing of alternatives
- Rapid prototyping of new flows
By using Machinations for user flow diagrams, teams can move beyond static representations to create living, interactive models that drive better decision-making and results.
