
During one of the most popular webinars we ran, I presented a deconstruction of Supergiant Games’ Hades. It’s one of my favorite games, I spent a total of 55 hours playing it, did 92 runs, of which 42 were successful.
In this article, though, I won’t be talking about the model itself, but about the data I got by running several simulations of the model, and what that data represents. For me at least. As a bit of context, before joining Machinations, I did QA for about 3 years, which meant testing a series of AAA games like FIFA and Battlefield, or smaller titles like Fe, Unravel 2, Disco Elysium.
If you’re curious about how our Hades model looks like, you can check out the webinar recording on the Machinations Youtube channel. I’ve also embedded the diagram below, for reference. The model represents Hades’ player loop, and it simulates 50 playthroughs and tracks and plots player performance & progress.
The Data
It took me about 5 days to build this model made up of 420 components. I need to mention though, that most of those 5 days were me staring at the wall, thinking about the game’s systems, and reverse engineering it.
For what we wanted to showcase during the webinar, we did 20 playthroughs of the model and plotted the win ratio of players, among others. As I mentioned before, the model itself is set to simulate 50 playthroughs for 1 individual player. So, at the end of the 20 simulations, the win ratio represents the percentage of won games over 50 attempts for 20 players.
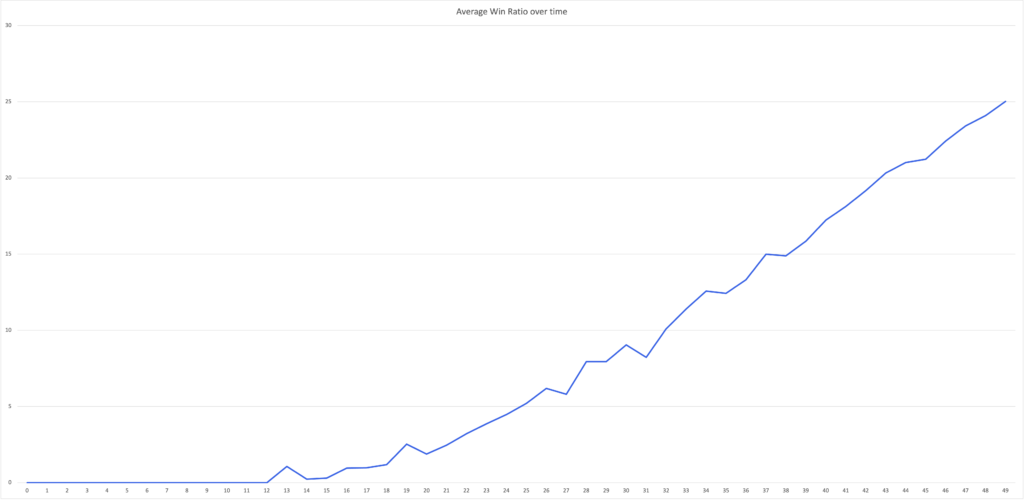
In Machinations, you can dig deeper into the data and pull into the chart any of the parameters of your model for further analysis. For the webinar, we wanted to look at this win ratio across all of the 1000 playthrough attempts simulated (20*50). The diagram below represents the progression curve across those runs.
Needless to say, I wasn’t expecting to see anything off – it was more about the exercise in and of itself. I did my groundwork thoroughly for building the model, I think it’s pretty accurate, and the game itself is flawless, in my opinion. The data we got out of simulating it shows it, too. The progression curve looks beautiful. Exactly what you’d expect from a roguelite.
The Sentiment
But this whole process got me thinking. What does this data truly translate into? Our first thought, which we presented during the webinar, was to roughly calculate how many hours of playtesting that simulated. From a professional’s standpoint, that is valuable information.
But what was more interesting, was realizing that the chart was equally as fascinating for the gamer in me. But why? When we were running the diagram one playthrough at a time, the randomness built into the Orchestrator generated a user that was struggling to progress. Matthew commented that this run was probably simulating someone of his level. That stuck with me. It was only later I realized why looking at the progression chart was gripping: it came loaded with sentiment. I knew exactly how the flat line of those first attempts feels like, as well as that first step on the ascending progression curve. I spent 55 hours in the Underworld, most of which I was stuck in the first few chambers. The first escape felt incredible. And I’m not alone: others like me spent a total of 8 million hours in a constant attempt to beat Hades.
Most studios do over-the-shoulder playtesting and they obtain a ton of data about how people “feel” about the game. I’m just imagining putting all that sentiment into analyzing simulation data, and how much more sense you can make of it. You are committed to offering your players an immersive, flawless experience, and in return, they commit to playing your game. When looking at a chart, it’s sometimes hard to remember the individual. But each plotted playthrough can become the journey of a player once you launch. And ultimately, it will amount to millions of players, each eager to take on the challenge of deciphering the path you laid out for them.
Interested in participating in one of the Machinations webinars? Here’s the schedule.