


The Citadel is a Web3 2D multiplayer space exploration strategy game that takes place in a persistent world on the Ethereum blockchain. Earlier this year, the game devs teamed up with Machinations, to model and assess their game economy design and after a few months of testing and model iterations, The Citadel became the first on-chain game to get the Verified by Machinations Seal.
For those curious about what our report looks like, we are publishing below the result of this audit, so that players and clients can get a better understanding of how Machinations evaluates and grades Game Economy Sustainability.
I. Executive Summary
A. Pillars
Machinations recommends that game economies satisfy the following custom framework:
- Sustained in-game value of critical currencies, via limits to supply and ongoing burn;
- Increasing real-world value of critical currencies, to support platform growth;
- In-game AMMs to regulate real-world valuation of currencies;
- Absence/Control of positive feedback loops (PFLs) in resources and/or currencies;
- Simulation of systems and parameters before deployment in live ops;
- Constant monitoring of live KPIs, especially crucial performance indicators such as Trading Volume and asset backing in treasury value.
B. Simulation and Assessment
Using information from The Citadel, we have conducted extensive simulations of the Citadel economy. The simulations depend heavily on assumptions given to us by the team, and certain additional reasonable and/or necessary assumptions. Given these assumptions, and based on the resulting simulations, Machinations assigns the following rating to Citadel’s performance on each of the above pillars.
- Sustained in-game value: GREEN. NFT supplies are limited by a weekly ship minting cycle that can be decreased easily, and increased at some cost. Simulations show that NFT values are sustained.
- Increasing real-world value: GREEN. The minting and burning mechanics in the game will allow ship value to rise on open external markets.
- In-game AMMS: YELLOW. Citadel does not have an AMM, which makes real-world value difficult to control or predict. Clients should be aware that token price could potentially affect auctions and thus NFT prices.
- PFLs. YELLOW. We have not found any glaring problems in the main systems of the economy. However, there is one case that could potentially blow up. In the current mechanics, Ore is spent to buy Ships to produce Ore, a classic amplifying loop. It is worth noting however that this amplifying loop would have a linear trend due to the capped nature of the Ship supply. This PFL, if it occurs, would cause the value of Ore to collapse as more and more Ore floods the economy. It could be triggered if the ore prices of Ships, determined on the open market, fall to a low level. In this case, the ability of a Ship to mine ore would far exceed its market price. For example, a ship that produces 100 Ore per day but only costs 1 Ore to buy would take 1 Ore out of the economy but pump in 100 Ore per day, a situation that would obviously lead to a collapse in Ore value and, correspondingly, an exponential rise in the price of Ships in terms of Ore. This is however an extremely unlikely scenario due to the nature of auctions and player competitiveness.
C. Recommendations
Machinations recommends that Citadel implement an AMM in order to have more control over the economy. We further recommend that the live team monitor the Ore price of Ships to ensure that the price/earnings ratio of Ships stays reasonably high. Ship price can be raised by limiting the minting of new Ships. Earnings can be reduced by reducing the rate at which Ships mine Ore.
Based on our simulations, the Machinations team finds that the game’s economy satisfies the following key pillars:
- Limited supply of NFTs with a weekly Ship minting cycle having amounts that can vary according to needs;
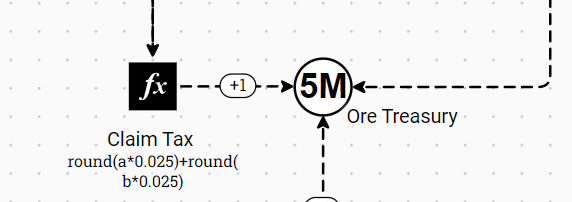
- Constant burn on player tokens by using the claim tax and fuel;
- Potential for NFT burns by incentivizing players to risk them;
- A weekly competitive auction with a stable or increasing Ship price over time;
But also the following potential red flags:
- No in-game AMM which makes token value very hard to predict and control. Token price could potentially affect auctions and thus NFT prices.
- Ore spent to buy Ships to produce Ore is a positive feedback loop, and in case of low Ship Price Earning ratios the appearance of inflation will be imminent.
Taking all of the above into consideration, and interpreting all simulation results in various scenarios, provided that the final recommendations are followed through (such as Ship Price Earning ratio kept under control during the live Monitoring phase, AMM implementation), the game economy will have high chances of satisfying the business and design goals of The Citadel DAO, such as: high probability that there will be no inflation present, high stability and long-term health.
Just to reiterate: if in a scenario where the price of a Ship goes to eg 1 Ore (by eg community price fixing) and that Ship produces >100 Ore / day (3 digit Price Earning ratio or “positive feedback”), then it is obvious that the accelerated accumulation of Ore in the economy will eventually lead to a crash in Ore value. Hence it is imperative that the team monitors and has a contingency plan to deal with this before launch.
Another scenario would be where the volume of trading on a weekly basis is very low. That would mean that a ship’s relative value represented in the treasury would decrease fast as new ships are minted, potentially devaluing both NFTs and tokens. This can be mitigated by controlling the supply of ships coming in each week.
II. The process so far
II.1 Glossary
-
- Ore: The Citadel’s token. It is used in all aspects of the game
- Ship: The Citadel’s NFT. Each ship is represented by an NFT and ships come in different sizes and rarities
- Fuel: It is represented by the same Ore tokens and is used when traveling on the map
- Miner: Players that generate Ore tokens by mining in the game
- Marauder: Players that collect taxes from miners
- Belt: Asteroid belts that miners can mine Ore token from
- Region: One of the 5 regions that the map is split in, each having different characteristics
- Outpost: The “Hub” where players can unstake ships and upgrade them
- Floor price: The lowest winning price of a ship in the Auction House
- Ship backing in ETH: Relative value of a ship according to the amount of ETH present in the treasury (ETH in treasury/number of ships)
II.2 Game description
- “The Citadel” features 2 player factions: miners and marauders. Miners are the players that generate Ore tokens by mining in belts and marauders are players that collect taxes from miners in the form of Ore and hunt down miners that refuse to pay taxes.
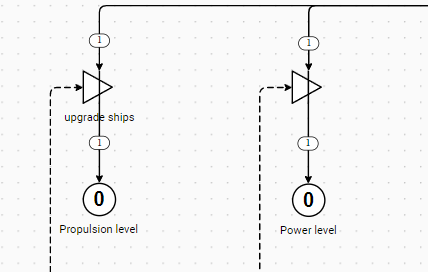
- Players are able to upgrade their ships in 2 aspects: Propulsion and Power. Propulsion affects the speed of each ship and the amount of fuel it consumes while power affects mining efficiency for miner ships and tax collection split for marauder ships.
- There are 5 different regions on the map. Each region has a different belt average capacity, number of belts, mining multipliers, tax percentages and risk percentages. Players can freely move between regions at all times as long as they have enough fuel (Ore tokens).
- Miners have the option to select which belt to travel to and start mining. They can stop mining at any moment or wait until the belt is depleted. They can choose to pay taxes to marauders and avoid any risk or not pay taxes and risk losing their ship.
- Marauders sit on belts collecting taxes from miners. When a miner refuses to pay taxes there is a small chance that marauders will destroy their ship, thus collecting 100% tax.
- When traveling any amount of distance fuel is burned by ships. Fuel is represented by the same Ore tokens that players collect when mining or by taxing.
- Newly added ships are given through weekly auctions to players and can be purchased using the Ore token
II.3 The process
- Both Whitepaper and Yellowpaper were available from the first day of the collaboration February 16th containing data on most of the mechanics of the game and the 2 documents & design have not changed at all in this period. Any additional questions were discussed and resolved on a communication channel.
- Between February 16th and March 18th 2022 we’ve had numerous update calls and two major handoff sessions for two different models.
- All the constants in the Yellowpaper have been taken as given, and any change in these constants might have a big impact on the entire economy and must obviously be forecasted and assessed before deployment, ie the
- 3333 Ships NFTs being minted initially
- 300 new Ships being minted each week
- 80% – 20% Miner vs Marauder Ships
- 5 regions & 2 outposts
- Number of belts per region
- Ore multipliers in different regions
- Tax percentages in different regions Fuel costs for different ships
The first model – “Citadel Singleplayer” – was the full game mechanics and singleplayer model:
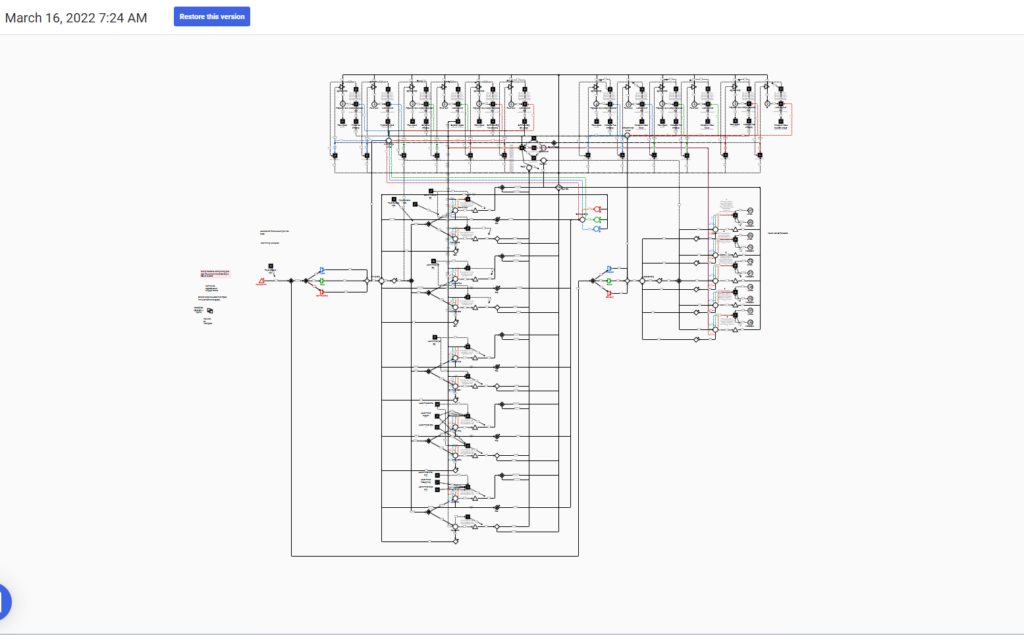
In the model a player starts by selecting either a miner or marauder ship of different size (they can also select multiple ships at once):

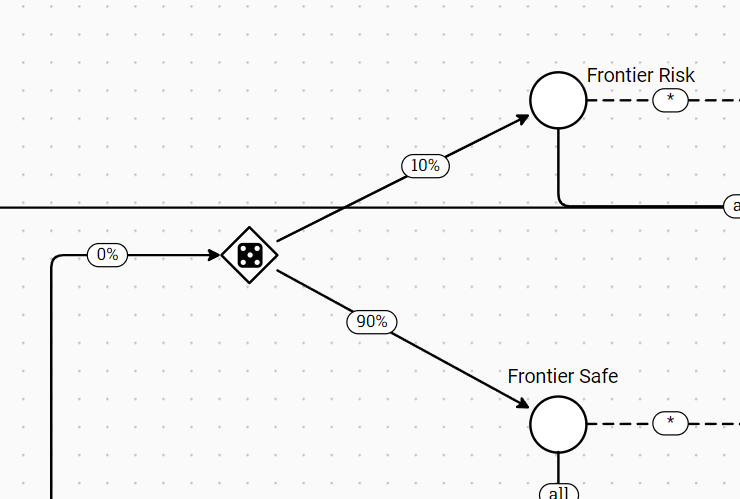
A player then selects a region to travel to where upon claiming Ore they select either the safe action of paying taxes or the risky option (Example of the first region)
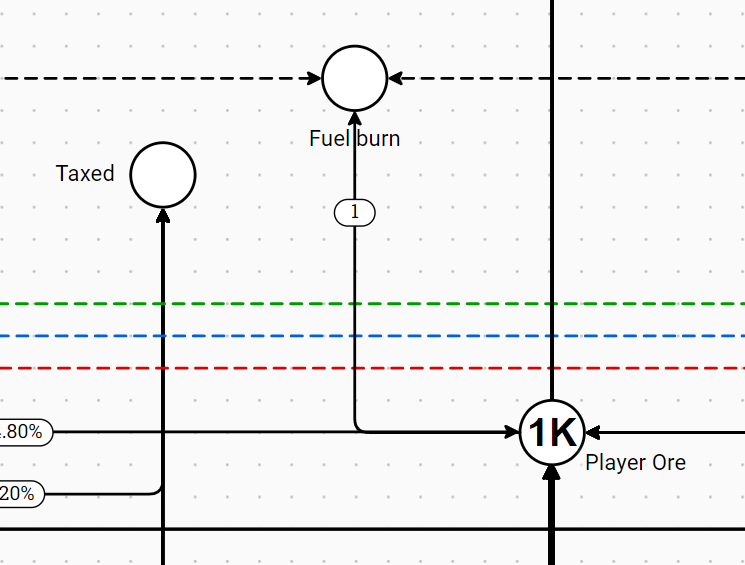
We have an overview of how much Ore the player currently has in possession, how much was taxed and how much they burned on fuel
Players can upgrade their ships and it will improve the speed, fuel efficiency and power of their ships.
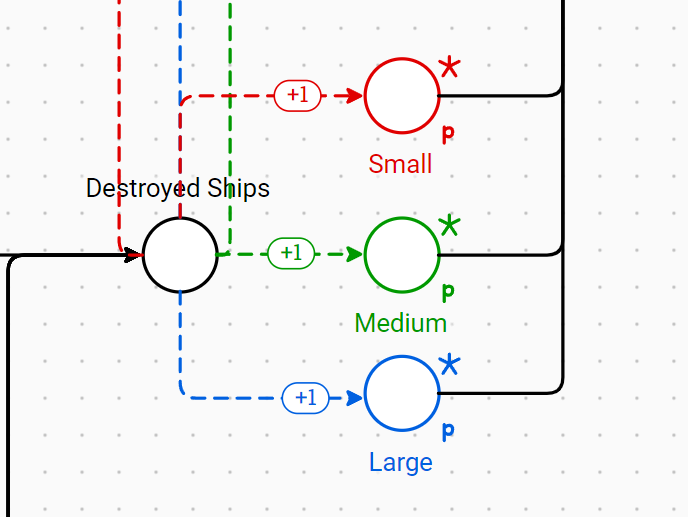
We also keep track of the number of ships burned by a player when they take the risky option
Using the singleplayer model simulations we can determine the following:
- Amount of Ore a type of ship is able to generate in different regions
- Amount of fuel that different ships burn by going to different regions
- Number of ships lost due to not paying taxes in all different regions
- Amount of tokens lost to tax by Miner Ships
We will use the above in the full economy model below
We can also adjust different factors in order to reach the desired token gain per day in all different regions with different ships such as:
- Fuel costs for different types of ships
- Travel speed for different types of ships
- Belt capacities (how much time it takes to deplete them)
- Belt amounts per region
- Region Ore multipliers
- Miner and Marauder distribution
- Upgrade costs and improvement ratios
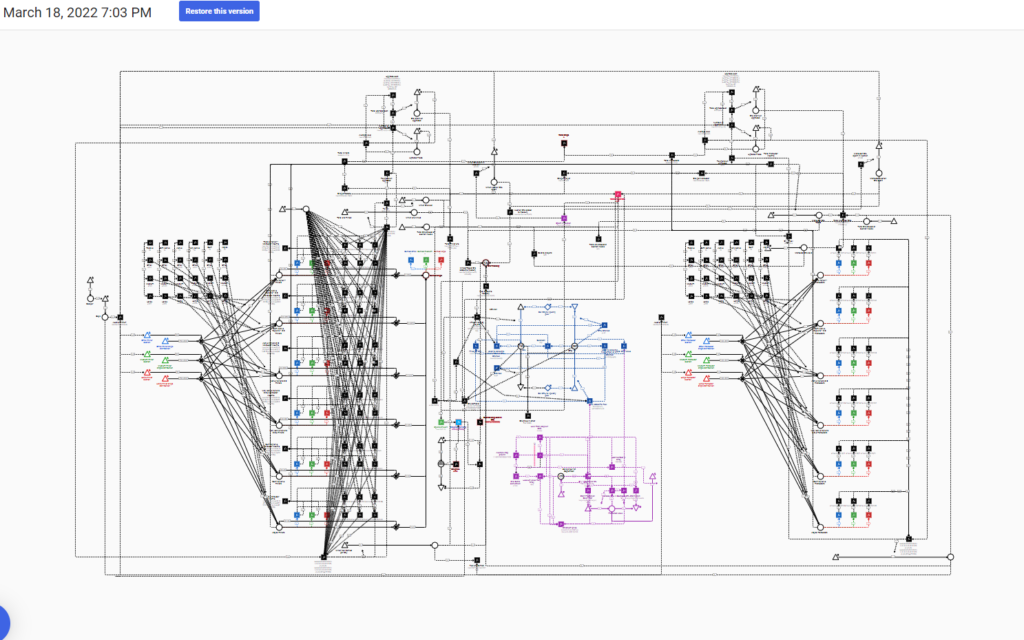
The second – “Citadel Full Economy” – model was the full economy model looking at the economy of the entire ecosystem:
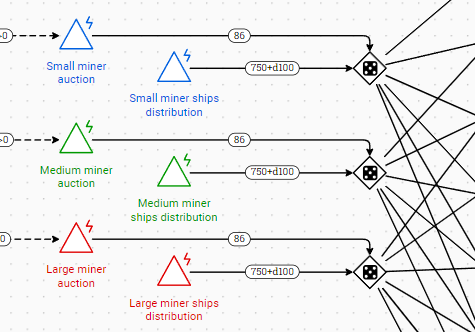
Miner and marauder ships are distributed at the beginning and split into different playstyles. Ships are also added on a weekly basis after auctions.
We keep track of each type of ship for a player persona and generate Ore tokens for them according to the data from the Singleplayer model
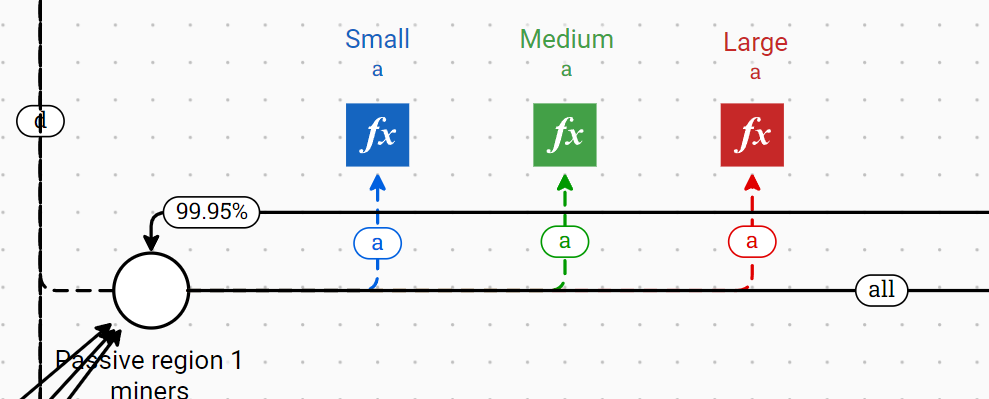
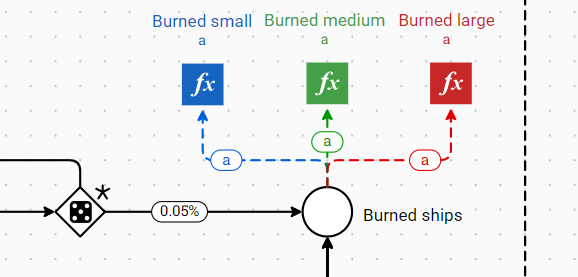
All burned ships are tracked according to ship size
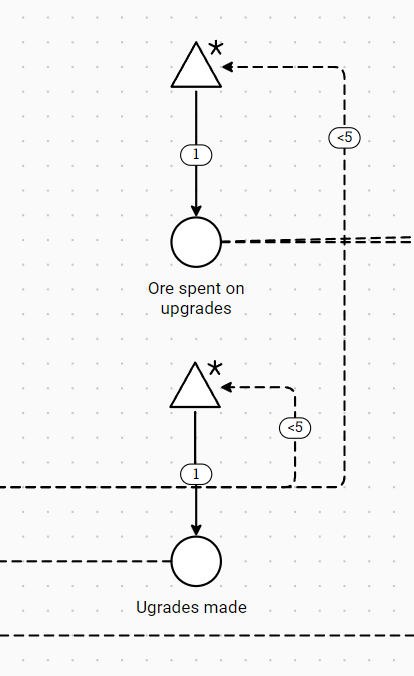
Ship upgrades and Ore spent on upgrades is being tracked as well
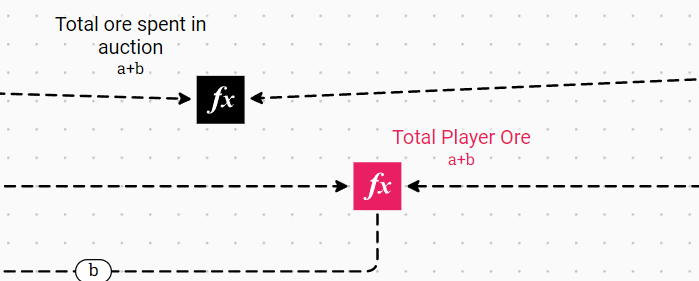
Total player-owned Ore is tracked along with total Ore spent on things such as auctions, upgrades, fuel (Screenshot only contains Ore spent in auction)
Both token and ETH treasuries are also being tracked with all the different factors that add into the treasury (Screenshot only contains Claim tax and token treasury)
Using the full economy model we can have a look at:
- Total Ore generation over periods of time
- Total Ore burned by different drains such as fuel or claim tax
- Total Ore spent on upgrades or auctions
- Ore price and Ship price evolution over time
- Ore and ETH treasury evolution over time
- Amount of Ships in circulation over time
We use the following assumptions in the full economy model that influence the final results:
- Player activity (how many players stake their ships)
- Player token selling patterns
- Weekly trading volume on OpenSea
- Initial token value (a simple AMM is also used for price control)
- Auction competitiveness
III. Findings
Due to the nature of the game’s mechanics, personas were assigned to Ships rather than individual players. Since spending habits only play a role in the auction house (and to a lesser extent Ship upgrades) personas were split using gameplay and activity patterns rather than spending patterns.
Hence the models and simulations were done on the number of Ships in the economy and NOT on the number of actual players in the economy (where 1 player might have multiple Ships).
Because of this, it is easy to create any type of player by simply adding multiple Ships of different types into one single result.
Thus Ships were split into 6 different personas based on their activity in the game and willingness to risk their NFTs, ranging from very passive Ships that never risk NFTs to very active Ships that always risk them, as listed below with details of how the persona translates into the model.
Note that the personas are an assumption and in reality, players may have play styles that are similar to more than one persona at once.
- Passive: Hangs around region 1 (100% selects region 1)
- Semi-Active: Hangs around regions 1, 2 and 3 (50% region 1, 25% regions 2 and 3)
- Active: Hangs around regions 2 and 3 (50% regions 2 and 3)
- Very Active: Hangs around regions 2, 3 and 4 (25% regions 2 and 3, 50% region 4)
- Extremely Active: Region 4 only (100% region 4)
- Abyss: Players that go into Region 5 regularly (100% region 5)
III.1 Observations
- The initial split between miner and marauder ships was 90% to 10%, however singleplayer model simulations revealed that due to the nature of miners vs marauders interactions, a split of miners vs marauders ranging between 80% vs 20% to 85% vs 15% is desired for economic balance between the two. The ratio was later adjusted to 80%-20%.
- Minted ship proportions are also something to be carefully considered. Minting new Ships at 80%-20% proportion, over time, will cause an increase in marauder Ships overall, since miner Ships can be burned while marauder Ships cannot.
- Depending on the type of Ship a player receives their optimal playstyle changes. While larger Ships are generally favored in higher capacity less active regions, smaller Ships are suited for low capacity high yield regions. Of course players can opt for any playstyle but using Ships out of their respective preferred regions will yield diminishing returns, hence a lot of assumptions regarding player behavior have been made, which need to be validated with telemetry in the live monitoring phase (see chapter IV).
- Ship burn will also heavily depend on how many players choose to take the risky option. Due to the opportunity of retaining a lot more Ore when taking the risky option there is incentive for players to take that approach.
- For the 5 different regions an average multiplier was selected for Ore mined:
-
- Region 1: 0.73x
- Region 2: 1.08x
- Region 3: 1.58x
- Region 4: 3.45x
- Region 5: 7.96x
- The initial average multiplier for region 4 was 1.96x, however, the singleplayer model simulations showed that token earnings in region 4 was lower than in any other region. The multiplier was increased to 3.45x to bring it in line with the other regions. Note that region 4 has the highest volatility potential out of any region, it is recommended to closely monitor the earnings and adjust accordingly
- However the amount of Ore that a Ship can obtain over a period of time still has a lot of variances depending on random factors such as belt spawn locations and capacity and the way miners and marauders decide to group in different regions or belts, ie luck and playstyle might make the difference between 30 to 150 tokens earned per day.
- Due to the lack of an AMM at launch prices of Ships in the auction house and general Ore value is very hard to predict. There are assumptions however that the floor Ship price increases with the ETH treasury as Ships give players governance and voting power.
- Because prices are almost impossible to predict, the aim of the simulations is to make sure that
- The economy does not become inflationary and Ore price reaches stability over time.
- Ship price reaches stability or has an increasing value over time
III.2 Simulations
- Simulations were executed for different scenarios of players’ habits of selling Ore, Ships relative value to the treasury, player spending habits, and weekly trading volume.
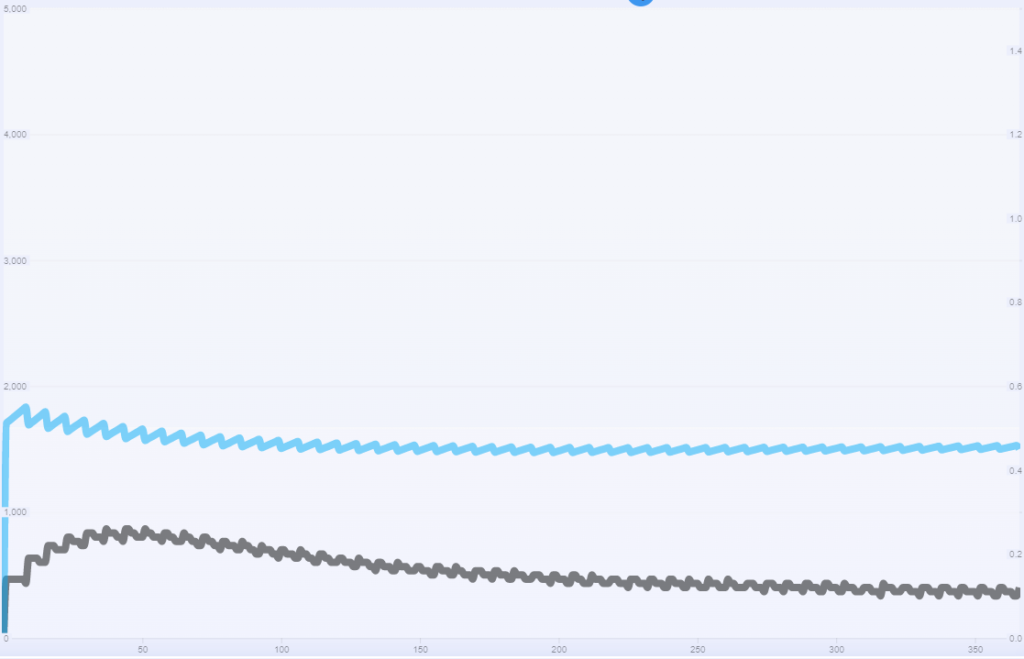
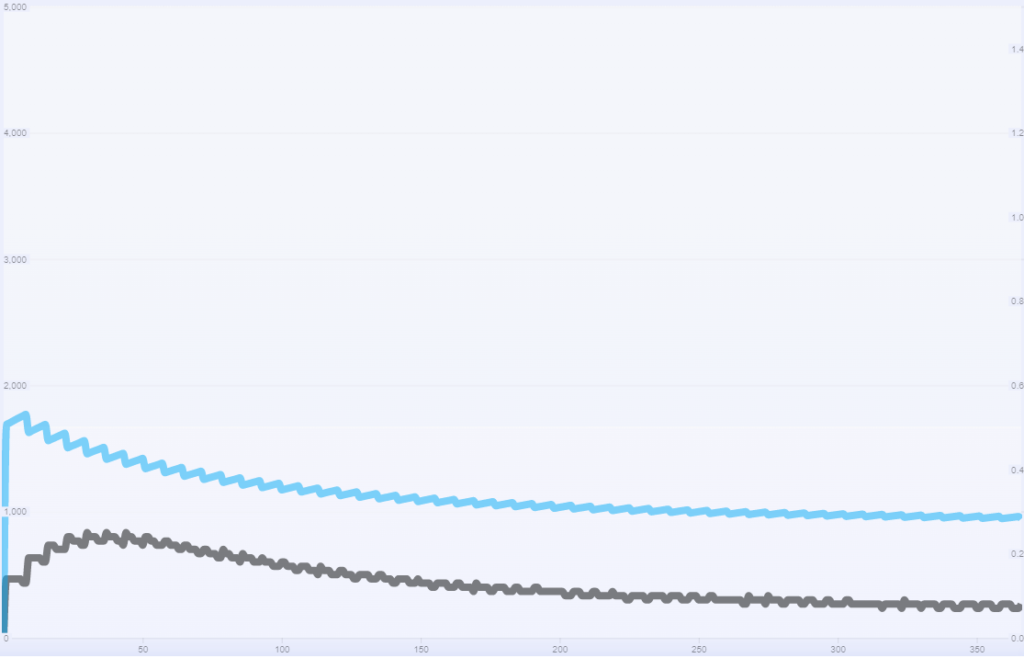
- The black line is the Ore price over time and the blue line is the Ship floor price over time.
- The following charts show the average Ship price and average Ore price evolution over time in different scenarios. The zig-zag pattern is due to the nature of weekly auctions. We first present a standard case scenario, following up with multiple extreme cases.
- Due to the lack of an AMM and the nature of player-driven markets the actual price points are almost irrelevant, it is the evolution of prices over time that should be tracked. We focus on trends over time, not the price amounts. The actual price amounts will depend on factors outside the model, such as the real-world trade of game currency for other blockchain currencies. These cannot be known in advance as there is no AMM built into the system.
- The price points are in $, however, that is irrelevant, they could be just as well in any other type of currency.
- The size of the Ships community has been modeled directly on the number of Ships minted in the initial drop and the subsequent weekly mints at 100% sale. There are possible scenarios, however very improbable, where the total number of Ships dropped are not fully sold.
- All presented charts use the same Y axis for the Ore token and Ships price, however, the y axis that the Ore price and Ship price use are different from each other.
- Simulations were executed for 365 days in real-time. In all of these graphs, the X axis represents one year of time (52 weeks).
III.2.1 Simulation Results
Standard scenario: No extreme cases (60% of players sell tokens daily, Ship value according to treasury backing is 100%, Trading volume of 2000 ETH/week, players spend 50-60% of total token volume in auctions each week).
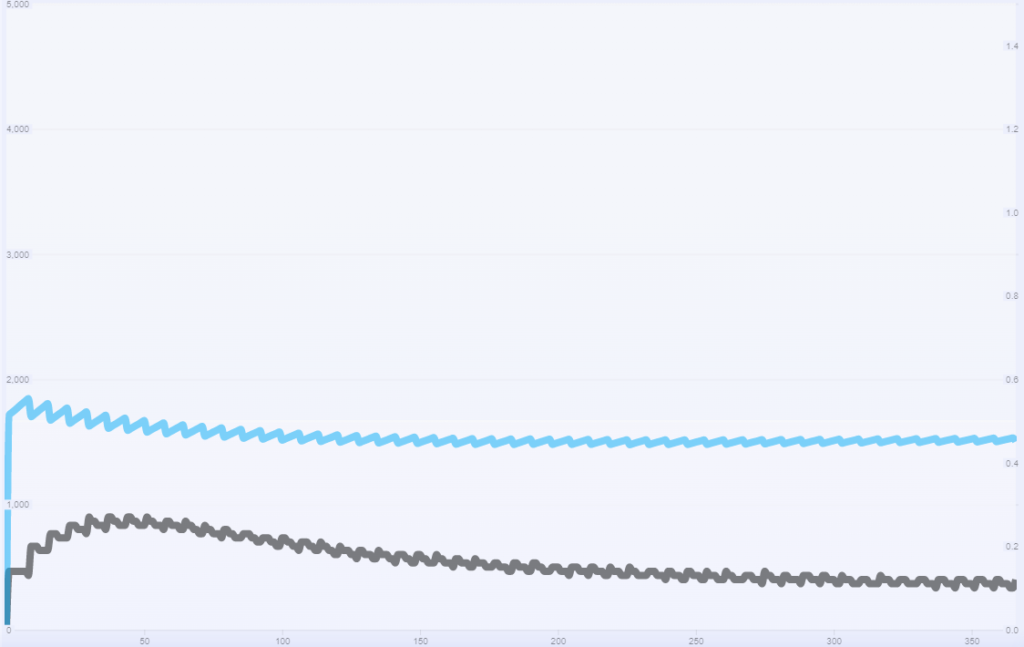
Notice the Ore price (black) & Ship floor price (blue) are both at their peak in the first month or so, after which ship price quickly reaches equilibrium and token price slowly decreases and eventually reaches equilibrium as well.
The rate at which both prices evolve is affected by different parameters as we can see below.
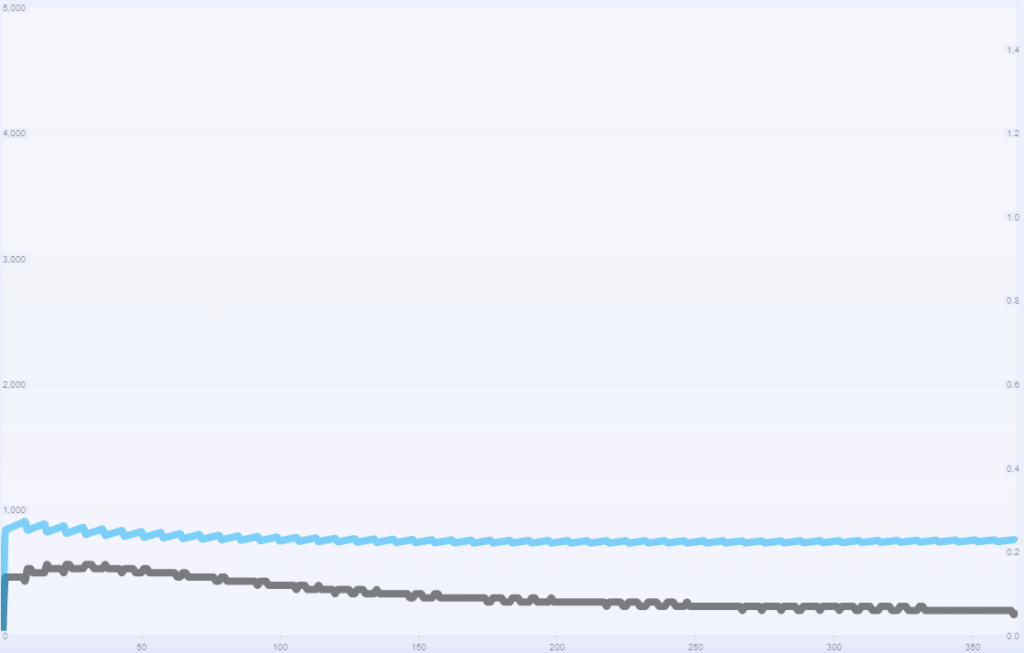
Extreme Scenario 1: 90% of players sell tokens everyday
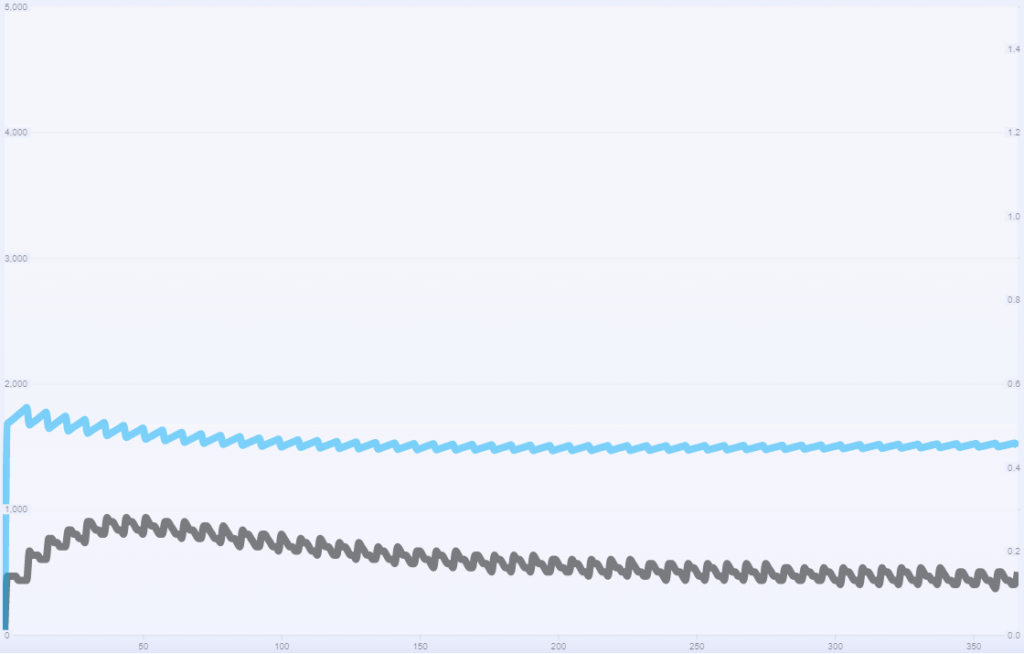
Extreme Scenario 2: 20% of players sell tokens everyday
We can notice that token selling patterns hardly influence both ship price and token price.
This is because of a Ship’s backing in the ETH treasury which would cause a Ship’s price to be dictated mostly by that.
Example: If the ore token is worth 0.05 and a ship would cost 10k ore, then if the token would be worth 0.01 the ship would cost 50k ore (The total value of tokens expressed in real money should remain unchanged in the auctions)
Therefore selling more tokens should mean a lower token price which in turn means players need more tokens for the auctions, thus purchasing tokens and raising the price back.
Since players are the ones auctioning there is always the possibility that low ore prices could result in decreased ship prices.
Extreme Scenario 3: Players spend 90-100% of owned tokens in auctions each week
Same idea as above, spending more from owned tokens in the auction would mean that less tokens need to be purchased to be competitive, therefore it falls into the same idea as the “20% sell” pattern.
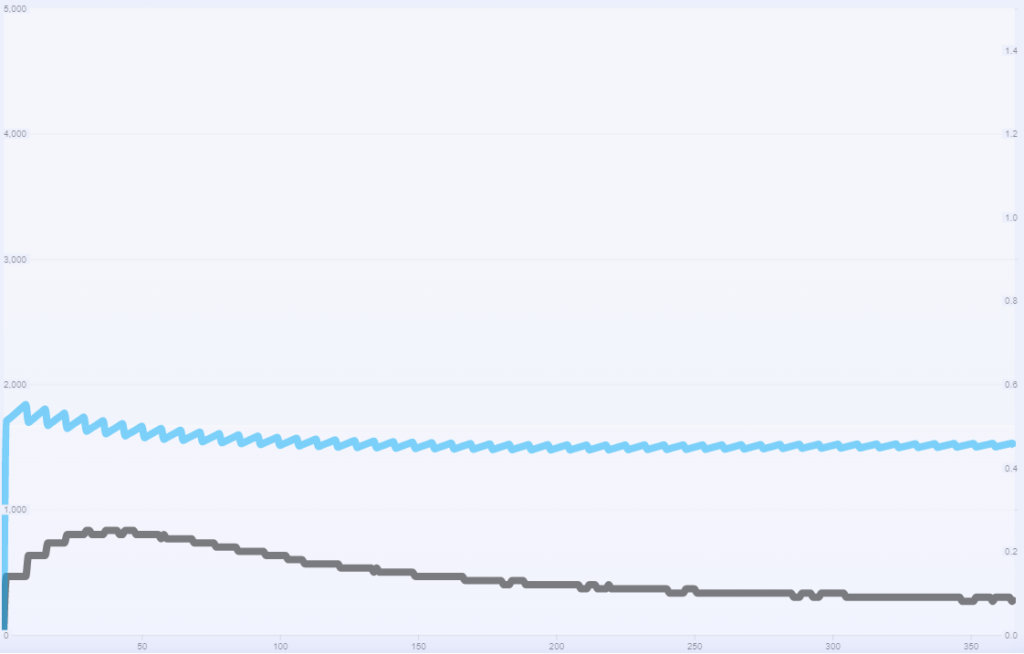
Extreme Scenario 4: Auction ship value is only 50% of its actual treasury value
Very unlikely scenario but if a ship’s worth according to the ETH treasury was viewed at 50% of its value then both ship and ore token would drop.
This has a negative effect on workers that want to cash out tokens everyday but a very positive effect on players owning multiple ships as each ship would be cheaper to acquire while representing the same value relative to the ETH treasury.
Extreme Scenario 5: Auction ship value is only 10% of its actual treasury value.
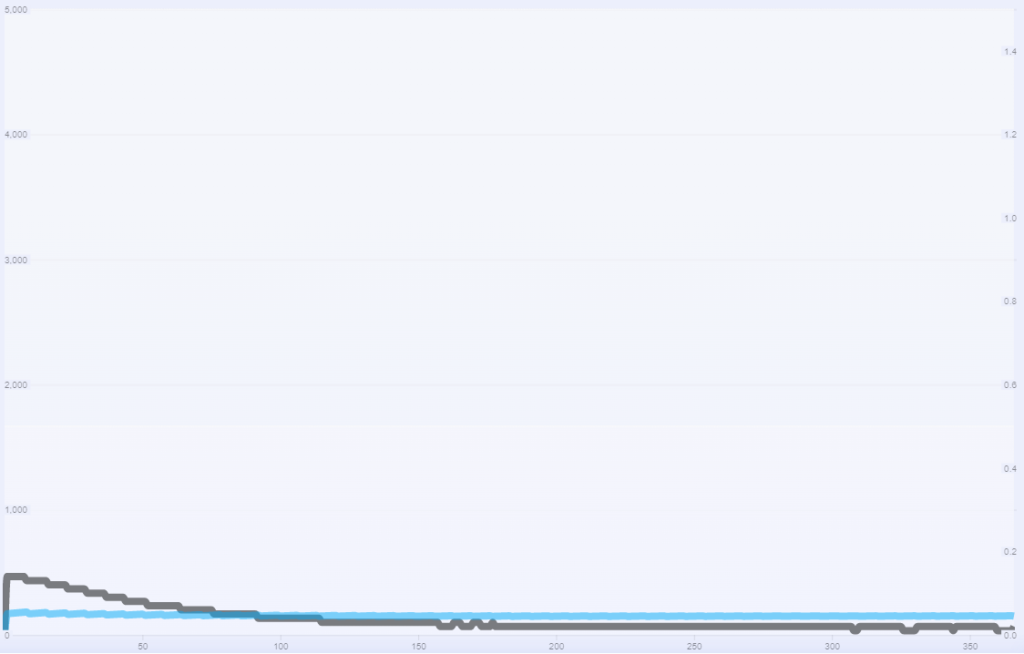
Reiterating on the previous scenario with an even more unlikely outcome
We can notice both token and ship prices going down, and while this scenario would be the worst outcome for workers, it would be the absolute best outcome for people that plan on owning multiple ships.
This scenario is however extremely unlikely to occur (almost impossible) as players would have to gravely misjudge a ship’s value.
Extreme Scenario 6: Trading volume at 5000 ETH/week
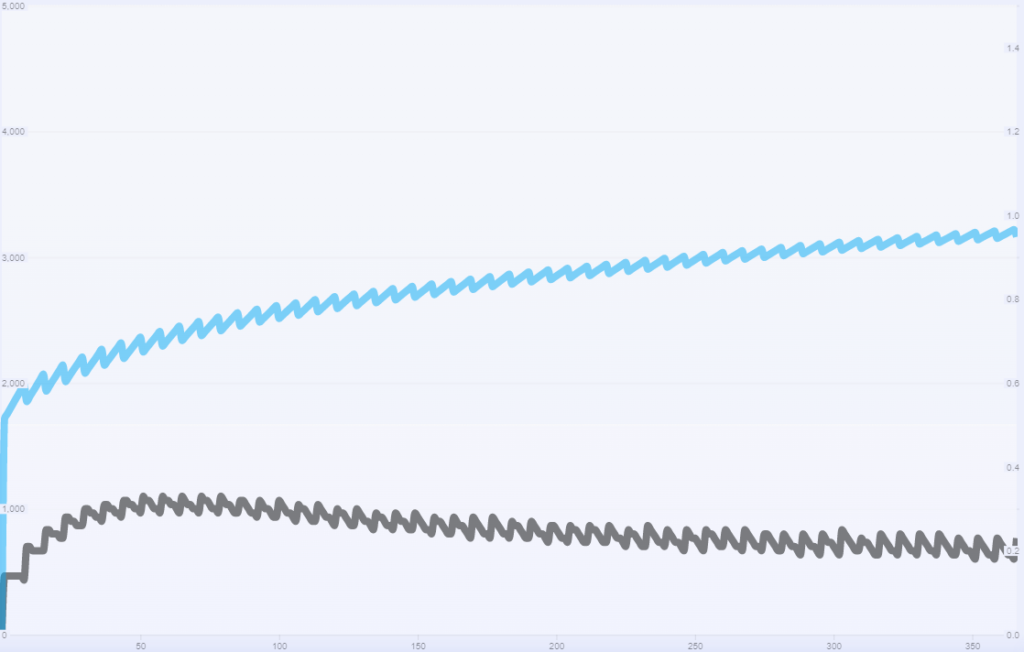
This is the healthiest scenario so far, both for token and ship price. A higher trading volume would cause the treasury to grow faster, which in turn gives each ship more backing in the treasury, therefore increasing the value of ships.
If the price of ships increases, tokens would also look a bit better, reaching stability at a higher price.
Extreme Scenario 7: Trading volume at 1000 ETH/week
We can notice that a lower trading volume would cause both ship price and token price to drop. From this we can understand that the trading volume is most likely the single most important factor in determining both token and ship value.
A very important way to control trading value impact over ship prices would be minting ships in accordance with the treasury backing of each individual ship. Below we can see an example where ship price remains stable instead of decreasing because minting ships is done dynamically and not flat 300 per week.
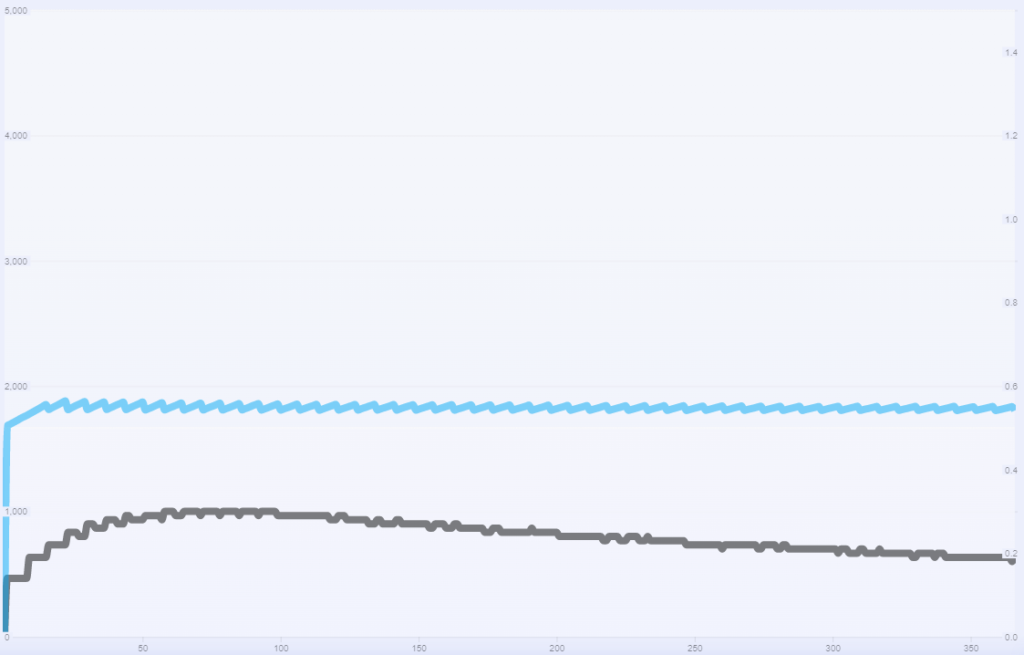
The scenario above is for a trading volume of 1000 ETH/week. Notice how controlling the minting of ships based on trading volume can affect prices.
Notice that token price is also at its highest in this case. Controlling ship minting and sustaining the ship price therefore becomes imperative in sustaining the token price as well.
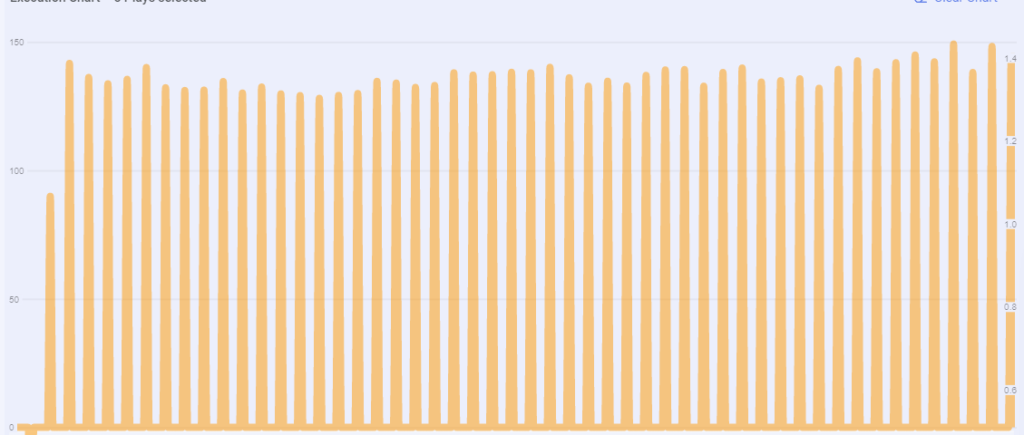
We can observe on the chart below on the left scale how many ships had to be minted to keep the ship values constant (first week had 0 minted ships and generally every week was below 150)
III.2.2 Simulation Observations
- Weekly auctions and trading volume play the most important role in determining the value of the Ore token.
- As long as ship prices reach stability then the Ore token price still reaches equilibrium over time.
- The key part to managing Ship price will be the number of weekly auctioned Ships together with total trading volume.
- The above considerations do put pressure on the development team’s content pipeline, where the economy is directly dependent on new drops consistently happening every single week.
- However, considering the nature of the Ships aesthetics, it is foreseeable that 300 Ships can be dropped successfully each week.
- 15k Ships / year is a solid undertaking and any discontinuation in this content pipeline might have unforeseen consequences.
- Monitoring trade volume and adjusting minted Ship numbers each week is an important part of sustaining Ship prices
II.3 In-Game Economy Overview
A standard case scenario simulation will be used to identify the in game flow of resources. Prices for Ships and Ore token in this scenario are plotted as such (This is the same standard scenario from the Simulations chapter):

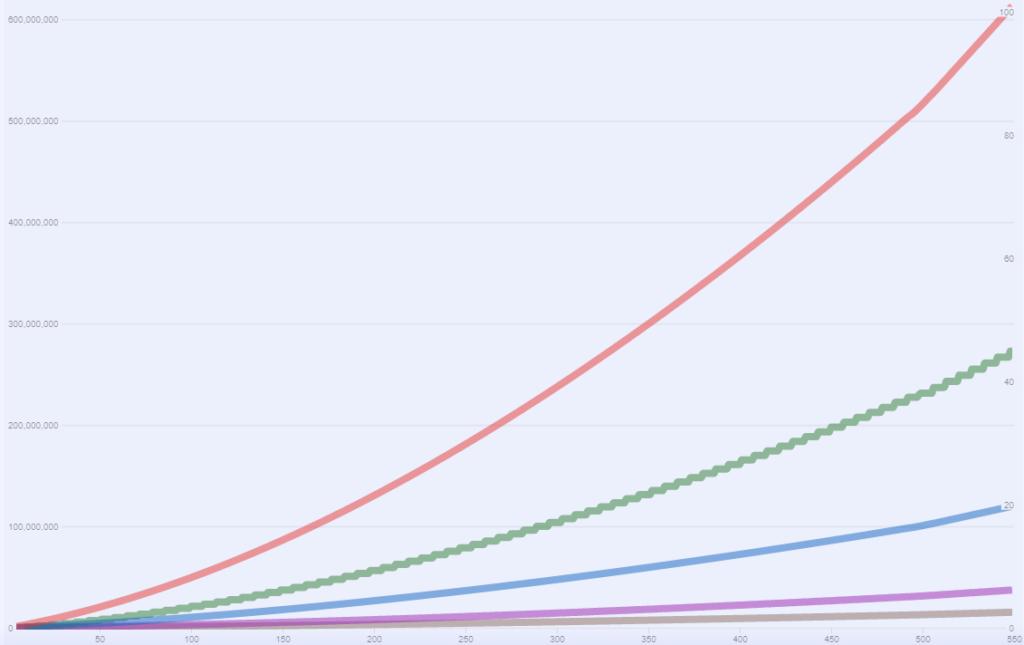
Next is a look at all of the Sources and Drains of the Ore token in the economy (Some of these tokens are burned while some are added to the treasury). A general term such as “Ore spent” will be used where:
- Red: Total mined player Ore (only source of Ore in the game)
- Green: Total Ore spent in auctions (67% burned, 33% into treasury)
- Blue: Total Ore spent on fuel (67% burned, 33% into treasury)
- Purple: Total Ore spent on upgrades (100% burned)
- Brown: Total Ore claims tax (100% treasury)
This is how total player Ore available looks over time:
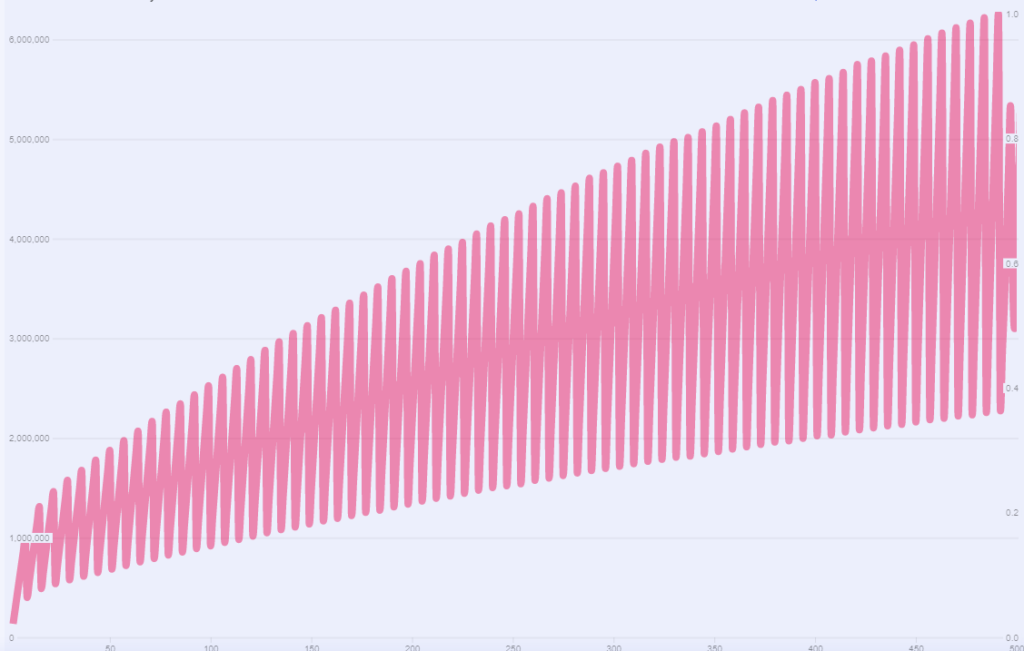
The apparent increase in minimum Ore held is given by the fact that players also produce Ore in the same day that auctions happen and do not get to use it in the auction in the model. In actual gameplay the minimum ore held should be stable over time.
Over the course of 548 days (1 and ½ years) we have a total of:
- 611,048,911 Ore mined by miners
- 272,775,212 Ore spent in auctions
- 119,468,266 Ore spent on fuel
- 37,064,350 Ore spent on upgrades
- 15,276,224 Ore taxed on claims
Numbers should not be treated as certain, as players’ behavior, spending patterns, and priorities will heavily affect the outcome.
With competitive auctions and stable Ship prices, the general increase in player Ore mining capabilities is matched by the increased overall costs of fuel due to multiple new Ships in circulation and auction bids.
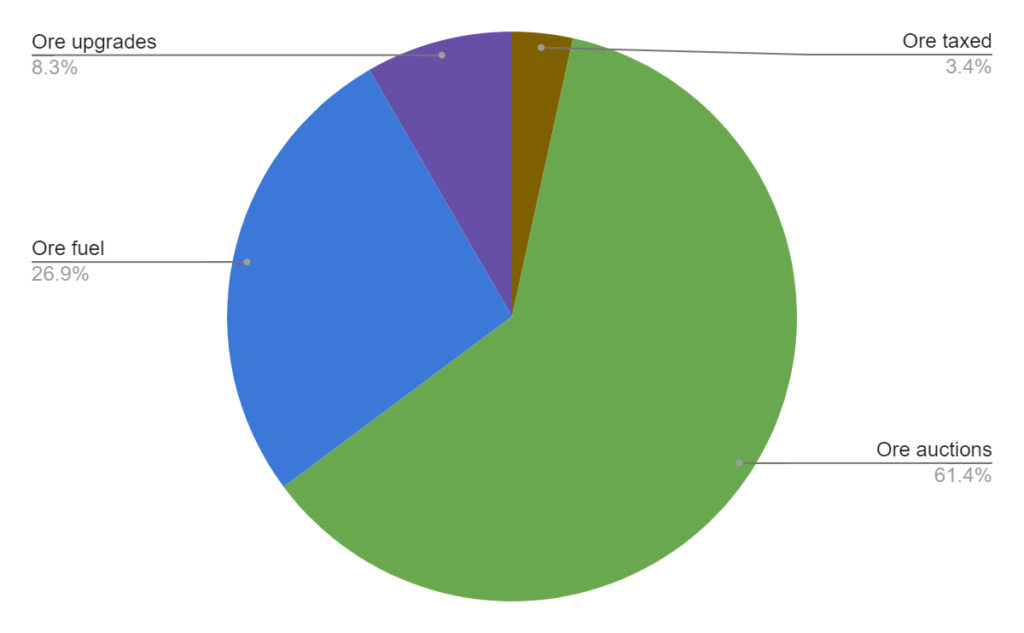
Out of the 4 sinks auctions are the most important drain on the player Ore. While fuel, tax and upgrades do not have a lot of variation, auctions have room to potentially be a much bigger or smaller portion of the total economy drain.
Something important to note is that ship burns also reduce the only source of ore in the game. Since ships are used to mine (create) Ore in the economy, destroying ships is considered as reducing that source.
Raising the chance of burning/region could be a mechanism of draining more player wealth.
Let’s also have a look at the number of ships in circulation (red) and the number of burned ships over time (purple)
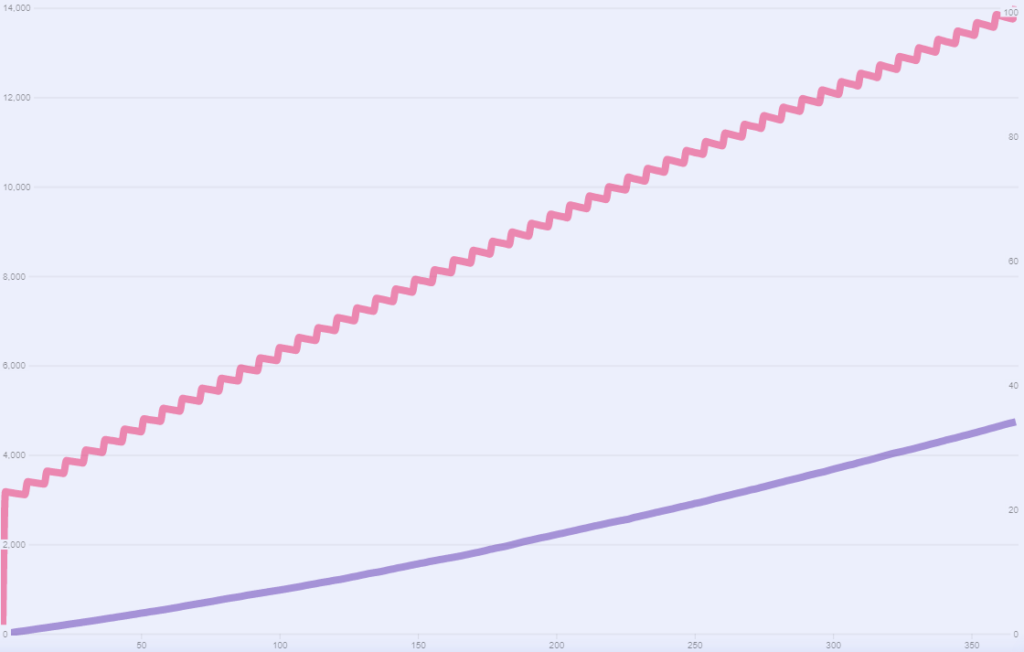
We can notice a few things here
- Number of ships burned have a slowly increasing curve over time as more ships are added from weekly auctions
- Number of ships in circulation has a slowly decreasing curve due to capped supply and increasing ship burns
- In time the 2 lines should run in parallel (burned ships should equal minted ships).
A look at the ETH Treasury growth over time and the correlation of Ship prices and Treasury:
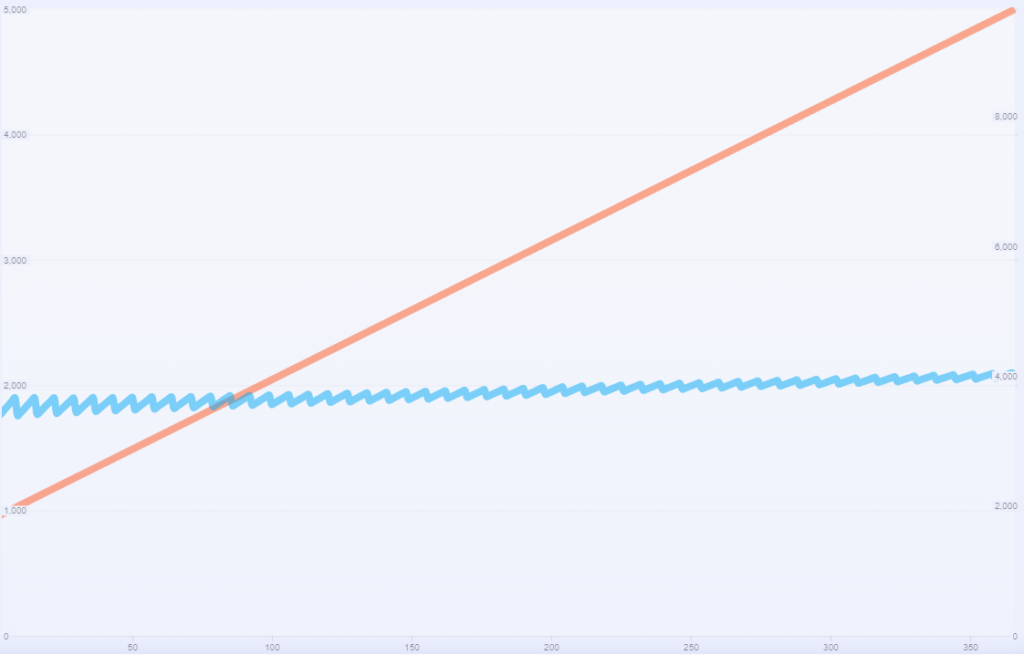
- Notice how Ship price is slightly increasing over time at a trading volume of 3000 ETH/week and a weekly mint of 300 Ships.
- A steeper increase of the treasury would mean a more steep increase of the Ship price before reaching stability, while a slower treasury increase would mean a slight decrease of ship price before reaching stability.
- Number of minted weekly ships also affects the Ship price curve. This can be used to determine how many ships should be minted in a week based on the treasury growth during that week.
IV. Moving Forward
The following telemetry data points are needed in order to get more accurate simulations, on an ongoing basis for the Monitoring phase, attempting to replace most of the assumptions that the models currently have with these KPIs:
Gameplay events:
- Total number of users owning at least 1 Ship (lifetime)
- Total number of Ships that were staked at least once each day (by Ship size)
- Average miner claims amount/day split by 5 regions (preferably also by Ship size)
- Number of travels/day split by 5 regions and by miner/marauder (also preferably by Ship size)
- Upgrades/day split by miner vs marauder and upgrade level
- Average belt player density split by 5 regions and miner vs marauder (preferably by Ship size for miners)
- Total number of Ships currently available
Monetization events:
- Floor Ship price and average Ship price in weekly auctions
- Average Ore sold by players divided by the number of Ships they own
- Total Ore spent at the auction house (would be nice with split between winning bid Ore and losing bid Ore)
Macro events:
- Number of transactions/day
- The total value of transactions/day (Number*value in ETH)
It is our expectation that you take all necessary steps to configure these events in a diligent and timely manner and provide the Machinations team access to the real-time dashboards that contain the above aggregated KPIs in order for our verification service to continue and ensure the long term monitoring and forecasting of The Citadel’s game economy health.
Disclaimer
If a developer is authorized to display our badge, and they have complied with our Certification Scheme Rules, it means they have taken the time to map out and model the economy of their platform or game using our tools, that we have helped them to balance those models and simulate how those economies will work once the platform is live.
Ultimately, we do not provide the platforms or games themselves, nor decide how they work, so we cannot accept any responsibility towards users. Use of the badge does not guarantee how a platform or game will function, nor that a developer’s software will be free of bugs, that it will remain available forever, or that you should play, use, or invest in those platforms or games, or their respective economies.
If you have any other questions or concerns, please let us know by writing contact@machinations.io
