

Unlike simple Gantt charts or flowcharts, modern project management diagrams need to account for multiple stakeholders, resource constraints, and varying outcomes.
What is a Project Management Diagram?
A project management diagram is a visual representation of how resources, tasks, and workflows interact throughout a project’s lifecycle.
These diagrams help teams understand resource allocation, track financial flows, and manage complex dependencies.
When Should You Create a Project Management Diagram?
Create a project management diagram when you need to:
- Plan complex projects
- Allocate resources effectively
- Track budget distribution
- Manage stakeholder relationships
- Model project outcomes
- Identify dependencies
- Monitor project milestones
- Analyze risk factors
Project Management Diagram Examples Created with Machinations
1. Film Production Management
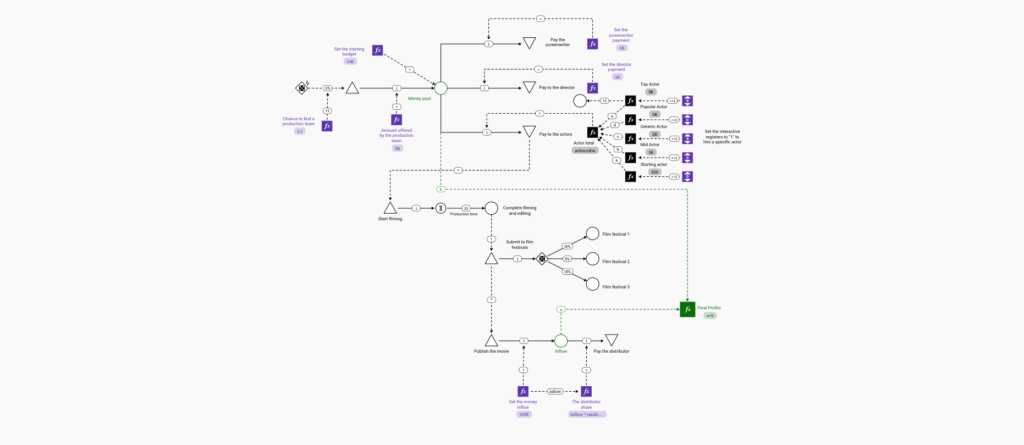
Interact with this diagram: Film Production Management
This comprehensive diagram shows the complete lifecycle of a film project.
Key features include:
- Budget allocation system
- Team hiring process
- Production timeline management
- Festival submission strategy
- Distribution planning
- Revenue tracking
- Stakeholder payments
- Risk management elements
2. Manufacturing Project Planning
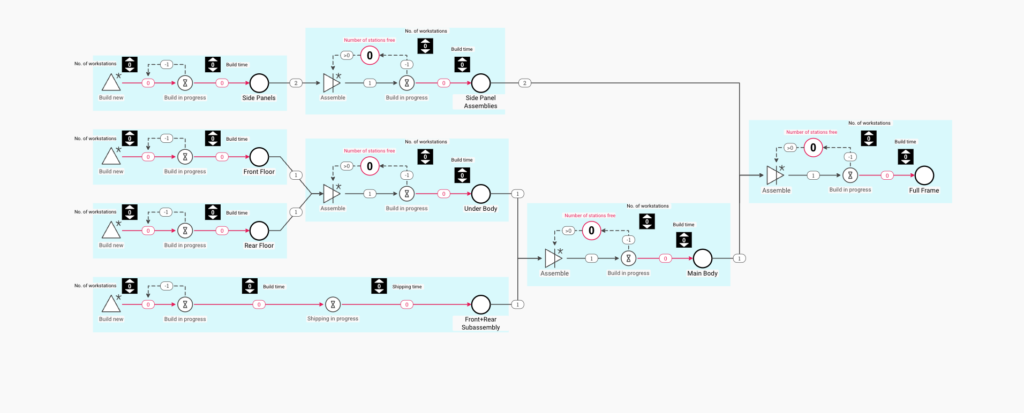 Interact with this diagram: Manufacturing Project Planning
This system demonstrates production project management.
It shows:
- Resource allocation
- Production scheduling
- Workflow management
- Capacity planning
- Assembly coordination
- Quality control integration
- Timeline tracking
- Resource optimization
3. Strategic Project Decision Making
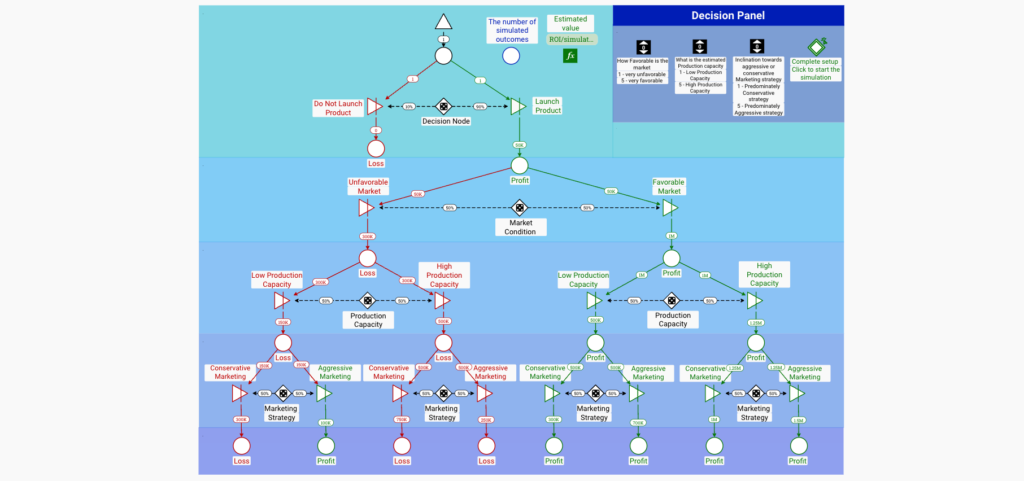
Interact with this diagram: Strategic Project Decision Making
This diagram illustrates project strategy and risk management.
It demonstrates:
- Decision point mapping
- Risk assessment
- Resource commitment planning
- Outcome probability modeling
- Performance tracking
- Strategy adjustment
- Investment planning
- Success metrics
What Other Project Management Diagrams Can You Create Using Machinations?
Machinations can be used to create various project management diagrams, including:
- Construction project planning
- Software development lifecycles
- Event planning systems
- Research project management
- Product launch planning
- Resource allocation models
- Budget management systems
- Risk assessment frameworks
- Team coordination flows
- Milestone tracking systems
Conclusion
Creating project management diagrams with Machinations offers unique advantages that make it superior to traditional project planning tools:
Dynamic Resource Modeling
- Test different allocation strategies
- Simulate project scenarios
- Track resource utilization
- Model dependencies
Financial Planning
- Budget allocation modeling
- Cost tracking
- Revenue projection
- ROI analysis
Risk Management
- Scenario testing
- Outcome probability modeling
- Contingency planning
- Impact assessment
Project Optimization
- Resource efficiency analysis
- Timeline optimization
- Cost reduction planning
- Performance improvement
By using Machinations for project management diagrams, organizations can create dynamic models that simulate project execution, measure outcomes, and optimize resource allocation.
The tool’s ability to model complex projects and test different scenarios makes it invaluable for project planning and management.
