

Unlike simple flowcharts, modern production diagrams need to account for parallel processes, resource constraints, and multiple assembly stages.
What is a Production System Diagram?
A production system diagram is a visual representation of how resources, components, and processes flow through a manufacturing or service delivery operation.
These diagrams help teams understand complex workflows, optimize resource allocation, and improve operational efficiency.
When Should You Create a Production System Diagram?
Create a production system diagram when you need to:
- Design manufacturing processes
- Optimize assembly lines
- Plan resource allocation
- Identify bottlenecks
- Balance workstation loads
- Improve throughput
- Track production capacity
- Manage complex workflows
Production System Diagram Examples Created with Machinations
1. Manufacturing Assembly Line
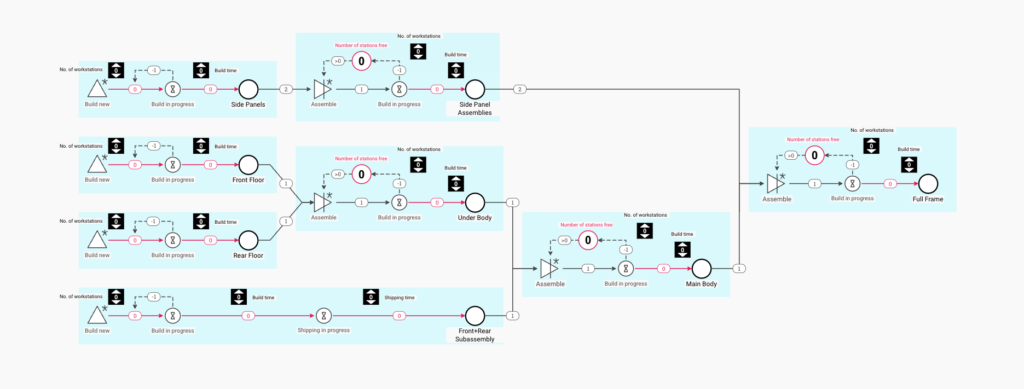
Interact with this diagram: Manufacturing Assembly Line
This comprehensive diagram shows a complete manufacturing and assembly process.
Key features include:
- Multiple component production lines
- Parallel assembly processes
- Workstation management
- Resource allocation tracking
- Build time monitoring
- Capacity constraints
- Assembly synchronization
- Production flow control
2. Resource Processing System
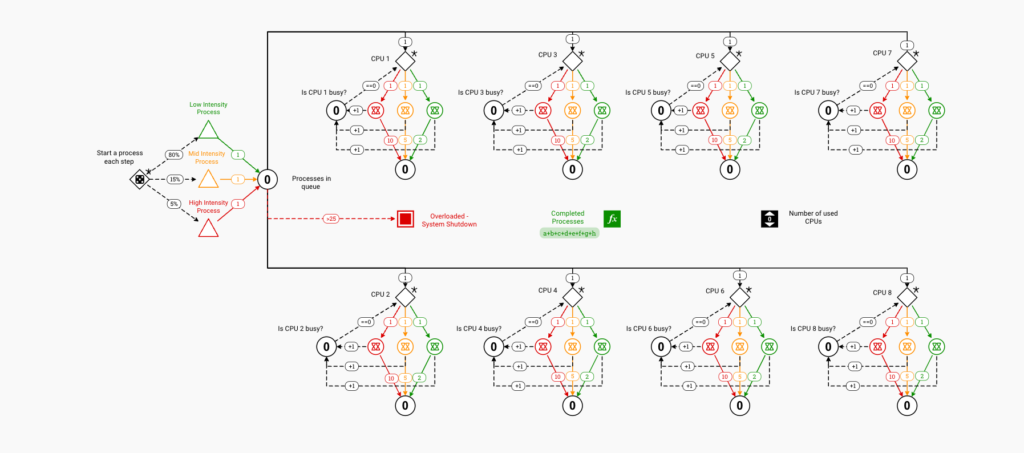
Interact with this diagram: Resource Processing System
This diagram demonstrates efficient resource allocation in a processing environment.
It shows:
- Multi-unit resource management
- Queue optimization
- Load balancing
- Capacity monitoring
- Process synchronization
- Resource utilization tracking
- System overload prevention
- Performance metrics
3. Order Fulfillment System
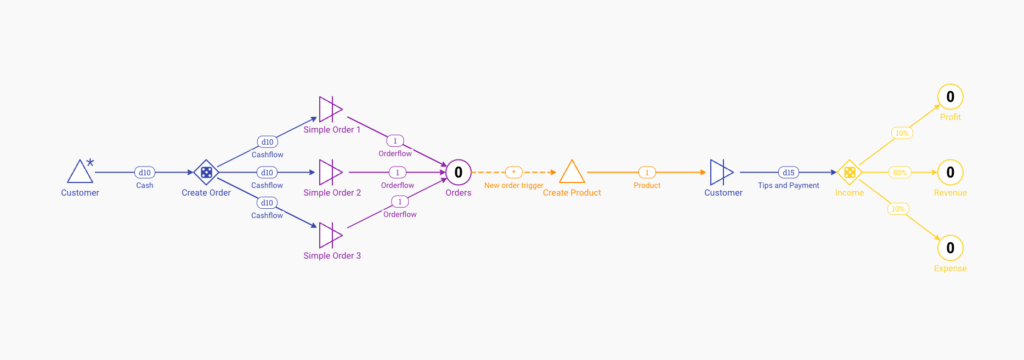
Interact with this diagram: Order Fulfillment System
This streamlined process flow shows a service delivery system.
It illustrates:
- Order processing workflows
- Resource allocation
- Production scheduling
- Delivery tracking
- Quality control points
- Performance monitoring
- Customer satisfaction metrics
- Revenue optimization
What Other Production System Diagrams Can You Create Using Machinations?
Machinations can be used to create various production system diagrams, including:
- Supply chain flows
- Quality control processes
- Inventory management systems
- Resource distribution networks
- Batch processing systems
- Assembly line balancing
- Material flow tracking
- Capacity planning models
- Maintenance schedules
- Production scheduling
Why Should You Use Machinations to Simulate Complex Systems
Creating production system diagrams with Machinations offers unique advantages that make it superior to traditional tools:
Dynamic Process Simulation
- Test different configurations
- Validate improvements
- Model complex interactions
- Measure performance impacts
Resource Management
- Track utilization rates
- Optimize allocation
- Identify constraints
- Balance workloads
Performance Analysis
- Measure efficiency
- Identify bottlenecks
- Calculate throughput
- Monitor KPIs
Operation Optimization
- Test process changes
- Validate improvements
- Calculate capacity needs
- Plan scaling strategies
By using Machinations for production system diagrams, organizations can create living models that simulate operations, measure performance, and drive continuous improvement.
The tool’s ability to model complex processes and simulate different scenarios makes it invaluable for manufacturing and operations management.
