


Unlike simple flow charts, modern flow optimization diagrams need to account for multiple concurrent paths, varying capacities, and dynamic routing decisions.
What is a Flow Optimization Diagram?
A flow optimization diagram is a visual representation of how resources, traffic, or data move through a system with multiple pathways and routing options.
These diagrams help teams understand bottlenecks, optimize routing decisions, and improve system efficiency.
When Should You Create a Flow Optimization Diagram?
Create a flow optimization diagram when you need to:
- Optimize traffic routing
- Balance resource flows
- Identify bottlenecks
- Improve system throughput
- Model capacity constraints
- Test routing strategies
- Analyze congestion points
- Plan infrastructure changes
Flow Optimization Diagram Examples Created with Machinations
1. Traffic Flow Management
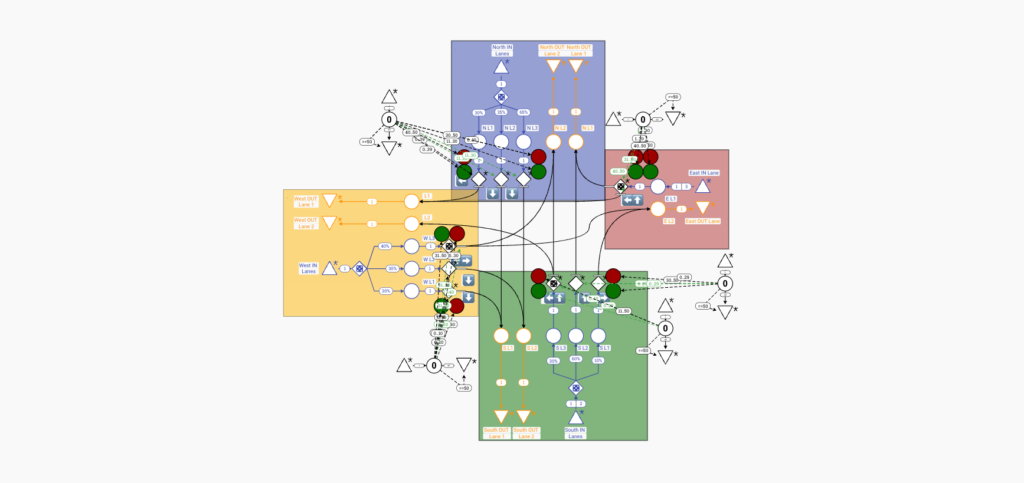
Interact with this diagram: Traffic Flow In Intersections Management
This sophisticated diagram shows a complex traffic management system.
Key features include:
- Multi-directional traffic flows
- Lane capacity management
- Intersection modeling
- Traffic signal coordination
- Routing optimization
- Congestion monitoring
- Flow distribution
- Efficiency metrics
2. Data Center Resource Flow
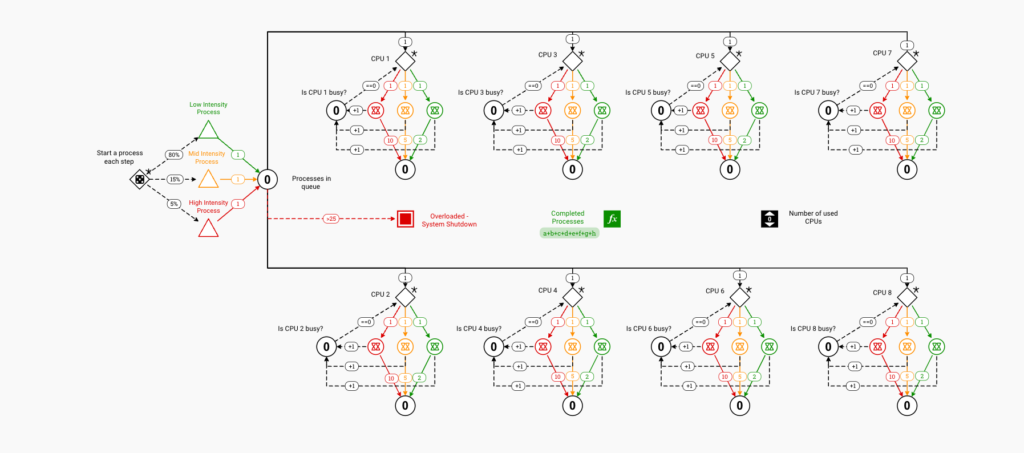
Interact with this diagram: Data Center Resource Flow
This system demonstrates computational resource routing.
It shows:
- Resource allocation paths
- Load balancing
- Queue management
- Capacity optimization
- Process routing
- System monitoring
- Performance tracking
- Bottleneck prevention
3. Manufacturing Process Flow
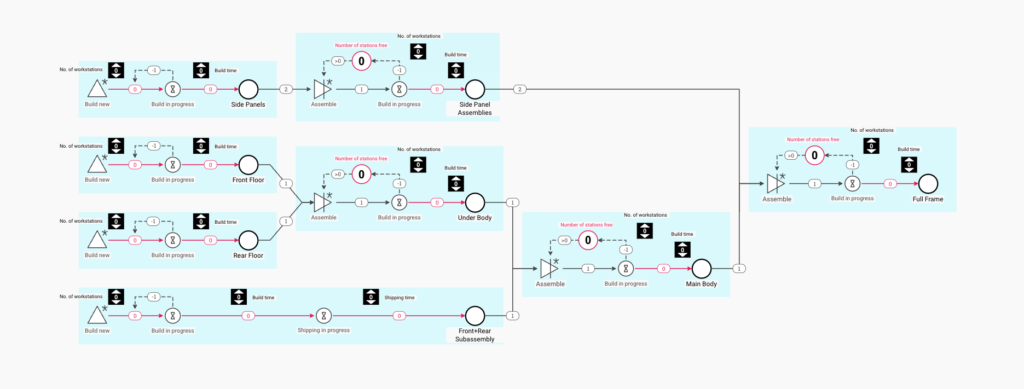
Interact with this diagram: Manufacturing Process Flow
This diagram illustrates production line optimization.
It demonstrates:
- Material routing
- Workflow optimization
- Resource distribution
- Assembly coordination
- Capacity management
- Process synchronization
- Quality control routing
- Efficiency monitoring
What Other Flow Optimization Diagrams Can You Create Using Machinations?
Machinations can be used to create various flow optimization diagrams, including:
- Network routing systems
- Supply chain logistics
- Public transport networks
- Resource distribution
- Data pipeline flows
- Energy distribution
- Inventory management
- Service routing systems
- Customer flow management
- Information routing
Conclusion
Creating flow optimization diagrams with Machinations offers unique advantages that make it superior to traditional flow modeling tools:
Dynamic Flow Simulation
- Test different routing strategies
- Model concurrent flows
- Simulate capacity constraints
- Analyze system behavior
Performance Analysis
- Measure throughput
- Track efficiency
- Identify bottlenecks
- Calculate utilization
System Optimization
- Test routing algorithms
- Optimize resource allocation
- Balance system loads
- Improve efficiency
Capacity Planning
- Model growth scenarios
- Test system limits
- Plan infrastructure needs
- Optimize resource usage
By using Machinations for flow optimization diagrams, organizations can create dynamic models that simulate complex routing scenarios, measure system performance, and optimize resource flows.
The tool’s ability to model intricate flow patterns and test different routing strategies makes it invaluable for improving system efficiency.
