Beyond Cells and Formulas: Machinations as the Perfect Spreadsheet Companion
Designing and managing complex game systems has long been anchored in spreadsheets, known for their structured and formulaic approach. Yet, as the scope of game design expands, the necessity for a more intuitive and visual tool becomes evident. Machinations emerges as this innovative solution, offering a visual representation of game systems, complementing the traditional strengths of spreadsheets.
Recognizing the potential of merging these two approaches, we’ve invited Nicolás Munafó, our skilled Architect and Game Designer, to shed light on this synergy.
Through a practical example, Nicolas will showcase how he skillfully merges the intuitive System Thinking approach of Machinations with the mathematical framework of spreadsheets and how integrating these approaches leads to a more comprehensive and effective game design workflow.
A short backstory
Two years ago, I was working on a souls-like project for my master’s degree, which required us to prepare a 20-minute demo to be presented in front of the faculty and our colleagues.
We decided to have two bosses during that demo, and a certain number of enemies that were necessary for the character to level up. We had agreed on several formulas and values for the level progression system and attributes, but we had not tested them in any way. We also had to be sure that the character was not too overpowered or weak before the final boss, or it would be extremely boring or challenging, respectively.
Some weeks before the final presentation, I decided to estimate how long it would take for the player to reach a specific level using spreadsheets. The system worked as expected and gave me the information I was looking for, though I wondered if there was a tool or method that I could apply specifically for balancing the economy of the game without using formulas in spreadsheets.
That is how I came across Machinations and decided to replicate everything I had defined in the spreadsheet.
And the goal of this article is to illustrate, with a generic example, how I worked both with Machinations and spreadsheets to find the right balance and pacing, capitalizing on the benefits that each one provided.
Balancing a Souls-like
For the purpose of this article, I have based my analysis on a generic souls-like game with the following mechanics:
- Every five minutes players fight a limited number of enemies
- After defeating enemies or bosses, players will earn a certain amount of XP (or souls/currency) depending on the area the character is currently in
- One boss will be encountered per area, which will reward them with more XP than a regular enemy, and the amount of XP increases for each area
- Players can spend their XP to level up
- All the XP that was rewarded and was not used for leveling up will be lost if the player dies. The chance of dying will vary subject to the area and the character’s level
Both models can be found below:
Souls-like balancing with spreadsheets
Souls-like balancing with Machinations
Mathematical or systems thinking
Certainly, both tools demand the creation of a system, with its respective entities and dependencies, abstracted through a model. The difference lies in the workflow required to conceive these models.
Take, for example, the process done with Machinations.
First I decided what each step means (in this case, it would be the timeframe set to 5 minutes) and then I started building my subsystems right away. I found it very valuable to have more of a systemic mindset, as I prioritized what I had to model (i.e. the subsystems and their components) instead of how I had to implement it.
It took me about 40 minutes to finish the diagram, as I had to implement the mechanics and rules that affected all components. Throughout the process I could leverage on how I built each part to perform unit testing before connecting everything together to make sure there were no errors.
Formulas took second place: I was aiming to build a system that resembled the actual game at first, not an absolutely accurate representation of the economy.
Spreadsheets, alternatively, are more of a formulaic and mathematical nature. Not being necessary, I started to separate my analysis with different cells, making references to other cells and so on until I got my final results.
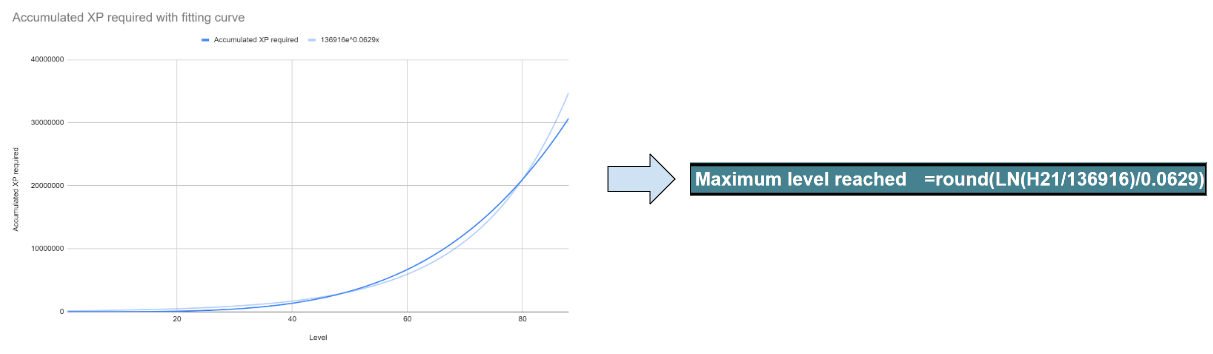
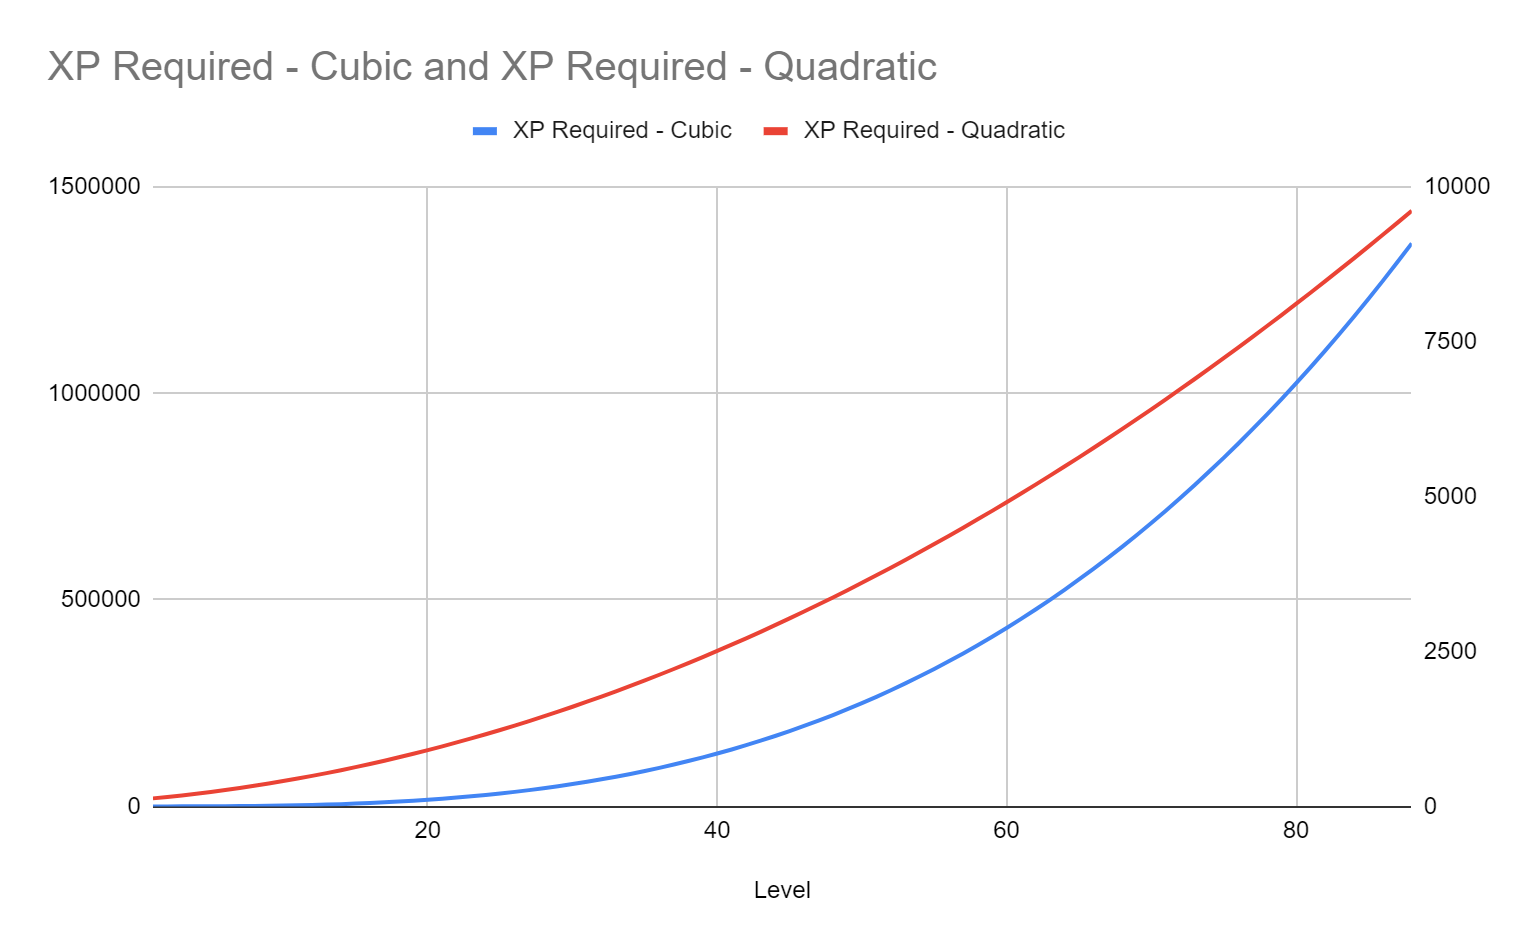
I spent around an hour and a half to elaborate and refine the model by itself. For example, there is a specific formula that describes the cost for leveling up. In Machinations, this cost is updated on each step depending on the current level of the character, whereas with spreadsheets I do not have a step-by-step breakdown. Hence, I had to estimate what level the player would get to with the accrued XP, finding a function that adjusts to this prediction, with the intrinsic error.
Estimating averages vs step-by-step calculations
Building the model in spreadsheets forced me to estimate different values with the data that I already had, as there are many interdependencies between many entities.
Consider the XP rewarded per enemy: you do not know how many areas the player will be able to go through, so you have to estimate the maximum number of areas that will be traversed (areas without dying) to get the maximum amount of XP earned per enemy (which is the XP earned in the last area). As a consequence, there will be a slight error due to approximating the total XP that will be earned by the player, alongside the maximum level they will be able to reach.
On the other hand, the model in Machinations does not need to extrapolate the XP: it calculates the amount of XP per enemy on each step, subject to the current area. These simulations can be done either for one player (by just hitting “Play”, with the possibility to see the simulation run in real-time) or for multiple player journeys in the background.
In both cases, the results are automatically plotted in the chart area, as explained into more detail in the “Sharing Results” section.
Making changes to the models
Once I decided that my model was accurate enough in both tools, the real work began. I noticed that progression was very slow: after 30 hours of gameplay, the player would go through 24 areas and their character would be in level 22. What changes did I have to apply to my models if I wanted to speed things up?
To solve this, in both models I need to define what variable or output I have to control (the character’s level) and then find its dependencies to detect what entities have effects on its value.
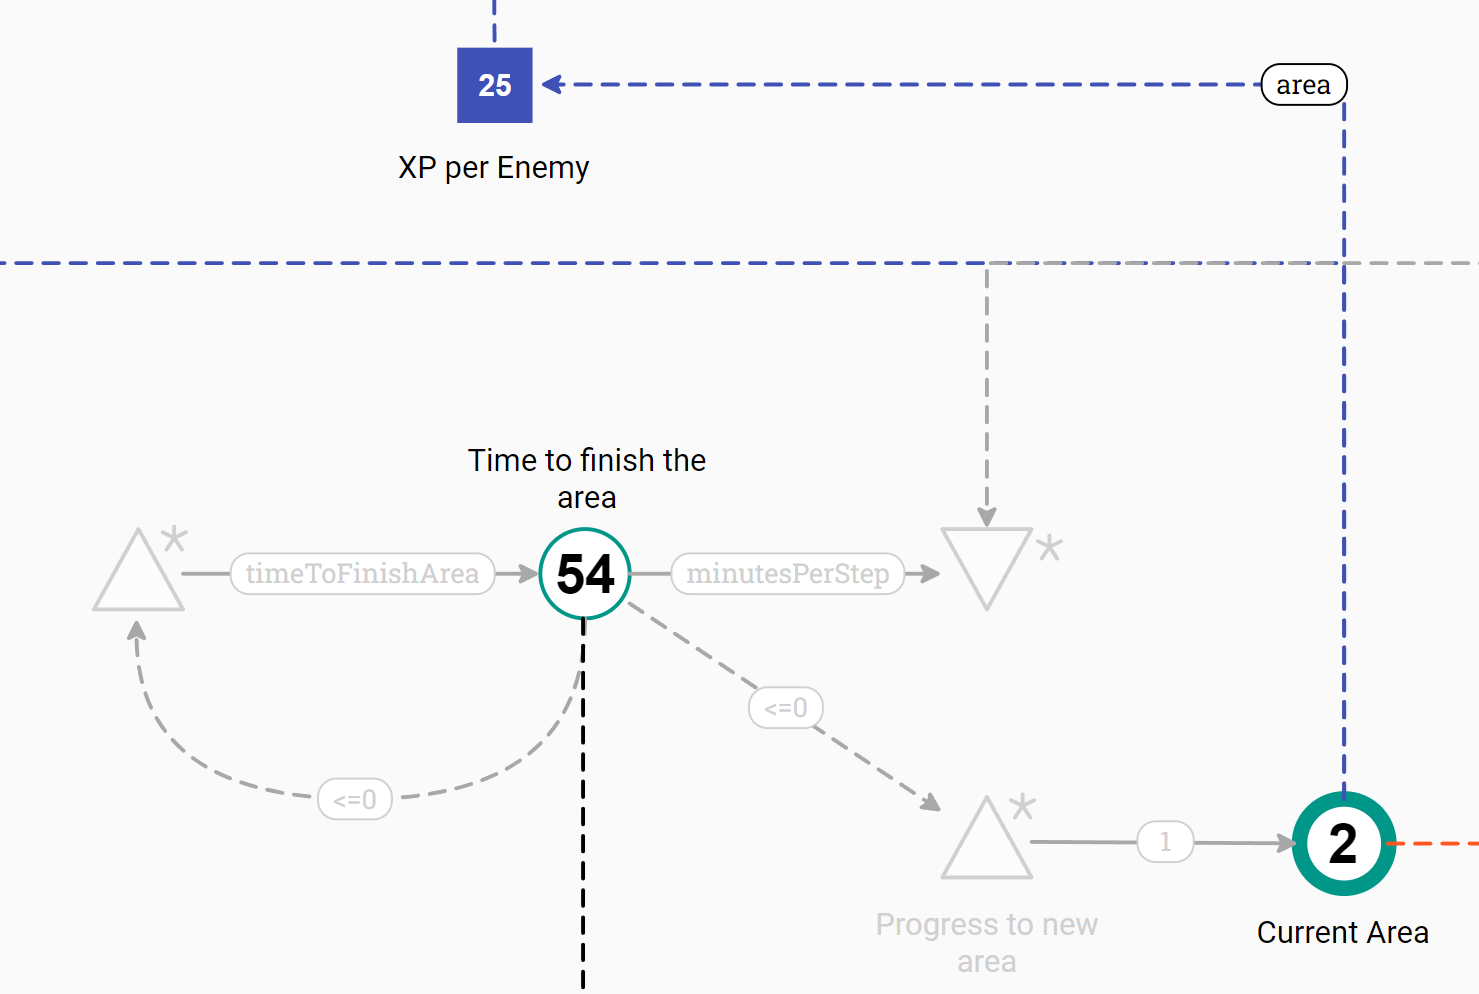
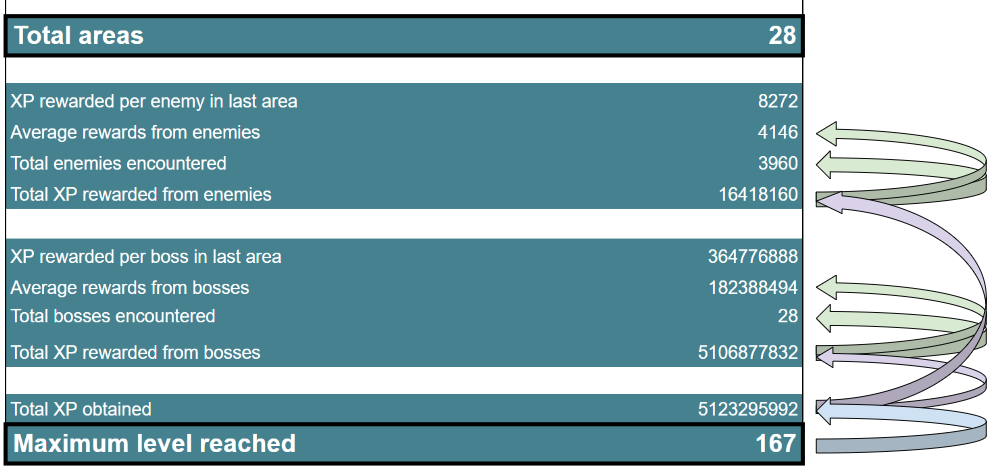
In the spreadsheet I have to read the formula in the cell that stores the level and trace back to understand what other cells have an effect on the level. The level depends on the total XP obtained, which at the same time is calculated based on the XP rewarded for all enemies and bosses, which at the same time depends on other cells. And the only way for me to find this out is by accessing each cell and reading its formula. It would be good to have some kind of visual guide to know how these relationships are without checking each time every cell, as shown in this screenshot:
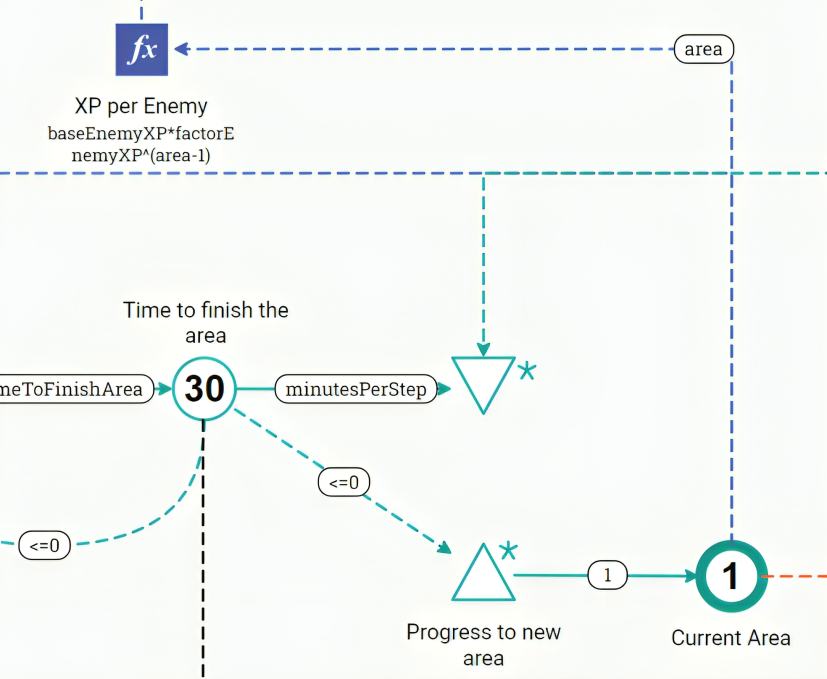
It was easier to pinpoint the actual cause of the issue with the model in Machinations. The connections between pools, sources and registers let me know that the level depends on the XP which at the same time is determined by the XP per boss and per enemy.
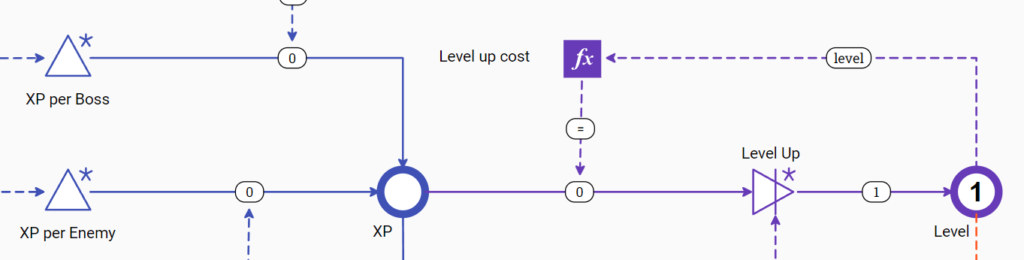
Visualizing how the system is built and the dependencies between each entity that is part of it really aided me to understand what I needed to change and keep tweaking it until I reached the appropriate pacing.
Sharing results
What should I do if I have to show my results to someone else? Or what if I have to collaborate with my colleagues and explain how they should apply changes to my models?
Centered around formulas and final results, the workflow with spreadsheets is limited to showing a table with final values. There is no recollection of progress, that is, what happened to the player along the way for them to reach a certain level. Everything, especially rules and behavior, is embedded in the formulas of each cell. We can only prepare a dashboard, highlighting the most significant KPIs so that other stakeholders can make decisions according to these values.

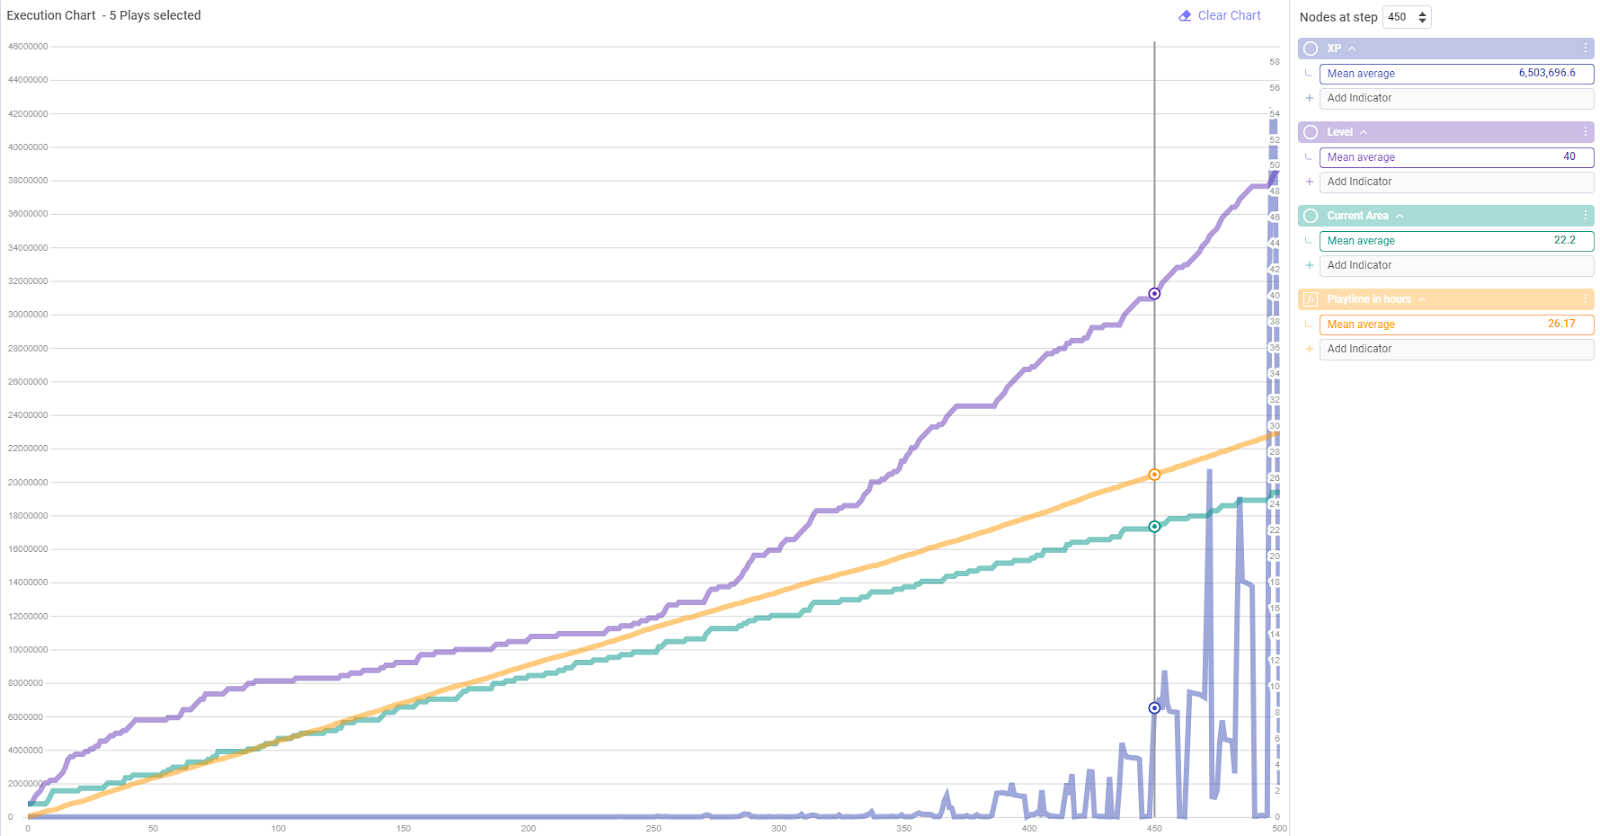
A more thorough view of the states of the player during gameplay can be obtained with Machinations in two ways. Charts are automatically built, showing the evolution (or involution) of some KPIs, with the addition of indicators for each one. For example, anyone that reads the chart can observe that after 26 hours, most players will have reached level 40 and area 22 on average.
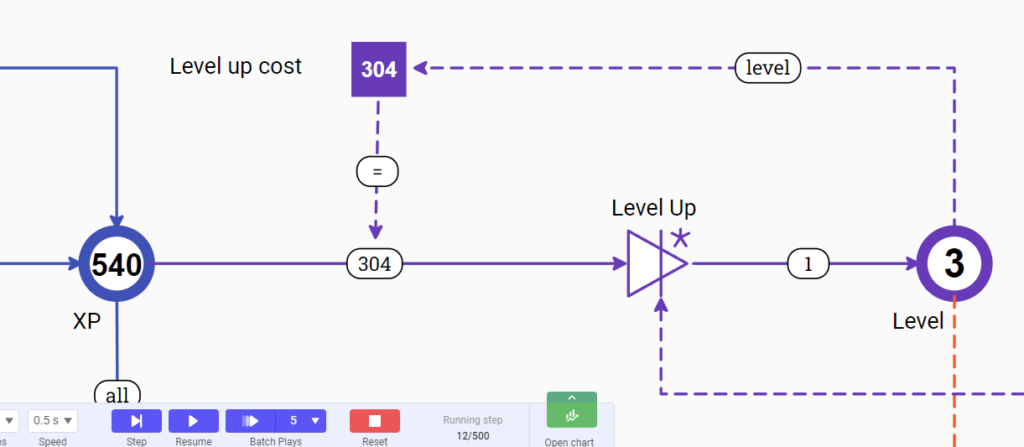
We can also show this progression on the diagram itself, as the values on pools and registers are updated on each step, depending on the rules and dependencies with other components. I am able to see that the player is on level 3 and next time they will be able to level up as they have enough XP to do so.
Creating synergies
Working with both tools, I realized that instead of replacing one with the other, it is more beneficial to leverage on the advantages that each one provides at each stage of the design workflow. These are some of my recommendations to “connect” these tools:
1. Use spreadsheets to define formulas
When designing a formula for leveling up costs, I started to test with different values until I had a curve that suited best the progression feeling I wanted to achieve.
Then, this curve was added to the Machinations diagram so that I was able to test it with the whole system.
If the final results of the simulations were not good enough, I would go back to the spreadsheet and redesign the formula.
2. Store global variables in spreadsheets and feed them to the diagram
Any value, such as leveling up base costs or XP per enemy, should be kept in a centralized section where a designer can apply changes, both for documentation and testing purposes.
This can be done in Machinations using custom variables, albeit if users are more familiar with spreadsheets, then they could store these values in specific cells.
Afterwards, a diagrams architect can feed these values into the Machinations diagram through custom variables to test them in the complete system.
3. Perform in-depth analysis of simulation results with spreadsheets
It may be relevant, especially for data analysts, to have a set of simulations to calculate different indicators and perform statistical analysis of the results.
Analysts can export the results of simulations with csv files, importing them into a spreadsheet for different reasons, such as studying the evolution of different players over the course of the simulation or obtaining the number of players that reached a certain level at a specific point in time.
4. Document values in spreadsheets and rules in Machinations
While spreadsheets are best at storing values, either as a way to document variables or analyze data, Machinations diagrams outpass them on a systems design level.
Rules, entities and their relationships should be visual and dynamic: it is better for anyone to see them to understand them at a glance, and at the same time test and refine them.
Game design, and more specifically, game economy design, can be so diverse and have many different philosophies, methodologies and best practices, that it would be very limiting to believe there is one Swiss Army knife tool.
Leveraging the strengths of both tools
Spreadsheets have been widely used for game economy balancing: there is no doubt that it provides a stable platform for creating and documenting mathematical models, with the ability to perform thorough data analysis. Nevertheless, it can be hard to add simple relationships, rules and player behavior to the equation.
And that is where Machinations comes to our aid: it is possible to comprehend and show how entities are intertwined, while at the same time test and tweak these relationships as part of the pre- and production workflow. Leveraging on the advantages of both tools can be of great benefit to any game designer that wants to ensure the accuracy and maintainability of their final product.
TL;DR
Visual representation of systems
- Machinations provides a clear visualization of the game economy system, making it easier to understand the interdependencies between different entities and how they affect each other.
- Spreadsheets are more formulaic and mathematical, requiring a step-by-step breakdown, whereas Machinations allows for a dynamic and visual representation of the system.
Ease of modeling and iteration
- Machinations offers a more iterative and dynamic workflow, where subsystems can be built, tested, and refined independently before connecting them to the overall system.
- Spreadsheets, on the other hand, follow a more linear and formulaic approach, which may limit the ease of iteration and testing of individual components.
Real-time Simulations
- Machinations provides real-time simulation capabilities, allowing the designer to see how changes in one part of the system affect the overall balance immediately.
- Spreadsheets may require manual calculations and estimations, leading to potential errors and a slower feedback loop.
Optimisation Tools
- Machinations offers tools like the Balancer, which allows designers to optimize specific targets in the diagram based on influencers or independent variables.
- Spreadsheets provide the possibility of implementing Monte Carlo simulations, but optimizing variables may not be as straightforward as with Machinations.
Dynamic Documentation
- Machinations diagrams inherently document the rules, entities, and relationships within the game economy system, providing a more dynamic and visual way to communicate the design to others.
- Spreadsheets are centered around formulas and final values, offering limited recollection of progress and requiring the creation of dashboards to highlight key performance indicators (KPIs).
Synergy with Spreadsheets
- I suggest a synergistic approach: the use of spreadsheets for defining formulas and storing global variables and Machinations for visualising and testing the system.
- Machinations diagrams can be enriched with formulas tested in spreadsheets, creating a more comprehensive and accurate representation of the game economy.
Thorough Analysis with Spreadsheets
- Spreadsheets are useful for in-depth analysis of simulation results, enabling the calculation of different indicators and performing statistical analysis.
- Analysts can export simulation results from Machinations to spreadsheets for further analysis, combining the strengths of both tools.
While spreadsheets offer a good solution for creating and documenting mathematical models, Machinations provides a more dynamic and visual approach for understanding, testing, and refining complex game economy systems. Leveraging the strengths of both tools can be advantageous for game designers aiming for accuracy and maintainability in their final products.